Last week I laid out the main talking points I have been using on advisor calls: the AI buildout is getting more expensive, the new Fed Chair appears serious about inflation, inflation itself is showing signs of becoming more structural, and despite all of that, earnings growth and the economy are still holding up fairly well.
That combination creates one of those environments where the market can still look healthy on the surface, while the risks underneath are starting to shift. This does not mean the rally has to end tomorrow. It also does not mean advisors should tell clients to run for the exits. What it does mean is that we need to be careful about assuming the winners of the first phase of the AI boom will automatically be the winners of the next phase. Higher financing costs, a more inflation-focused Fed, changing corporate spending priorities, and stretched investor expectations are all starting to matter more.
The good news is that this is exactly why planning, diversification, and discipline still matter. Markets can chase exciting stories for a while, but clients do not reach their goals by owning the most exciting stock or theme at exactly the wrong time. They reach their goals by staying invested in a way they can actually stick with when the story gets more complicated.
If you missed last week's blog, check it out here:
 Jeff Hybiak, CFA
Following up briefly with each of last week's talking points ............
AI Buildout Costs are a Risk to the Rally
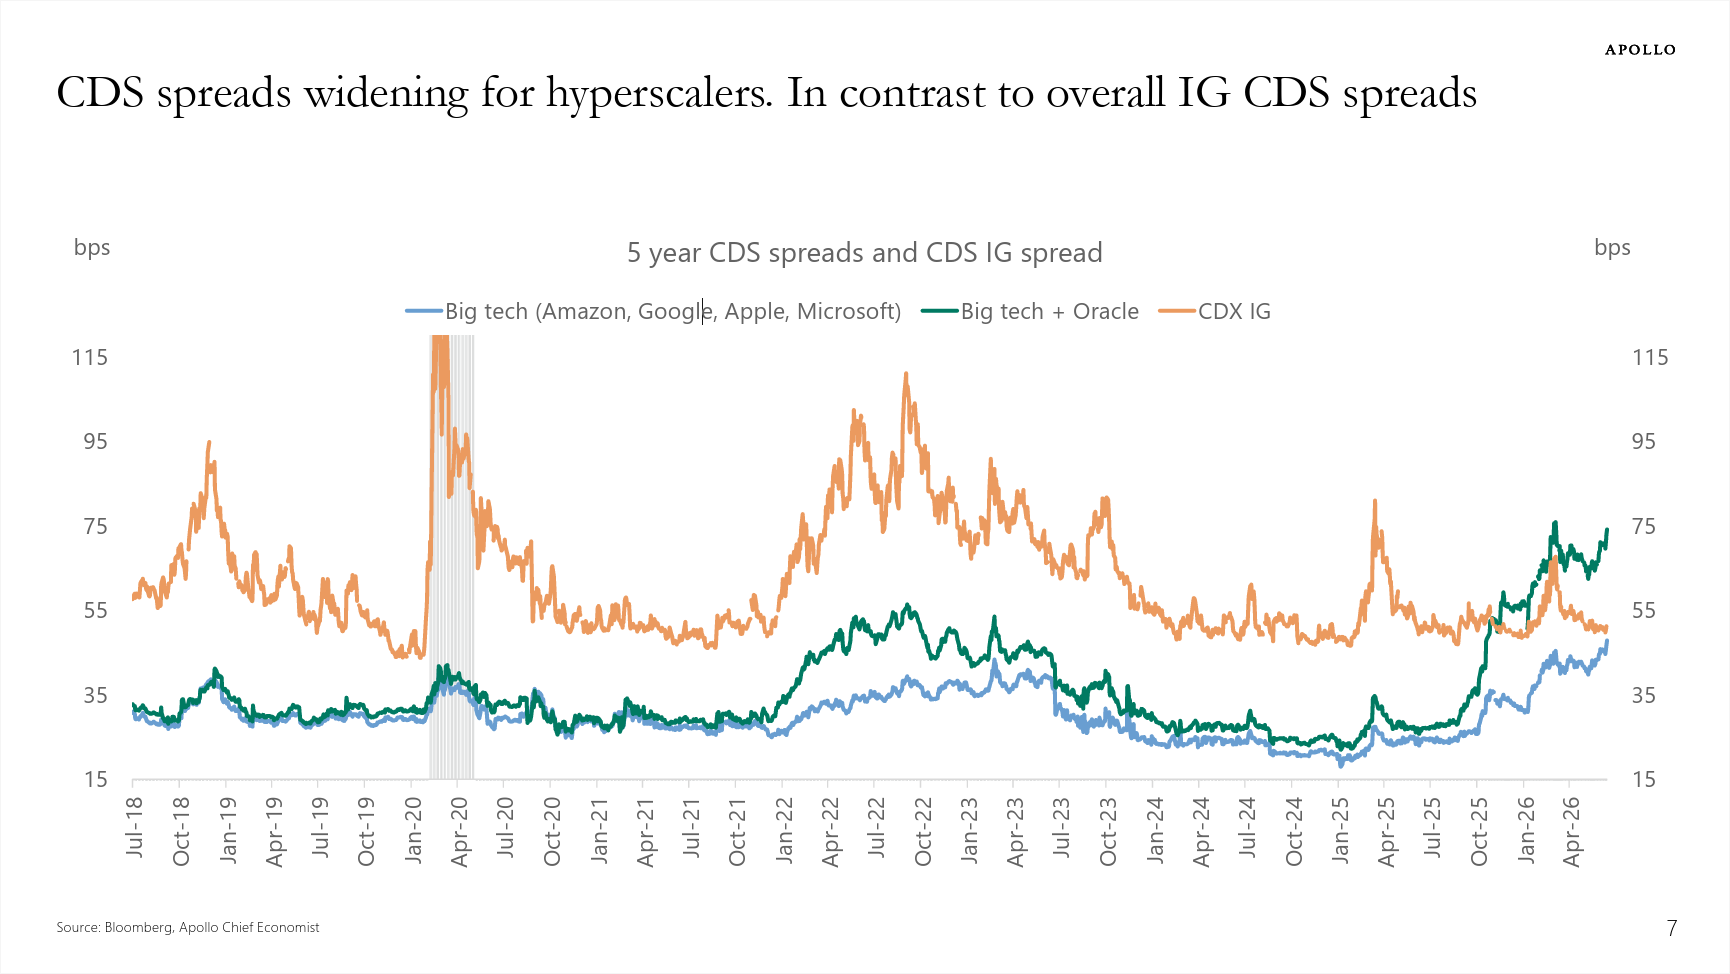
George shared with me last week a presentation from Apollo's Torsten Slok discussing this. The entire package is worth a look, but tagging on to something I mentioned last week – increasing costs to borrow money to finance the data center buildout, this chart is interesting to nerds like me. It highlights the increase in Credit Default Swap (CDS) spreads for the hyperscalers in comparison to Investment Grade (IG) spreads. This is an early indication of perceived risks inside that market. While nothing like the financial crisis, we can see the spreads converging with the overall IG market for Amazon, Google, Apple, and Microsoft (the hyperscalers). The issue is Oracle, who is at the center of most of the data center buildout projects bringing the spreads to the highest levels on record for the group.
This will make everything more expensive and potentially slow growth and/or hit earnings growth.
The Fed Chair reiterated his seriousness about inflation
In his first testimony to Congress last week, Fed Chair Kevin Warsh confirmed his decidedly hawkish tone, emphasizing that the Fed has "no tolerance for persistently elevated inflation" and signaling that restoring price stability remains the central bank's top priority, even as inflation data continues to improve. He also criticized the changes the Fed made in 2020, described inflation as a tax on all Americans, and highlighted the danger of the Fed carrying such a large balance sheet.
Again, I think this is a positive for the markets long-term, but the market has been running since the Alan Greenspan era believing the Fed will always be there to bail them out. Having a Fed Chair who realizes the long-term consequences of this is different than most market participants are used to.
Inflation is more than just oil
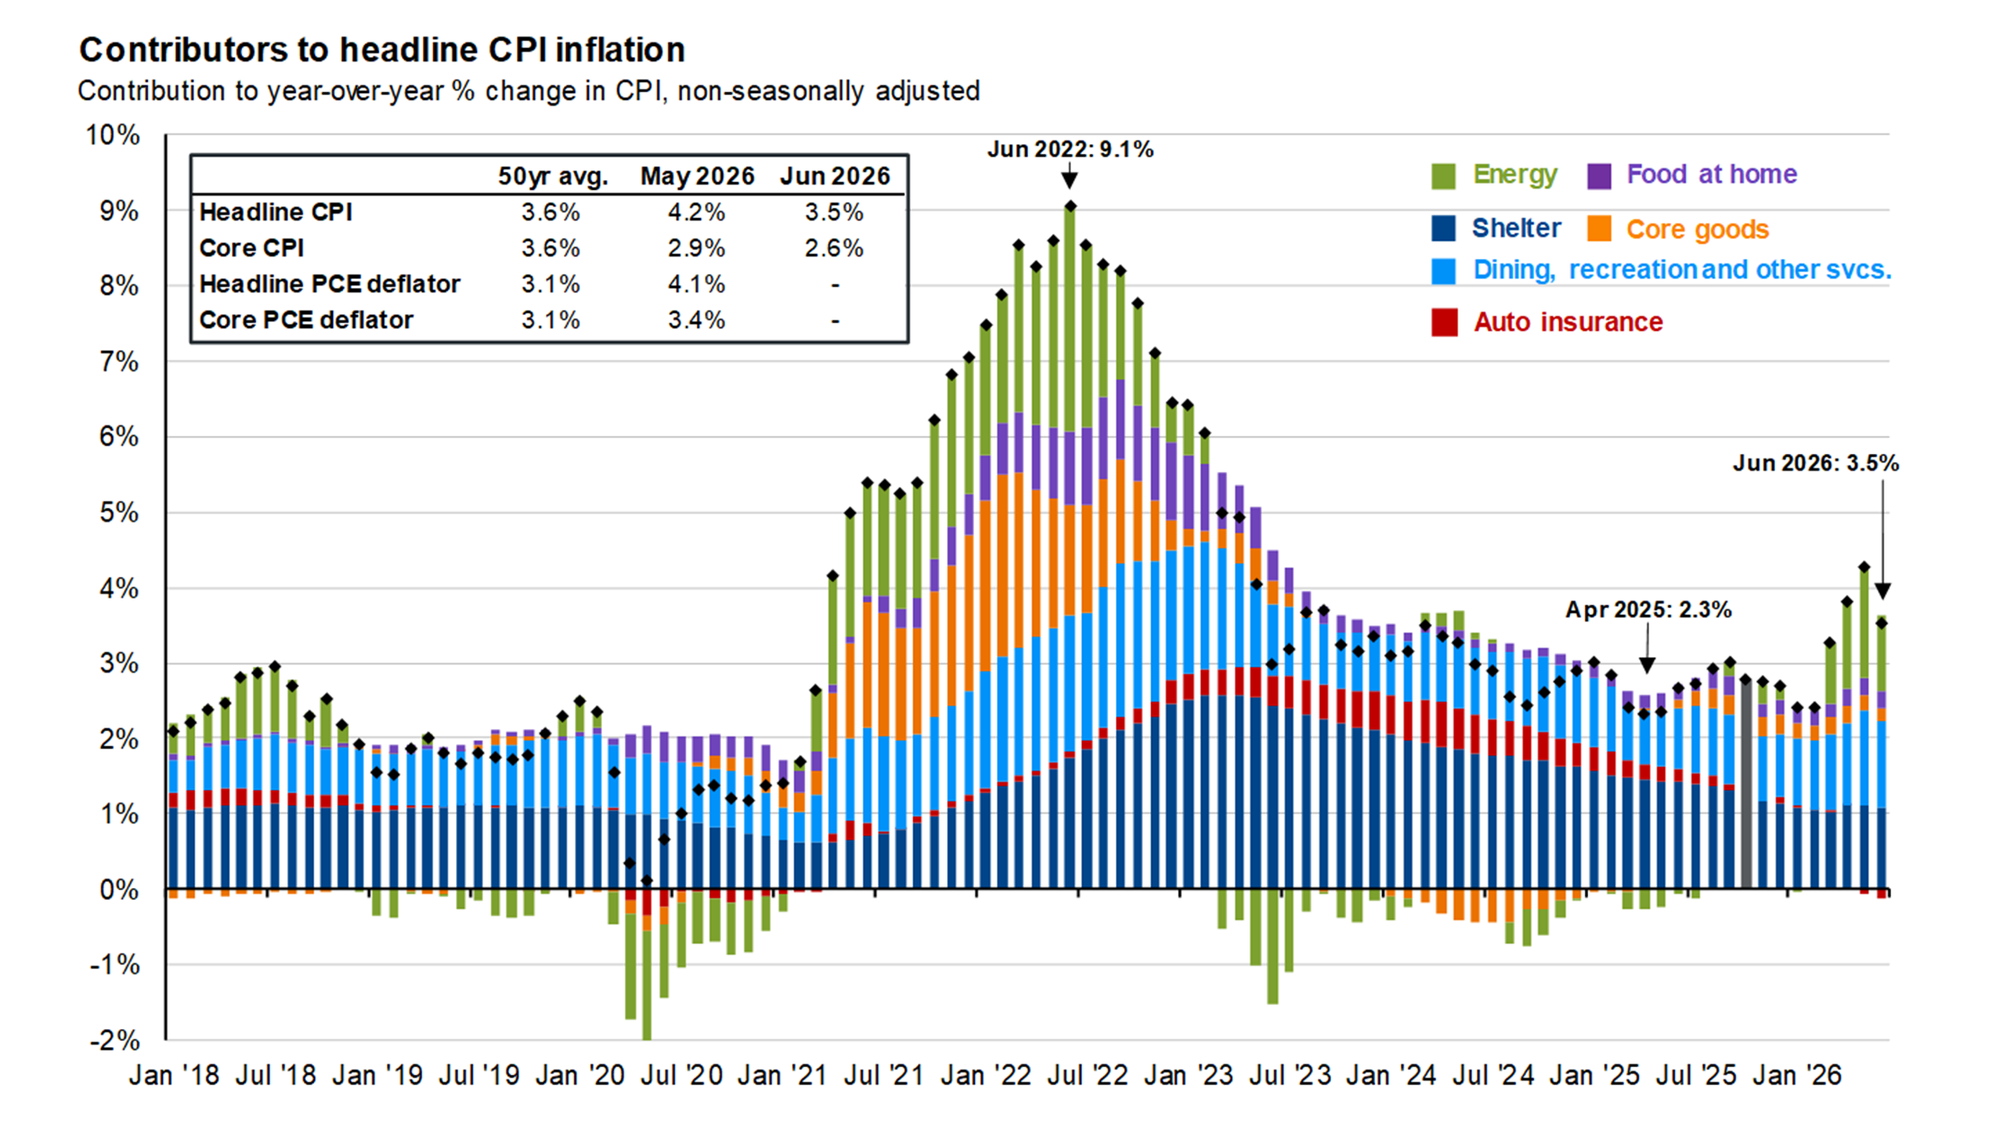
Last week's CPI inflation report was "better than expected", but at the same time came in well above 3%. This could make the Fed's job much more difficult. Add to that the increase we are again seeing in oil as the Iran War is apparently not over yet, despite numerous "agreements" that it was.
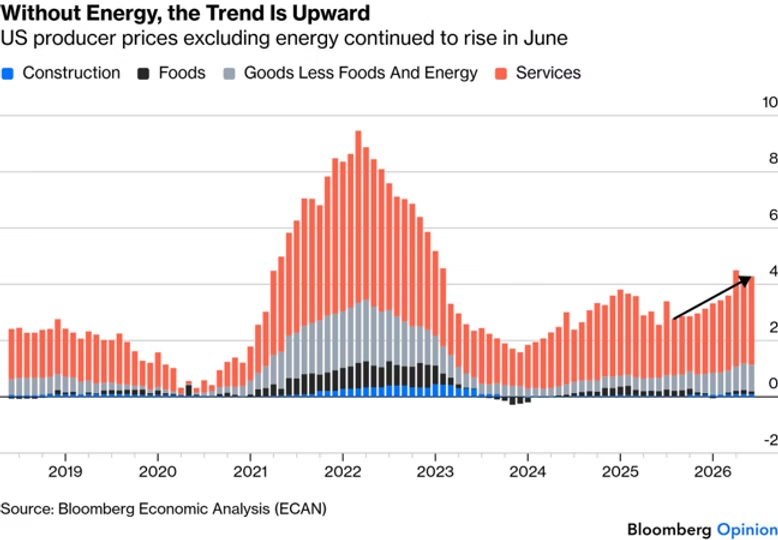
Probably the bigger problem is what we saw in the Producer Price Index (PPI). This chart from Bloomberg highlights the problem: producers are seeing price increases beyond energy, mostly from the services side of the equation.
Earnings are strong, but not everyone will win
IBM issued a warning last week that took 25% off their stock price in a single day. The issue wasn't so much the earnings this quarter – their pre-announcement has revenue just 1% below the consensus estimates. The problem is IBM said they are seeing customers switch away from buying their core products to invest more in AI.
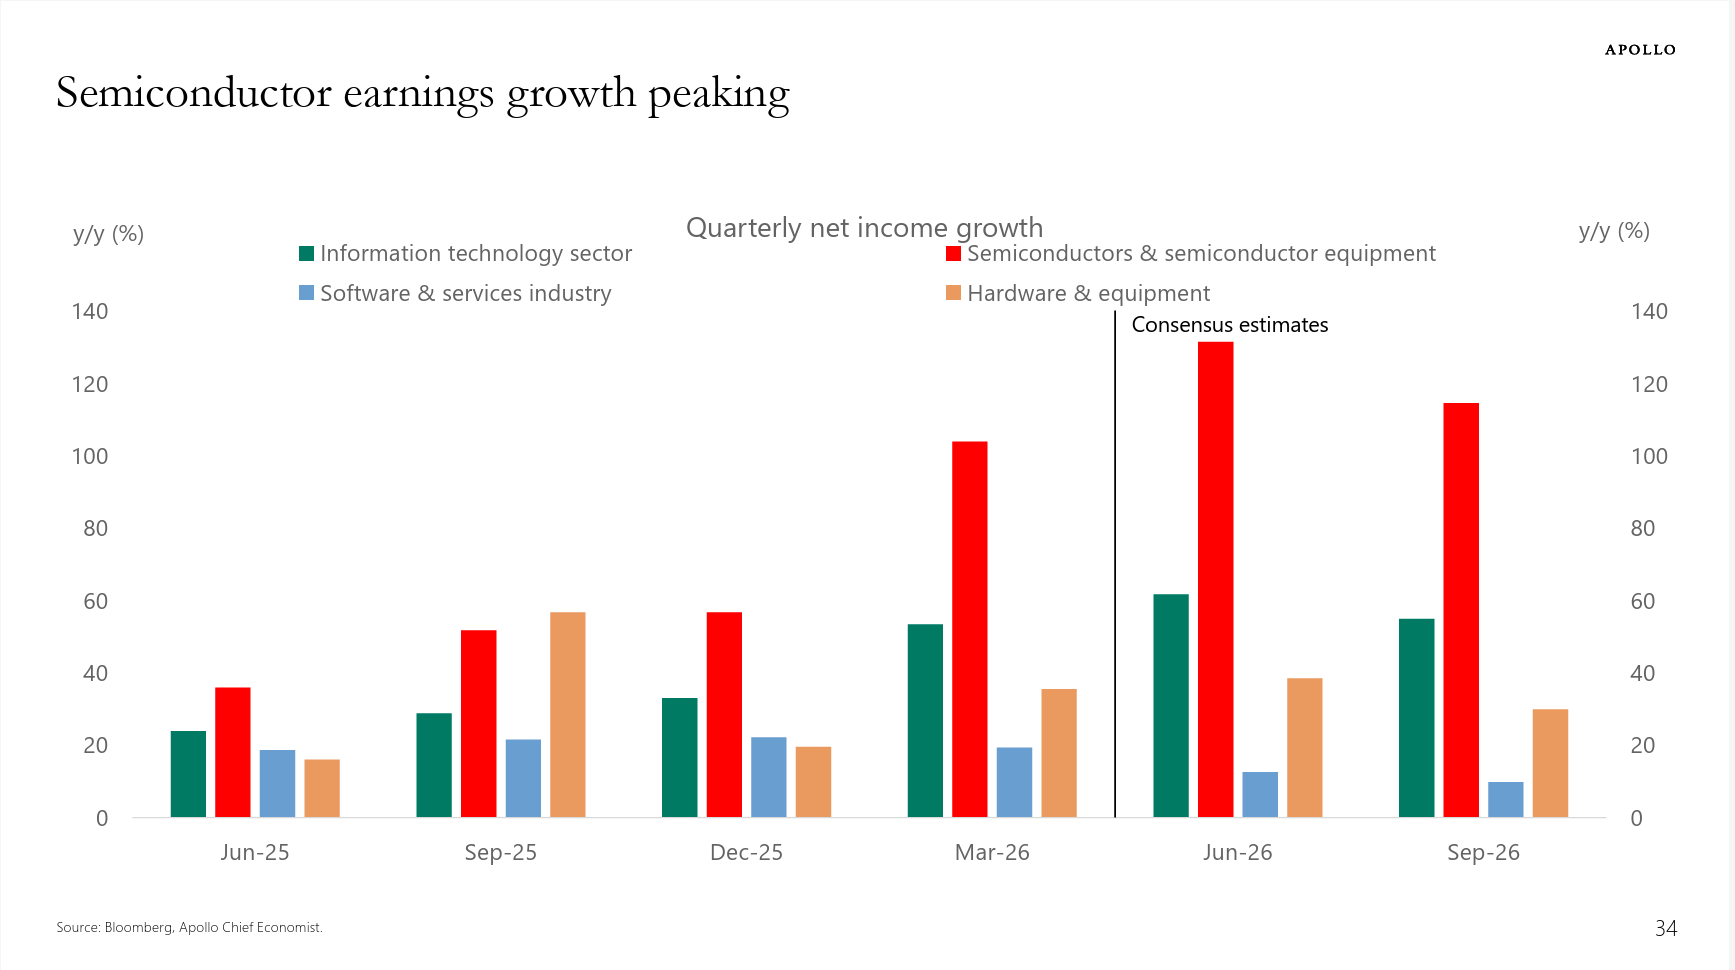
Software as a Service (SaaS) stocks are clearly the most at risk of seeing their earnings/revenue hit from AI, but going back to Mr. Slok's presentation discussed earlier, this could carry into other sectors. While still strong, the highest growth segment for the market this year, semiconductors may be hitting peak earnings growth this quarter.
We also saw a potential problem emerge last week as the Chinese company Moonshot AI released the "Kimi 3" model which initial accounts have said is more powerful and efficient than the best models from Anthropic. Unlike the "Deep Seek" moment which hit the hardware manufacturers in January 2025 over concerns the more expensive US manufactured chips would not be in high demand, Moonshot's apparent leap serves as a reminder the still private US companies Anthropic and OpenAI may have stiff competition. Given the deals these two companies have made by using their (private) stock to procure hardware and services, a lower valuation would be devastating to the balance sheets of the companies who have been selling to them.
Obviously, like we learned with Deep Seek, this is a highly competitive space where new threats could emerge out of a brand new company at any point, which brings me to my last point.......
Identifying the Leaders is a Dangerous Game
Finally, I've mentioned this many times the past few years. While the AI buildout most certainly has more potential than the broadband buildout of the late 1990s-early 2000s, we can learn from past peaks that the "leaders" in the middle stages (which we are rapidly approaching) may not end up dominating the industry.
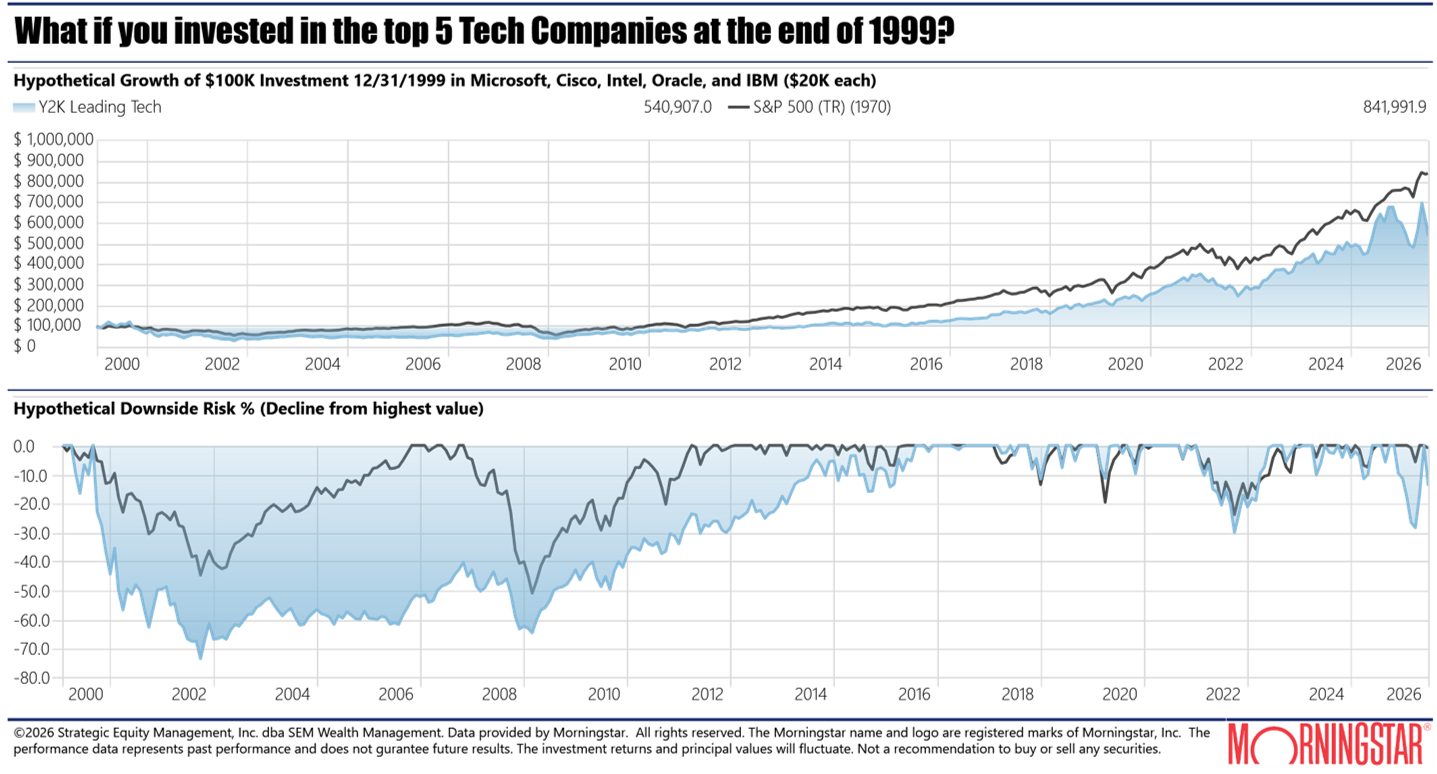
Going back to 1999, the top 5 technology companies in terms of market capitalization were Microsoft, Cisco, Intel, Oracle, and IBM. While they all have survived, had you chosen to invest equally in those 5 companies just ahead of the peak of the expansion you would have lost nearly all of your money by late 2022. If you stuck with it, you would have eventually recovered your investment........at the end of 2015.
Trusting the broader index to sort out the winners and the losers would have still led to large losses (half the account value) and you would have recovered your original investment much sooner (although not until 2006.....just before the financial crisis).
This is important to understand given the brief euphoric celebration of SpaceX going public. The first few days saw investors chase the stock above $200, for the NASDAQ to change their rules to get them into their indexes almost immediately, and for the Wall Street firms to let Elon Musk dictate shareholder rights (or lack-there-of) as well as the IPO price. Standard & Poor's (S&P) stuck to their rules despite pressure from many. The fact they do not allow non-profitable companies to enter their indexes does provide some protection for investors.
All of that of course does not take away the risk of losses, but it does keep the fund from chasing investments that may not be good long-term holdings.
More importantly, at SEM we understand the value of long-term investing, staying the course, and holding diversified investment portfolios while still being flexible enough to take part in changes in the market environment. One thing most people miss, however, is the risk of losing track of the financial plan or being invested in a portfolio that you either cannot afford the risks being taken or one where you will not stick to the plan due to the risks inside the investments.
So while we do see rising potential the market could be entering a more dangerous environment, we are still happily participating in it inside our various investment models.
Is Artificial Intelligence Going to Take My Job? No One Can Agree.
It seems we can't go a day without hearing conflicting and passionate sides to the question, "Will AI Take My Job?" From a historical perspective, we have reason to be optimistic. If we go back more than a century, the average worker spent far more time working than they do today. It was only in the early 20th century that six-day workweeks became more common. Maybe we are just asking the wrong question. Let's take a deeper dive.
Looking at the chart below from Apollo Wealth's Chief Economist, Torsten Slok, his team asked researchers to gauge how much AI affects a job by providing a rating. They were asked to provide an answer between 0 and 1 based on how many tasks could be done, or already are, with AI. For example, if closer to 1, the more exposed the job.
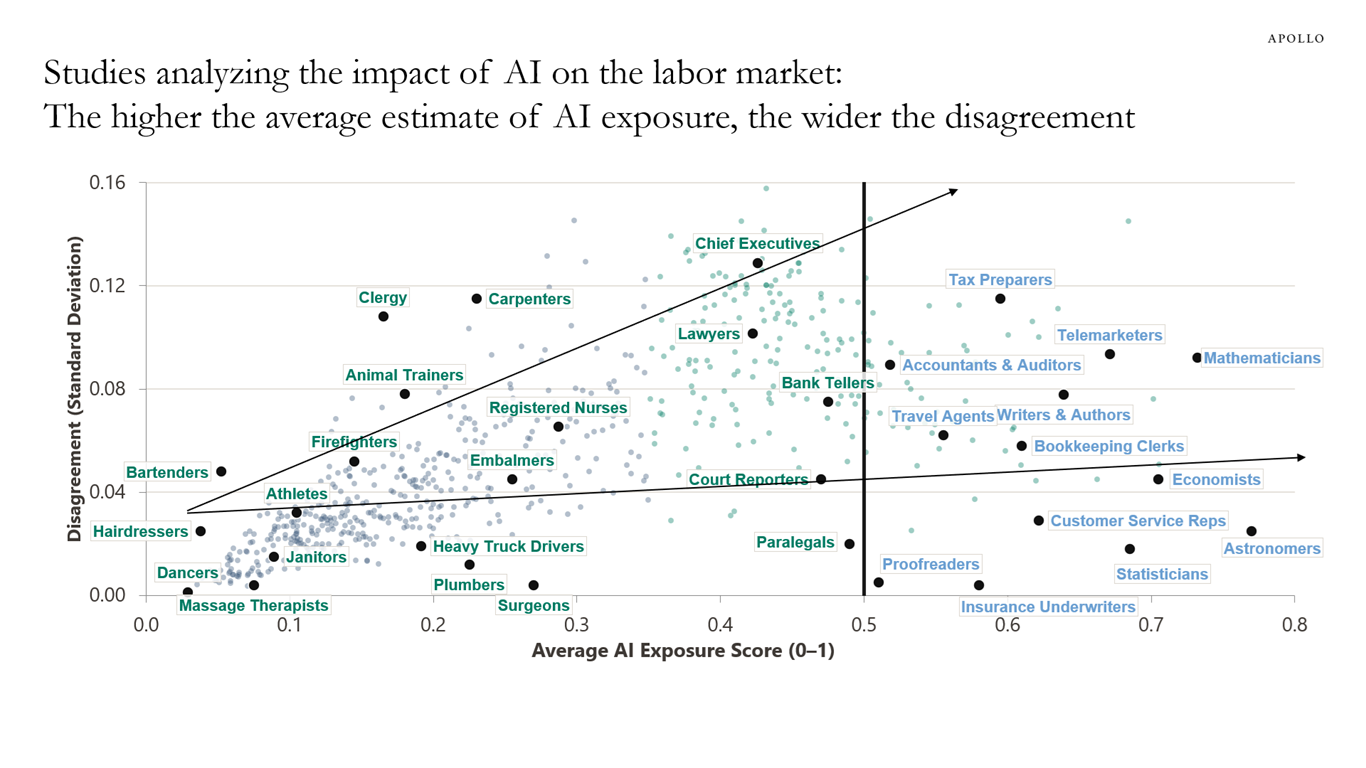
Their findings show agreement for low-exposure jobs, like dancers and hairdressers. By contrast, high-exposure jobs that the general public worries about, like economists, accountants, and tax preparers, disagree widely.
To put it simply, the jobs most likely to be called "at risk" are understood the least.
These roles involve many different tasks, so AI can handle some while still struggling to fully automate others, which helps explain why the measures disagree.
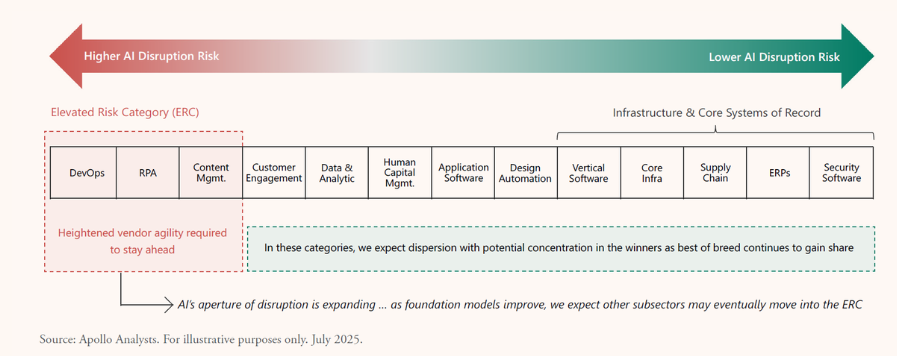
Expanding on their framework, Apollo's Thematic Investing team shared their evaluation of disruption risk across the software ecosystem by breaking the industry into subsectors and assessing which workflows were most susceptible to automation by large language models. In addition, they considered switching costs, regulatory barriers, proprietary data, network effects, and the cost of failure.
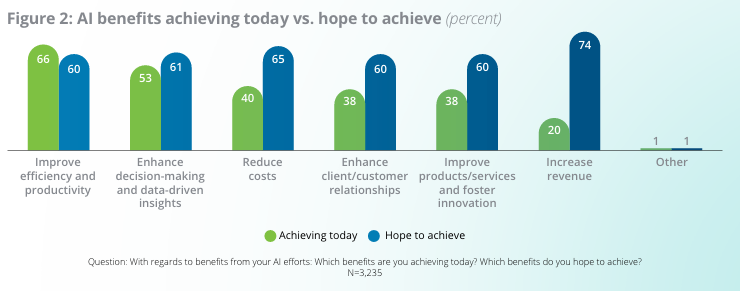
From an employer's perspective, organizations shared that their reasons for adopting AI can range from removing redundancy and improving efficiency to improving the current pipeline of products or services.
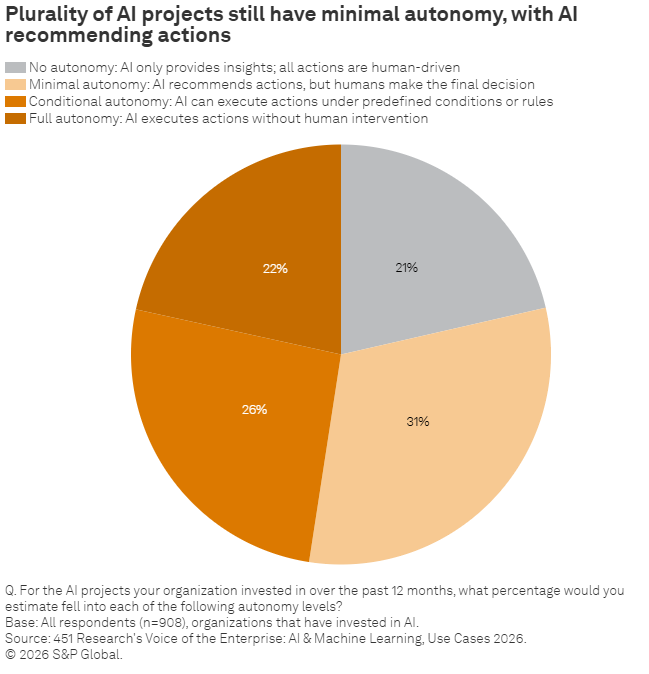
Currently, administrative tasks are commonly being automated, with autonomy remaining limited, based on a recent S&P Global study.
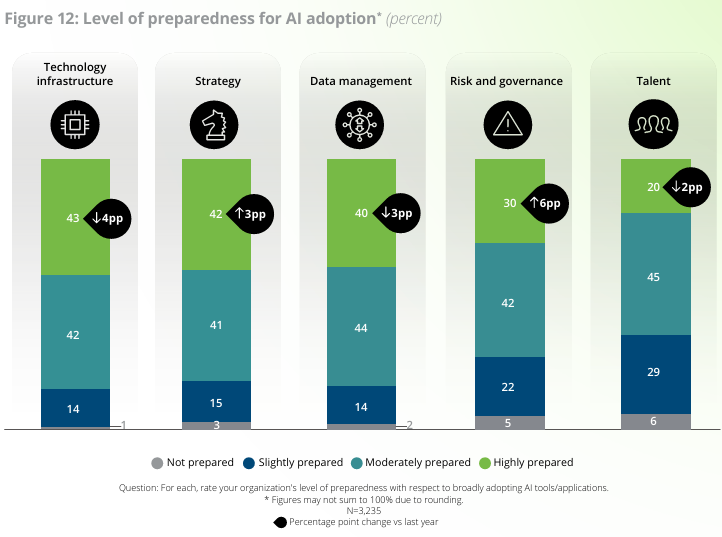
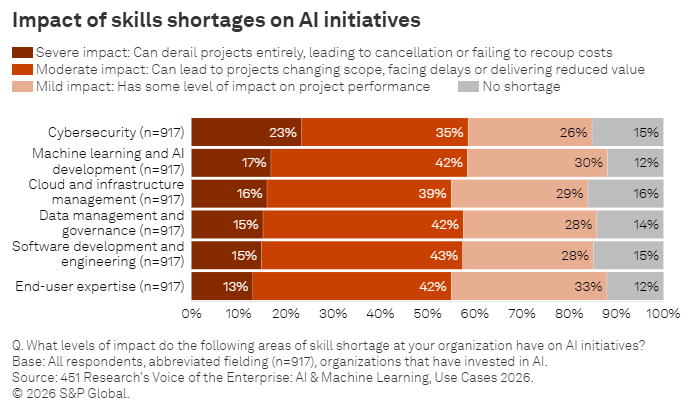
Firms deploying AI will be forced to maintain the security, accuracy, and scope of their models and may be open to hiring skilled labor across various technological functions, even if they are not fully prepared to add more headcount.
As we've seen thus far, technological advancements are continually introduced and evaluated. At SEM Wealth Management, we treat artificial intelligence as a tool rather than a replacement, whether to seek investment opportunities that support our bespoke idea generation and disciplined risk management approach, or to strengthen internal operations initiatives so advisors can continue concentrating on their clients' needs.
Thank you to all of the visitors who read last week's "Chart of the Week". I hope to continue sharing these talking points about markets, investing, etc., for you to share with family, friends, coworkers, or anyone along the way.
See you next time!
Market and Economic Data
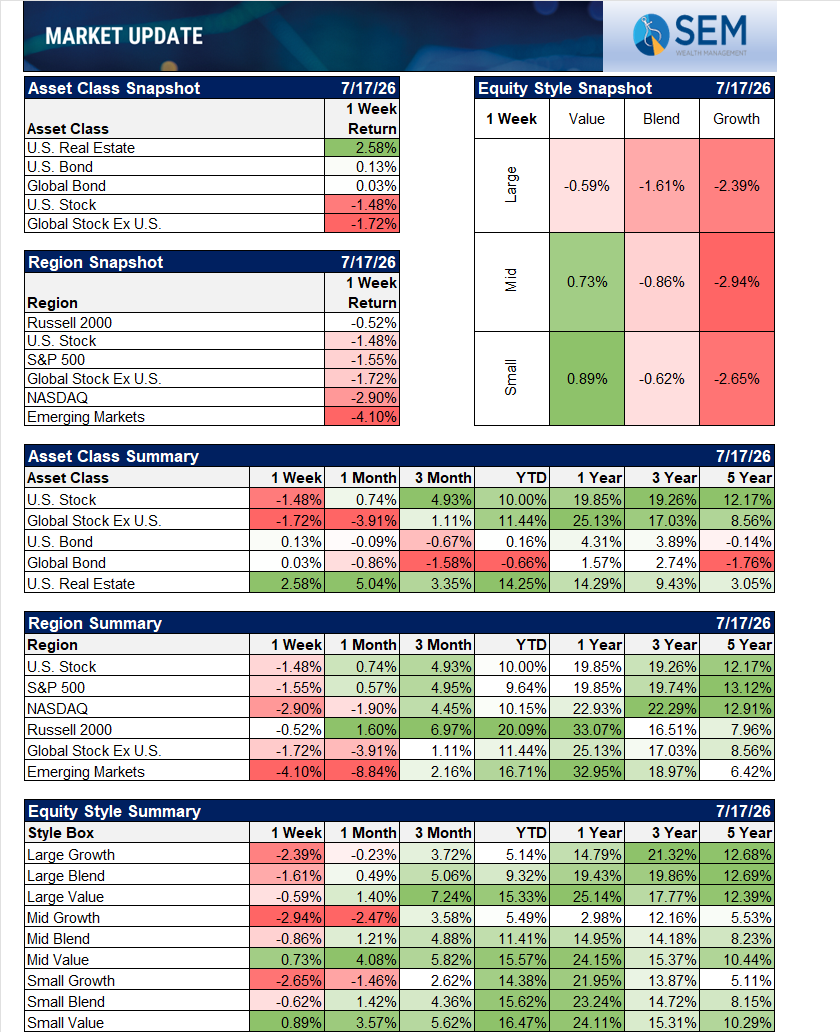
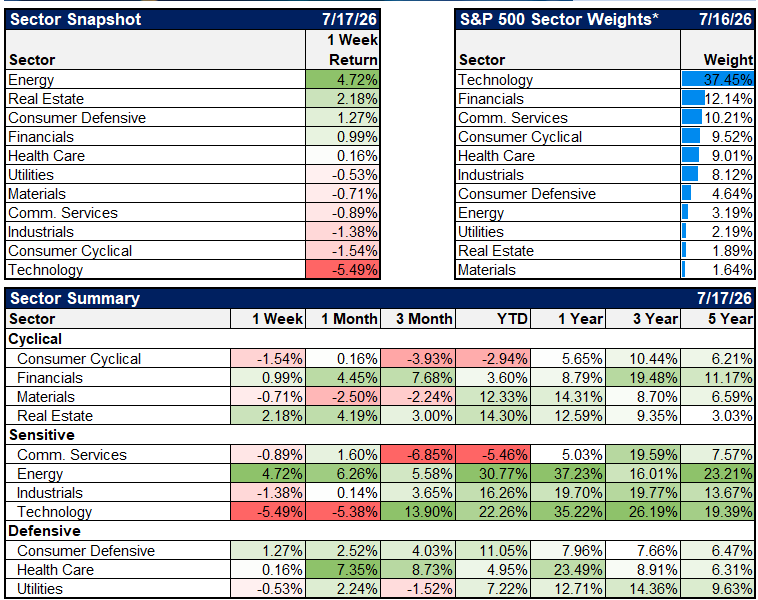
It was a choppy week for the S&P 500, with large cap growth / technology stocks dragging the market throughout the week.
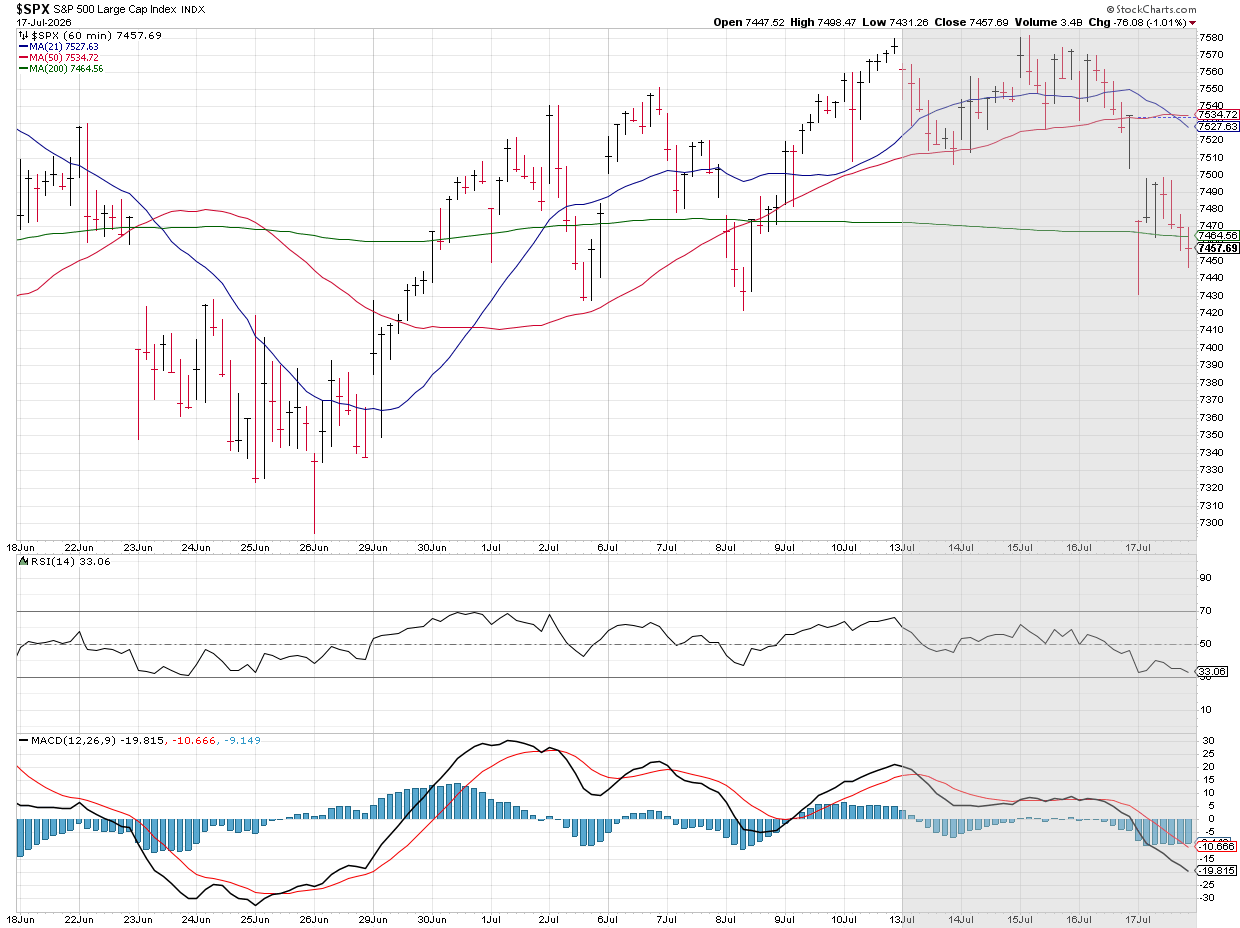
Probably not by coincidence, the 7500 level on the S&P 500 seems to be an area of resistance. This is where the S&P was the day Kevin Warsh chaired his first meeting with the Fed.
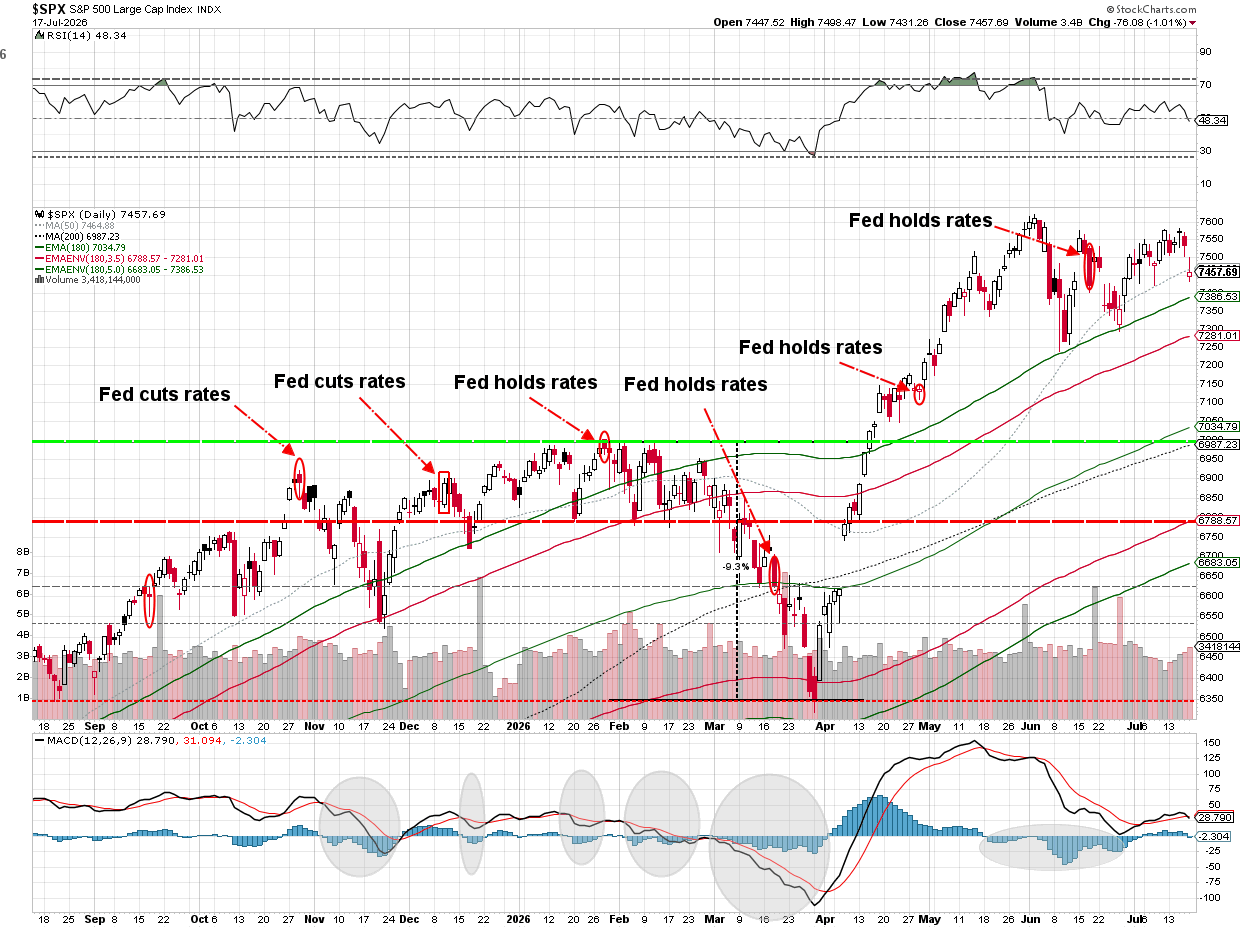
Economic Data
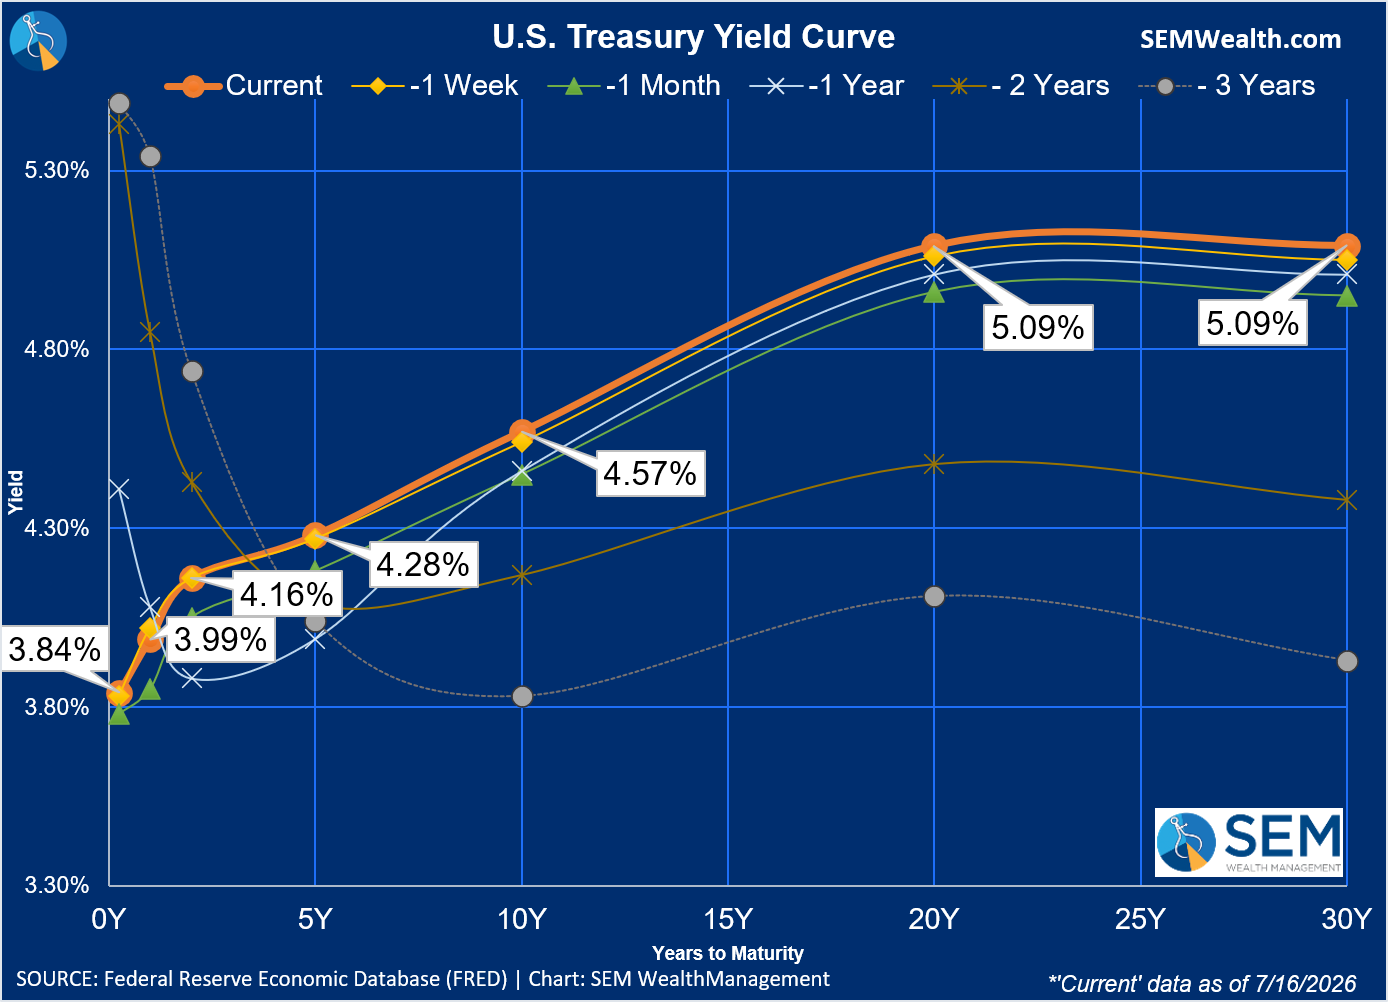
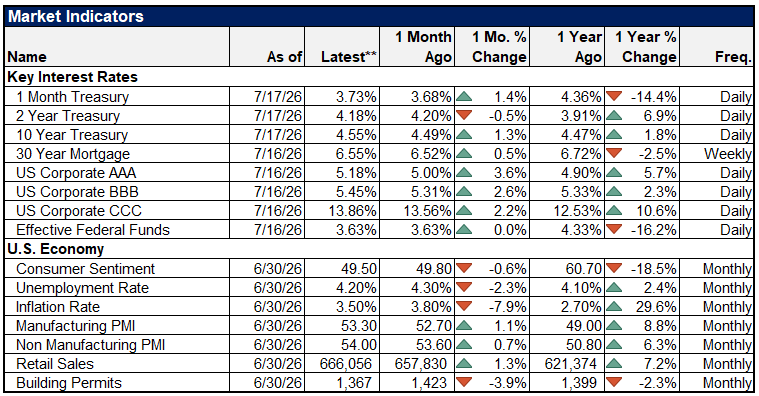
Interest rates were essentially unchanged for the week.
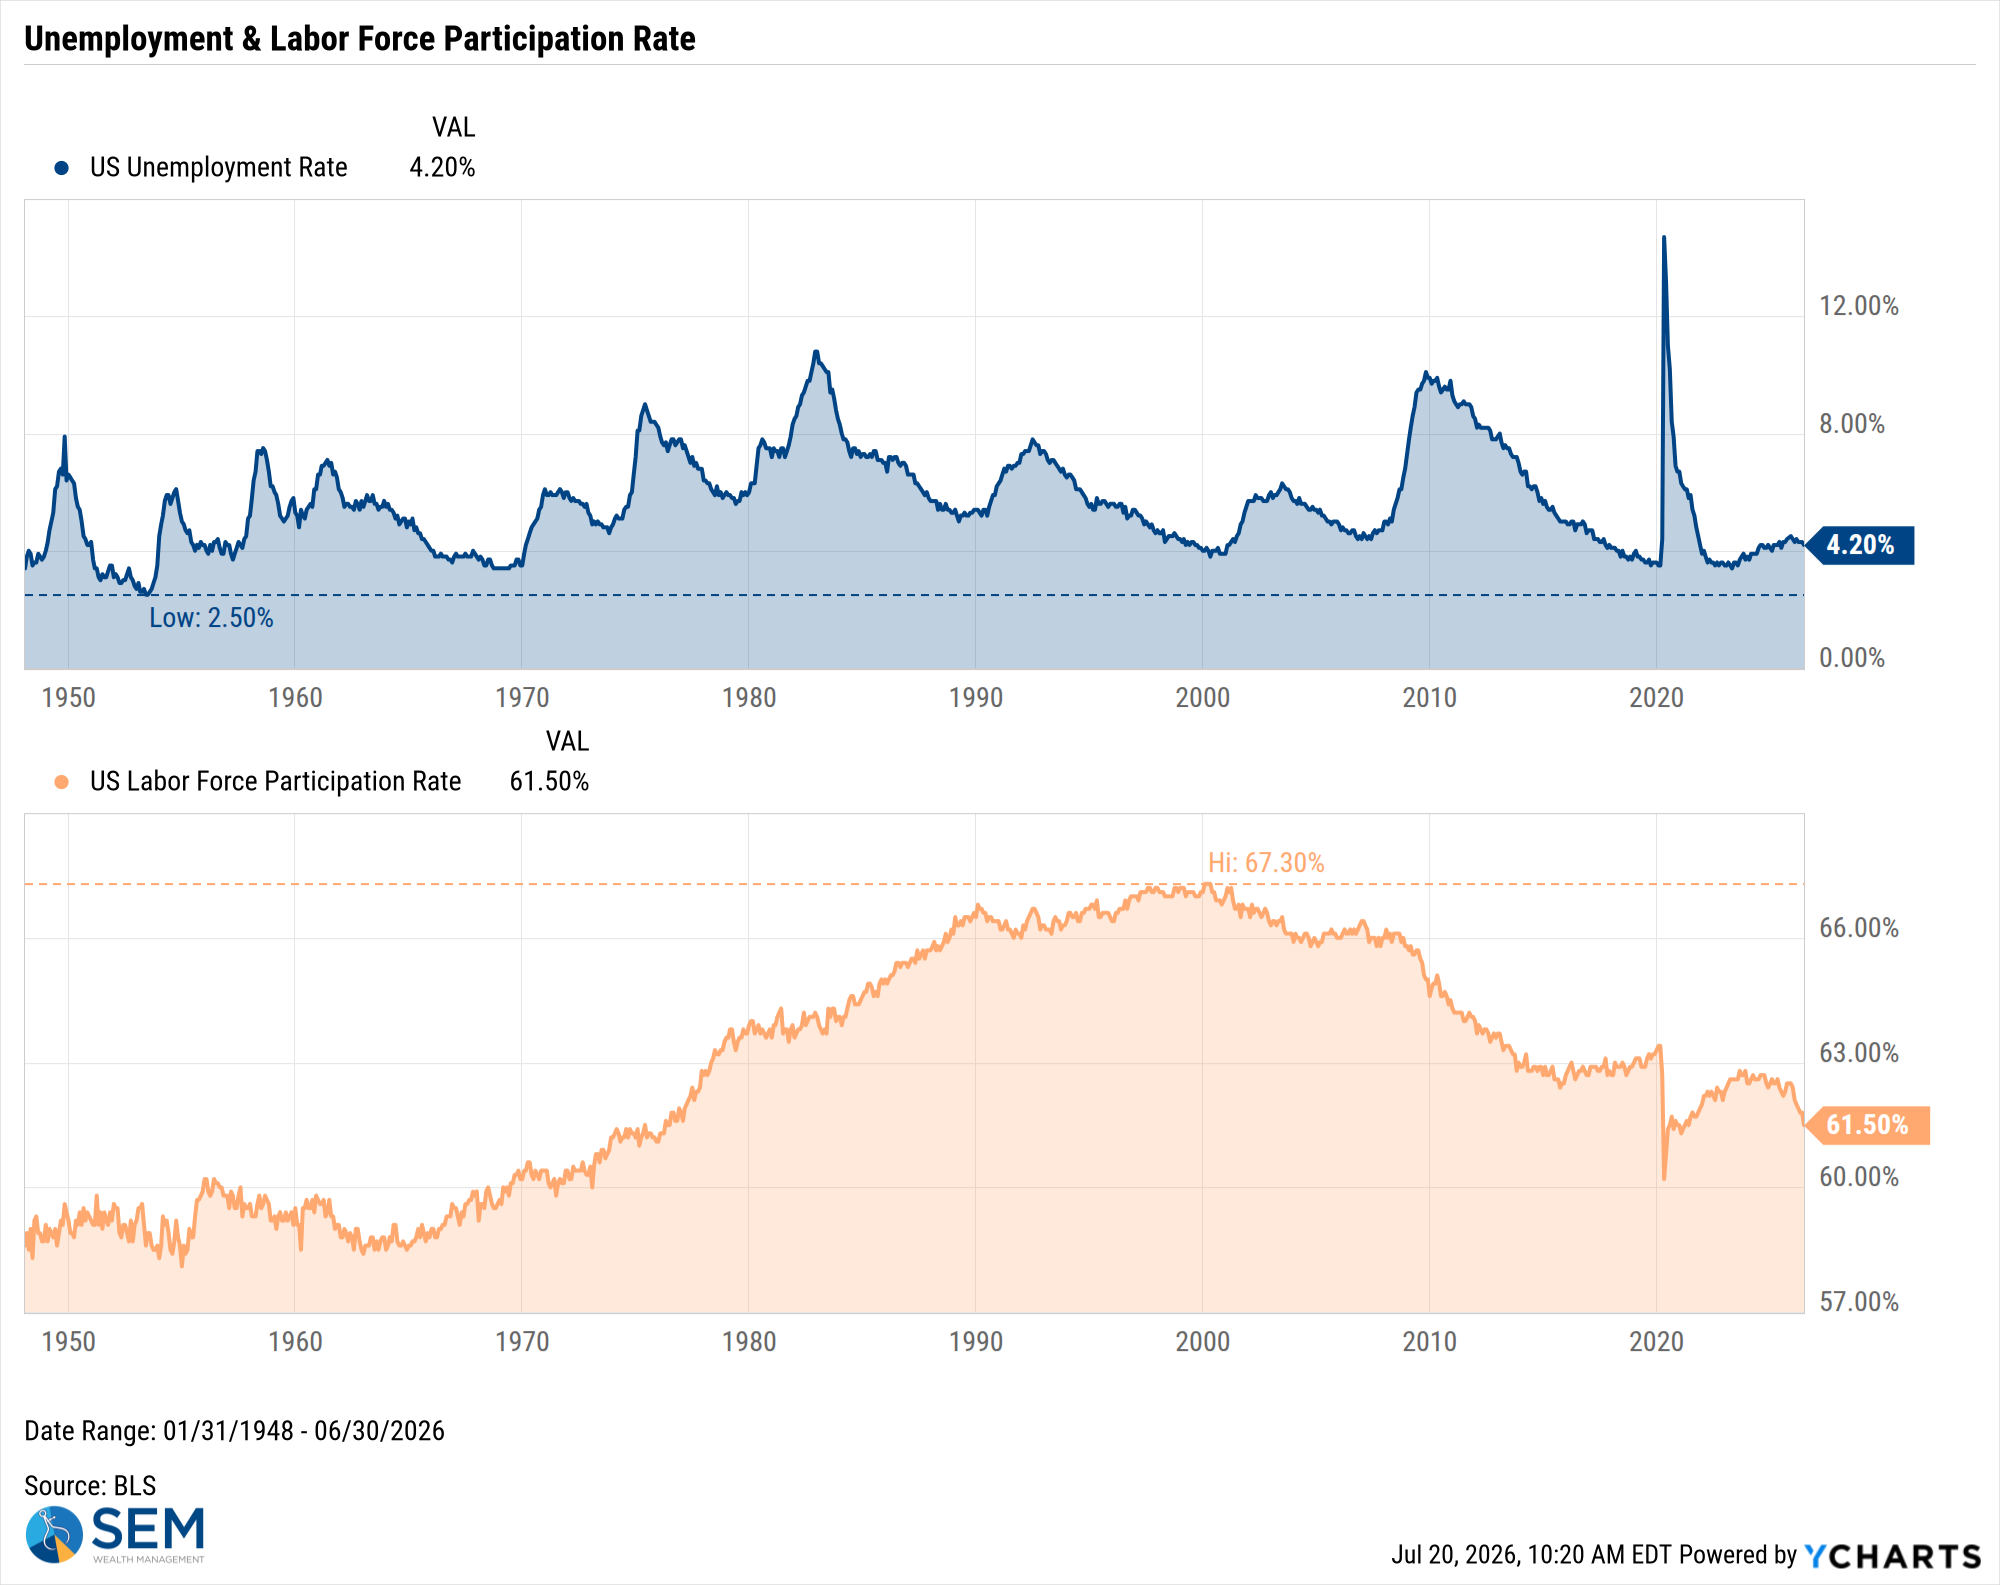
US Unemployment Rate data by YCharts
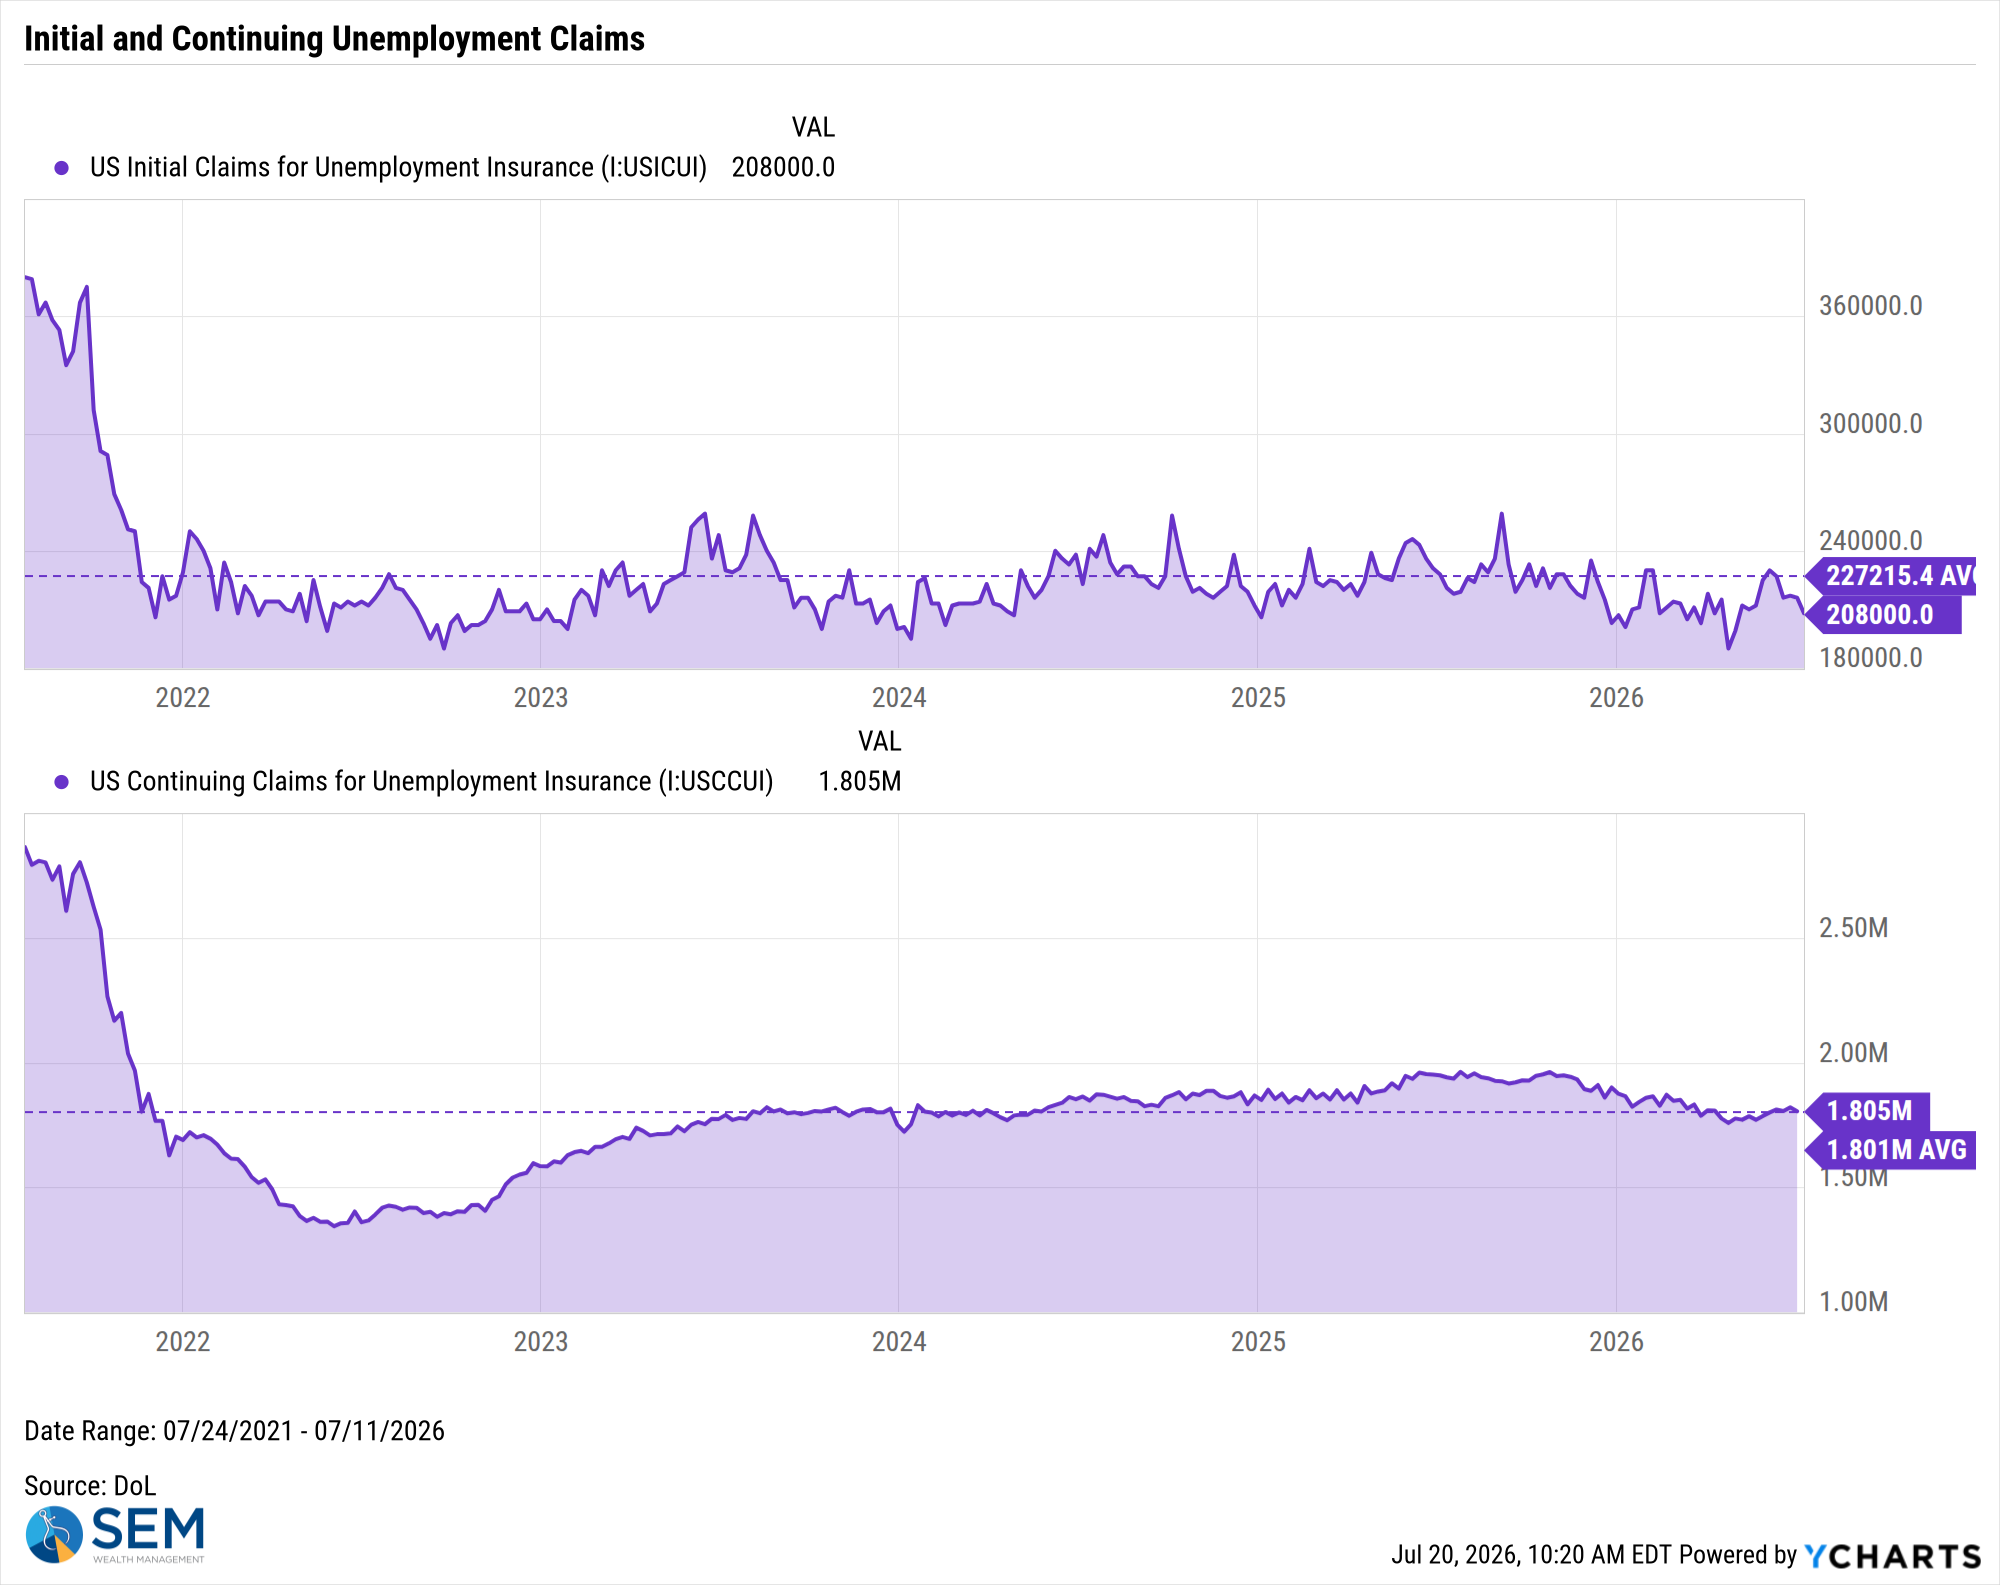
US Initial Claims for Unemployment Insurance data by YCharts
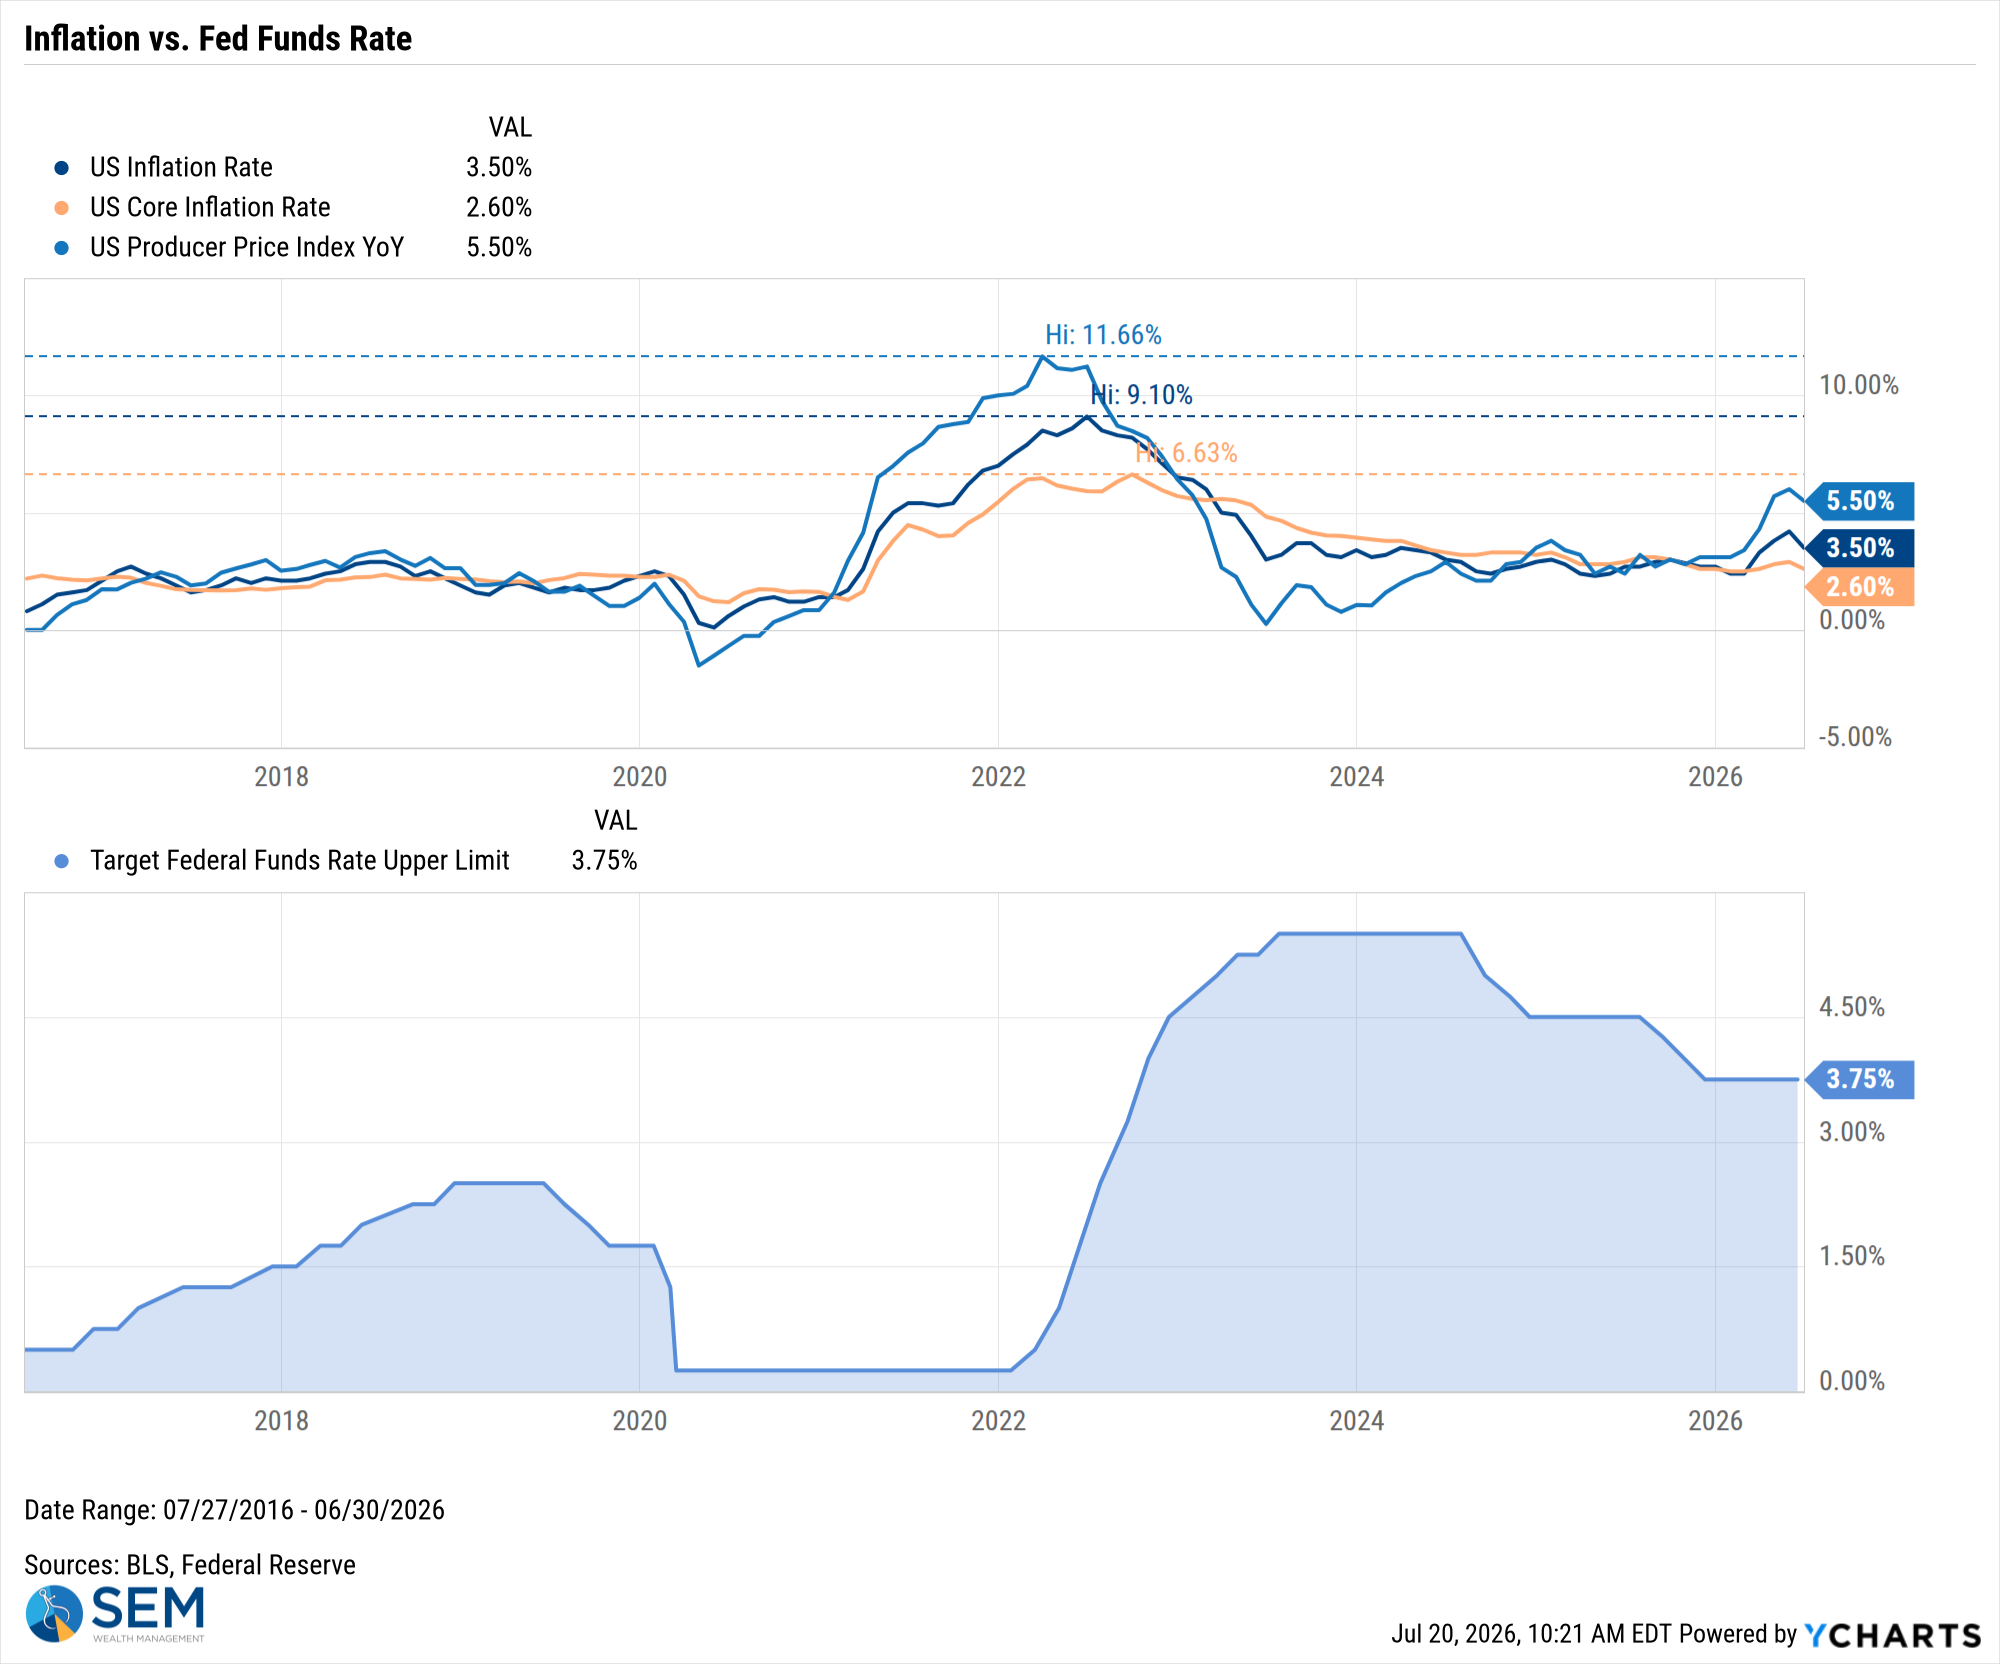
US Inflation Rate data by YCharts
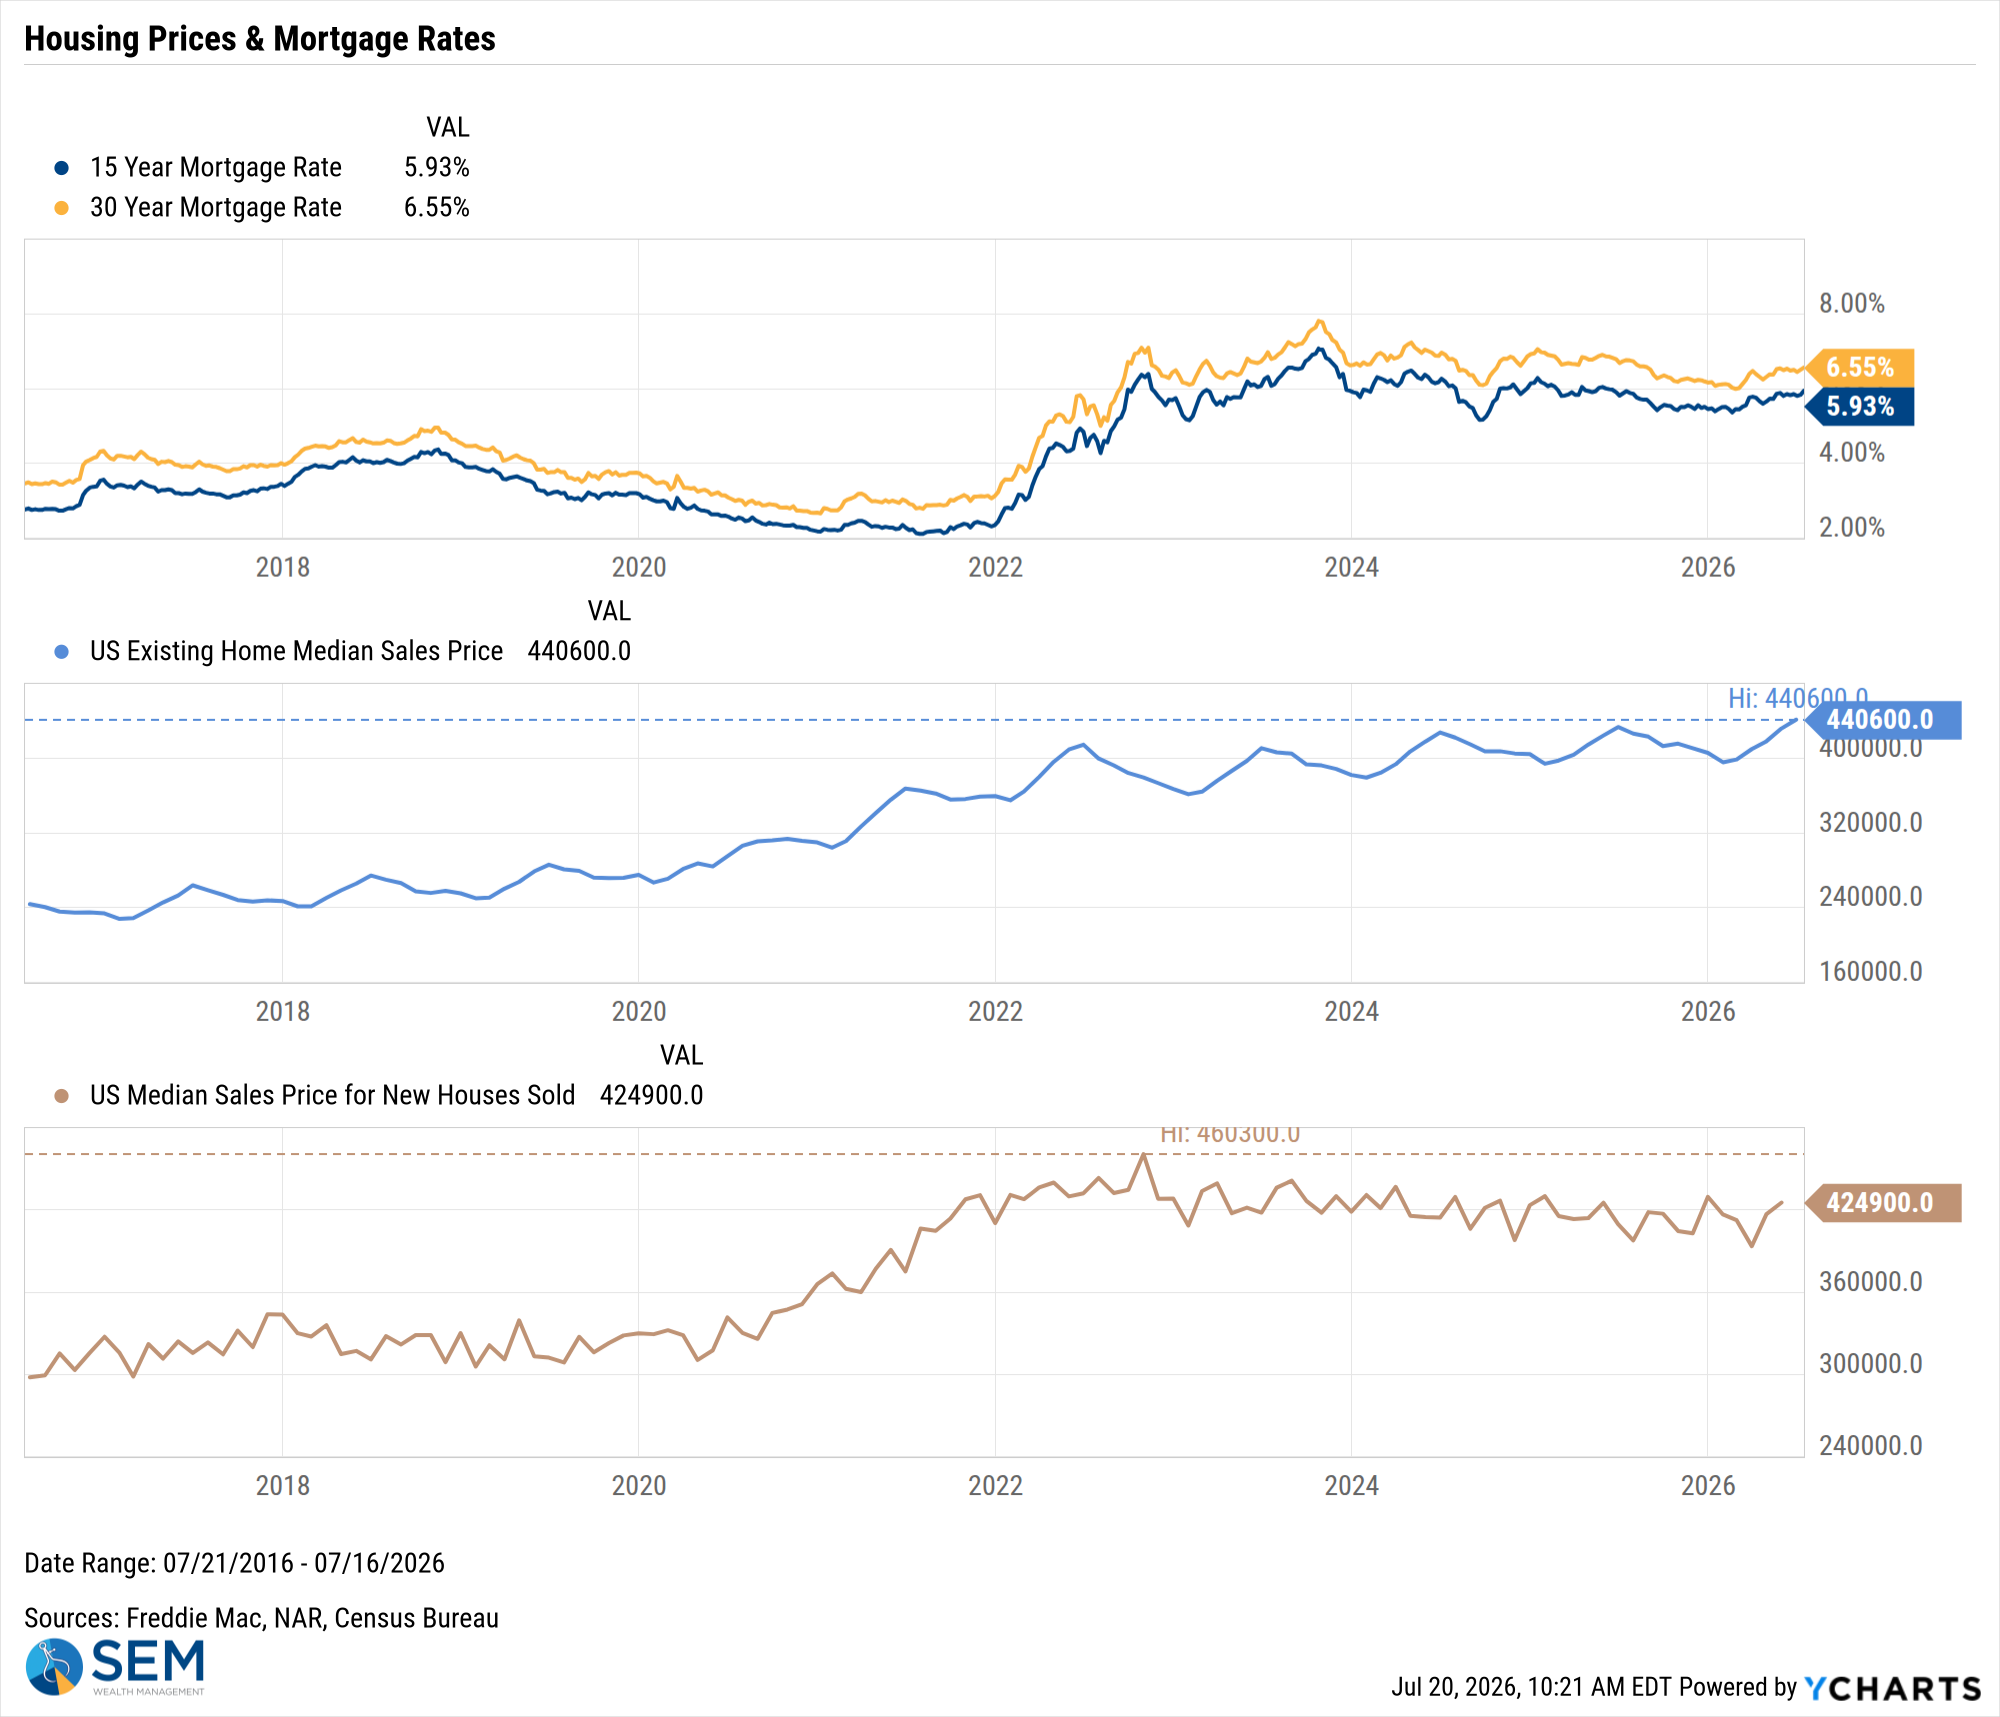
US Existing Home Median Sales Price data by YCharts
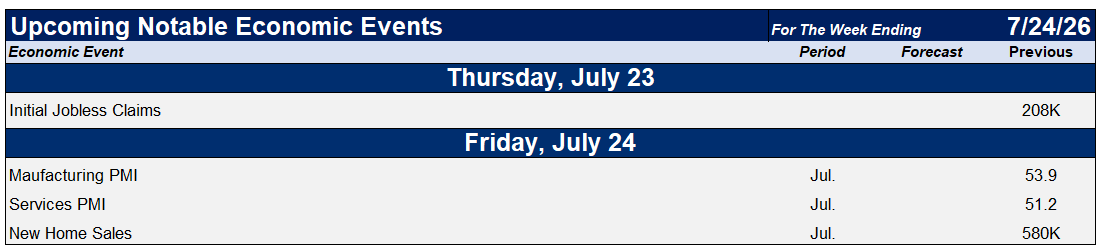
SEM Market Positioning
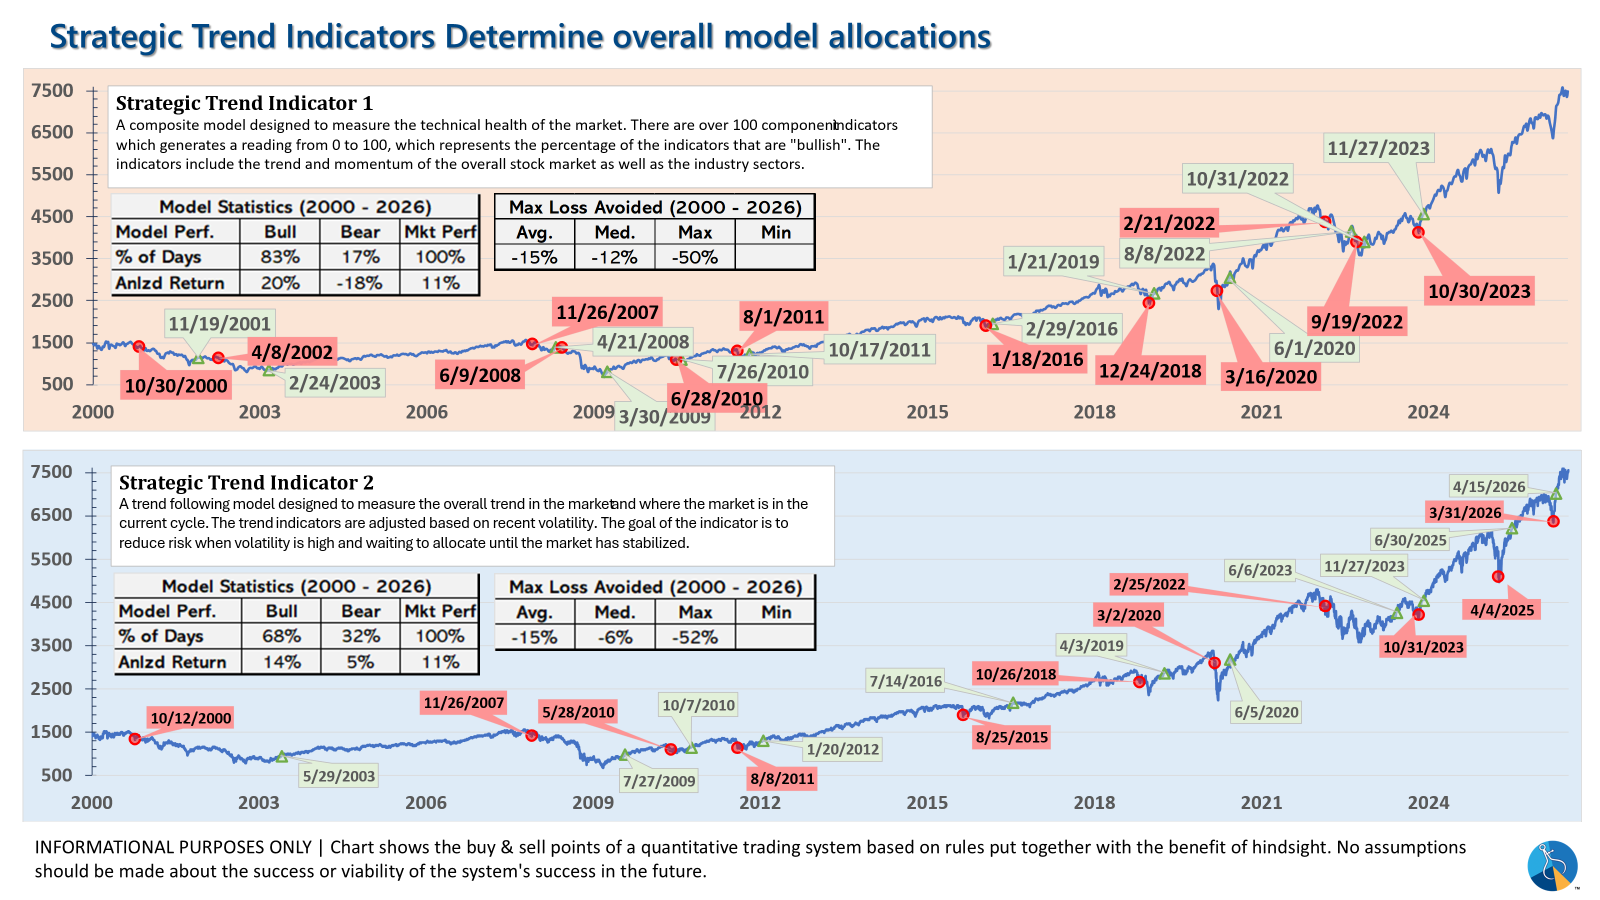
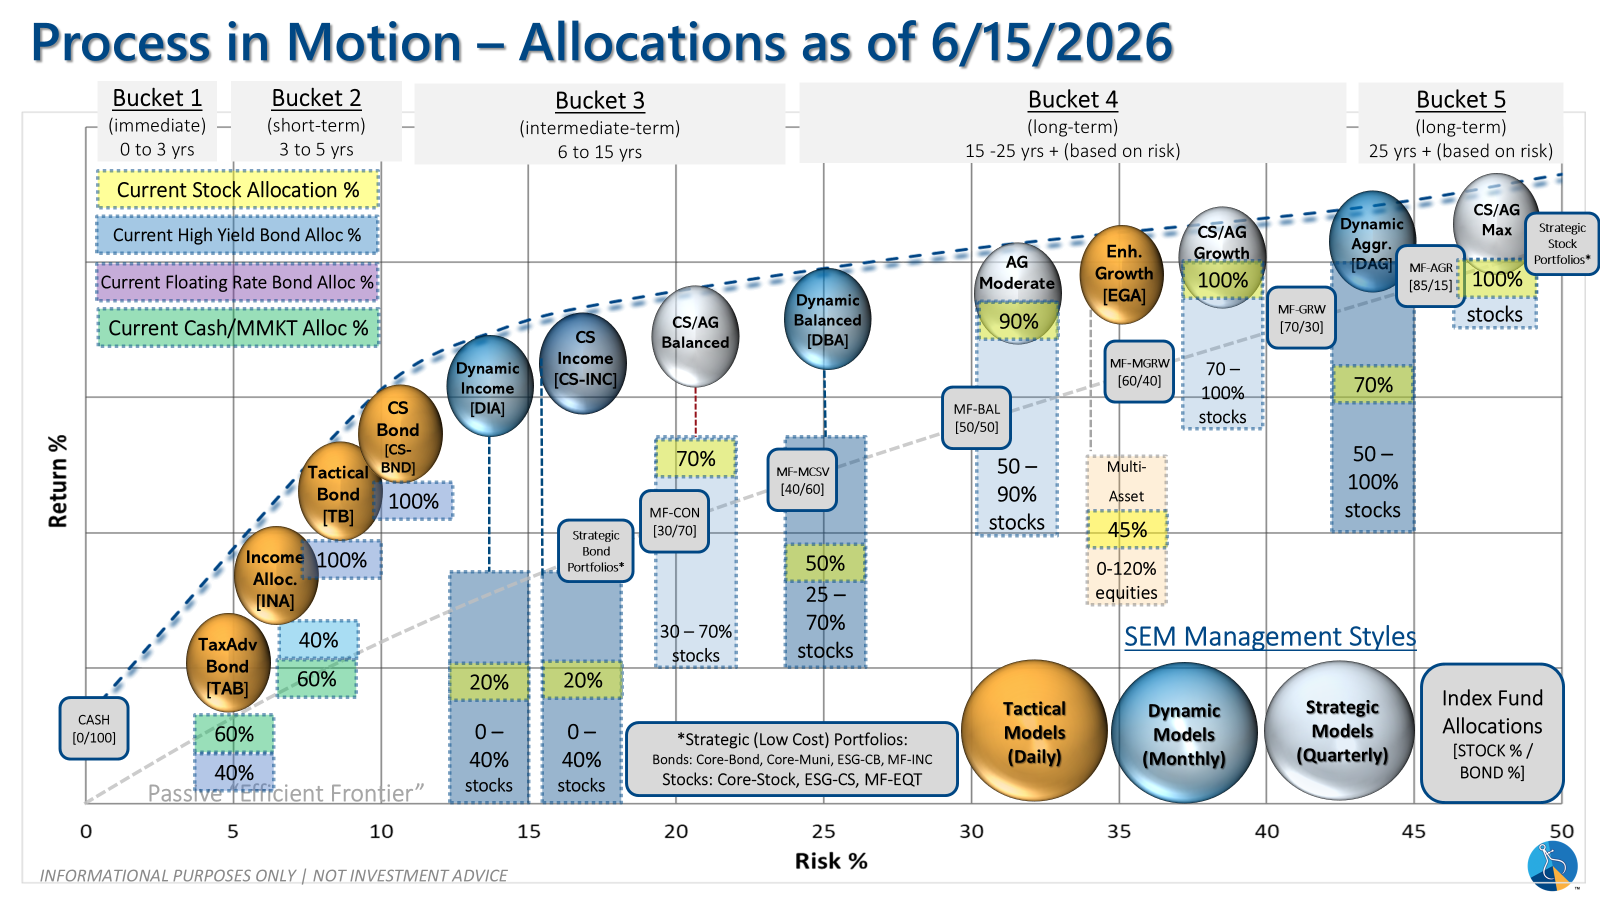
SEM deploys 3 distinct approaches – Tactical, Dynamic, and Strategic. These systems have been described as 'daily, monthly, quarterly' given how often they may make adjustments. Here is where they each stand.
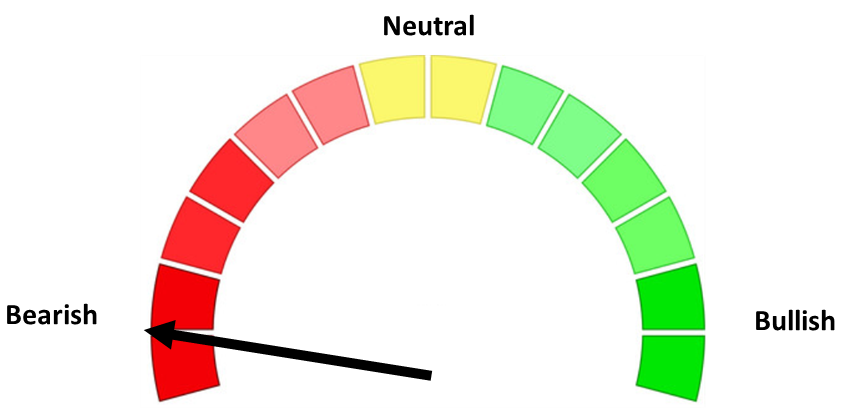
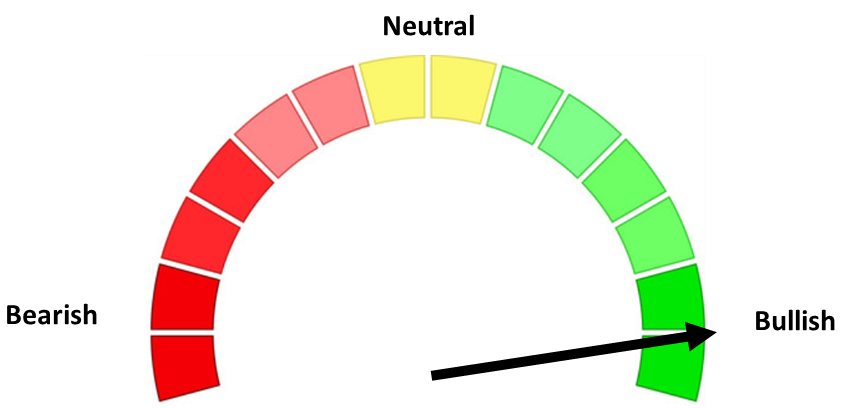
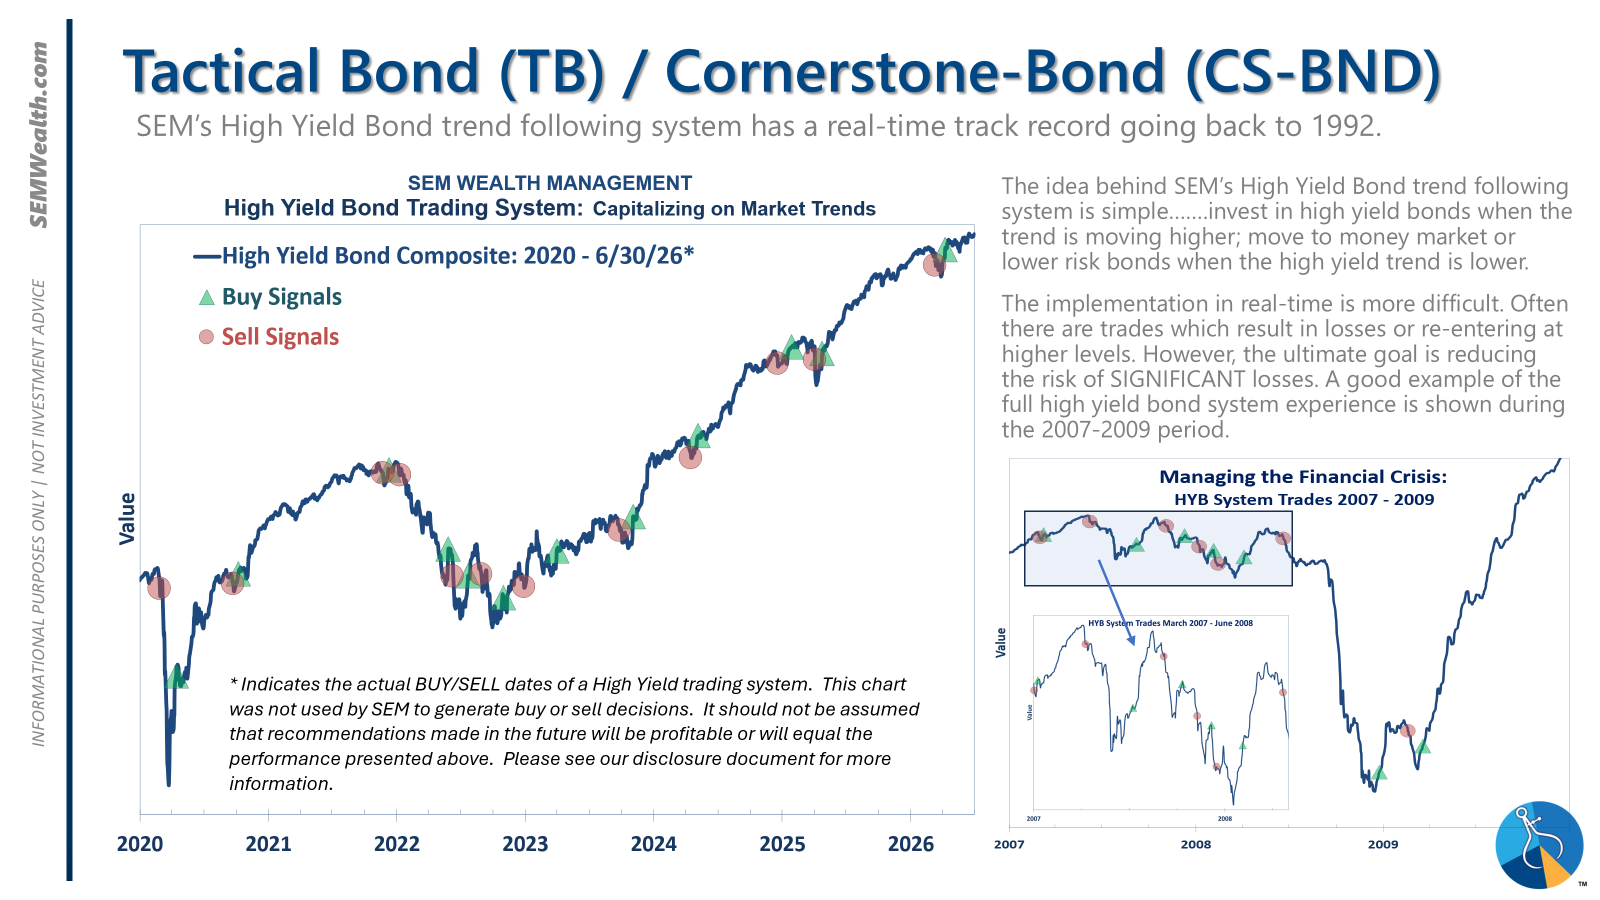
- Tactical = BULLISH | 100% High Yield Bond (4/8/2026) | High-yield spreads remain narrow but trend is slightly higher
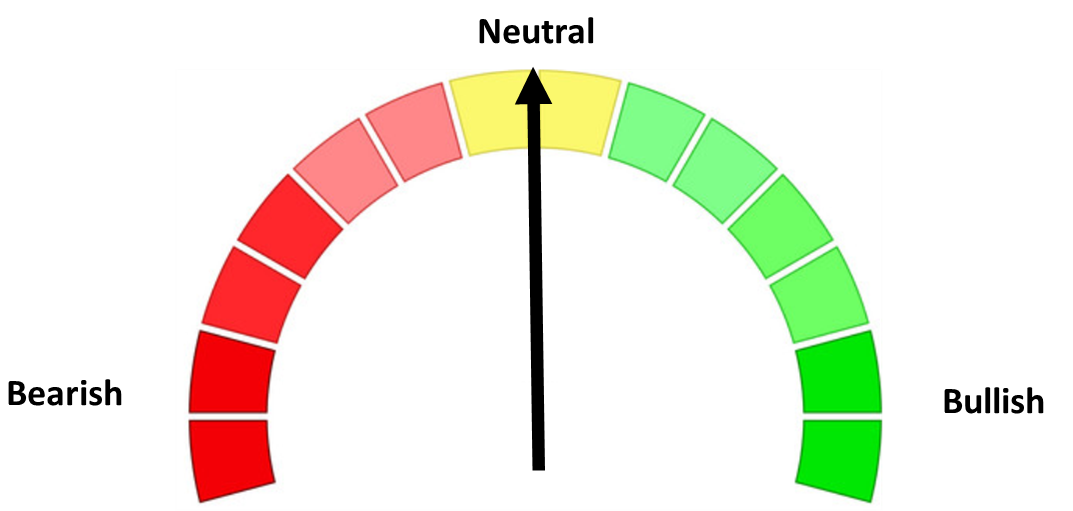
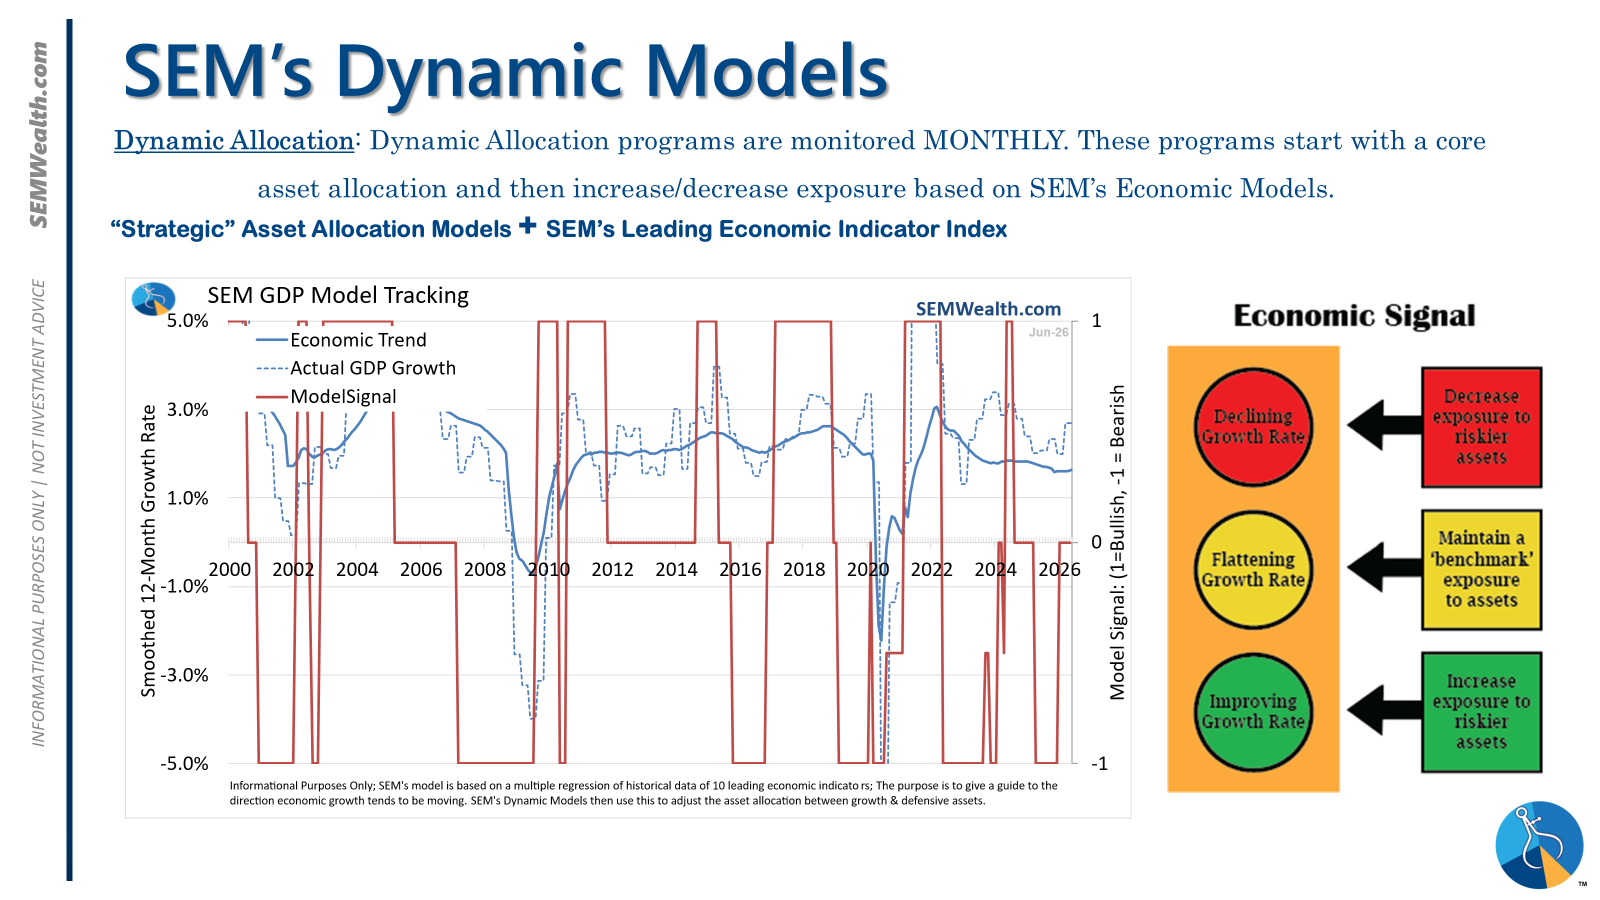
- Dynamic = NEUTRAL (2/15/2026) | "Benchmark" Allocation | Economic model inconclusive
- Strategic = BULLISH (4/15/2026) | V-Bottom projecting "end" of Iran War
Tactical (daily):
- Monitored DAILY
- Models: Tactical Bond, Cornerstone Bond, Income Allocator, Tax Advantaged Bond
- Designed to follow the trends for use in our lower risk models
- BUY Signal issued April 8, 2026 (exiting the sell from March 13)
Dynamic (monthly):
- Monitored MONTHLY
- Models: All "Dynamic" Models (Income, Balanced, Growth, and Asset Allocator)
- Uses SEM's Quantitative Economic Model
- Designed to overweight riskier assets if economic trend is higher & underweight those assets if economic trend is lower.
- NEUTRAL signal issued February 15, 2026 (following BEARISH signal from July 2025)
Strategic (quarterly)*:
- Monitored QUARTERLY
- Models: AmeriGuard (Balanced, Moderate, & Growth) and Cornerstone (Balanced & Growth)
- Core Component: Quantitative Filter using 4 different time horizons across universe of asset classes
- Trend Indicator: Two different Quantitative Systems monitoring the intermediate-term trend, health of the market, and volatility
- CORE has been overweight small cap and international since October 2025 – overweight increased slightly in January
- Both TREND INDICATORS are BULLISH following 10% drop and "V-Bottom" reversal in early April
- AmeriGuard & Cornerstone Max DO NOT use the Trend indicator and are always 100% invested in stocks using our CORE rotation model.
The core rotation is adjusted quarterly. This quarter we saw half of our international positions reduced (we sold developed markets and kept our emerging markets exposure). We also saw the remaining share of mid-cap reduced in favor of more small cap exposure. We remain with a "barbell" core portfolio – about half in large cap and half in small cap as the models expect the market to "broaden".
The * in quarterly is for the trend models. These models are watched daily but they trade infrequently based on readings of where each believe we are in the cycle. The trend systems can be susceptible to "whipsaws" as we saw with the recent sell and buy signals at the end of October and November. The goal of the systems is to miss major downturns in the market. Risks are high when the market has been stampeding higher as it has for most of 2023. This means sometimes selling too soon. As we saw with the recent trade, the systems can quickly reverse if they are wrong.
Overall, this is how our various models stack up based on the last allocation change:
Curious if your current investment allocation aligns with your overall objectives and risk tolerance?