The latest edition to SEM's Investment Management team, George Moore (introduced below), asked me earlier last week if I needed him to find some charts or data for the blog article I was writing. I told him my process varies based on the markets, my week, and sometimes my mood. Some weeks it is clear early on what my topic needs to be. Other weeks we have a series of "musings" because there are so many things to talk about. Then there are the weeks where even on Friday I still have no clue what I'll write about.
This was one of of those weeks. During those weeks, I take my time Saturday morning going through my usual list of articles and publications I've accumulated during the week and those which post on Friday evening or Saturday morning. The WSJ Weekend Edition, Barrons, Bloomberg Weekend, The Felder Report, John Maudlin's Thoughts From the Frontline, and CMG's On My Radar. I did find it interesting that the latter two shared my writer's block this week in terms of what to write about.
The issue is simple – my overlying theme (and the keynote we've been giving for anybody looking for a speaker at their event) has been "AI: Boom, Bubble, or Both". The problem when you are living through such a major technological and economic change is each week can feel like an eternity when the reality is history may ignore the very events we are laser focused on today. Determining what is important and what is simply noise (or an investment trap) is not easy. I've never really used the phrase, "can't see the forest through the trees," but I do believe this is one of those times where it fits.
So what is on my mind? Most weeks I have several calls with various advisor teams. These calls are designed to summarize the main points we're seeing in the markets so they can relay it to their clients during their meetings. Here are my notes from last week's calls:
1.) Market's are realizing the AI buildout is more expensive than they thought and converting that spending to revenue is not a guarantee.
JP Morgan is now forecasting nearly a Trillion dollars of spending just from the 4 hyperscalers (Alphabet (Google), Amazon, Meta (Facebook), Microsoft, and Oracle. For now, JPM believes the 4 companies combined will see their free cash flow declines suddenly reverse starting next year.
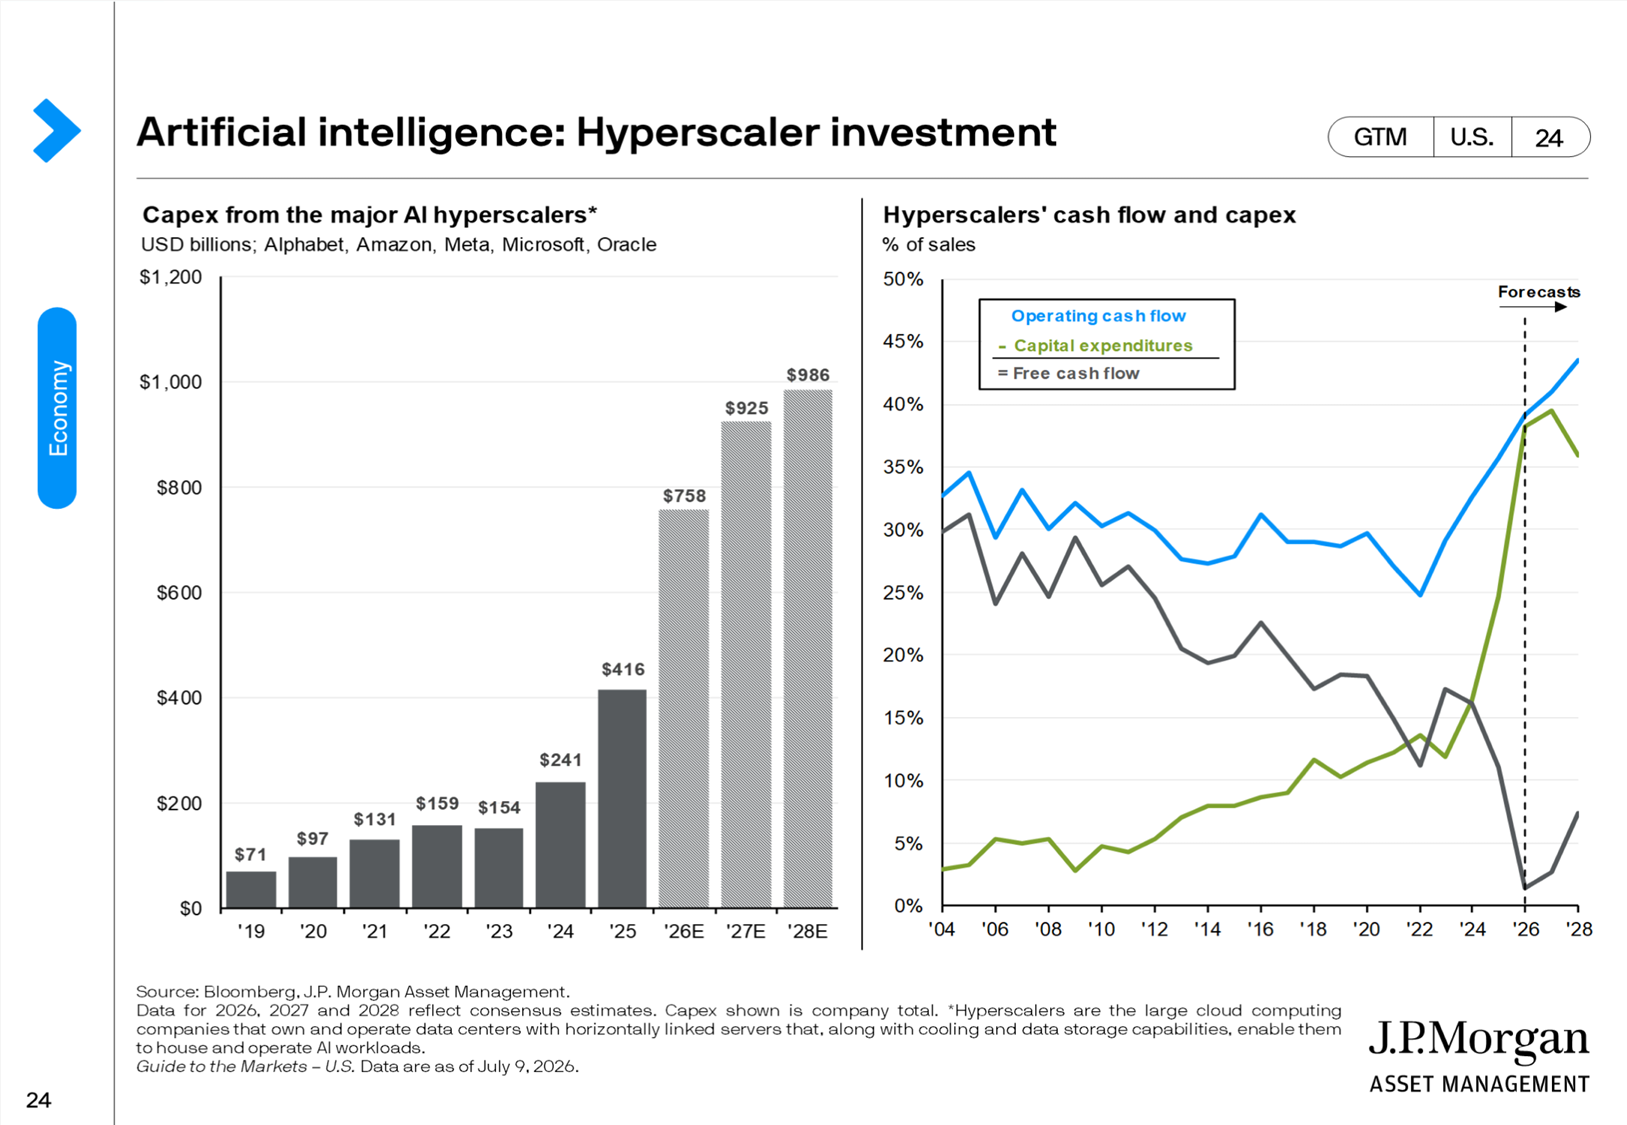
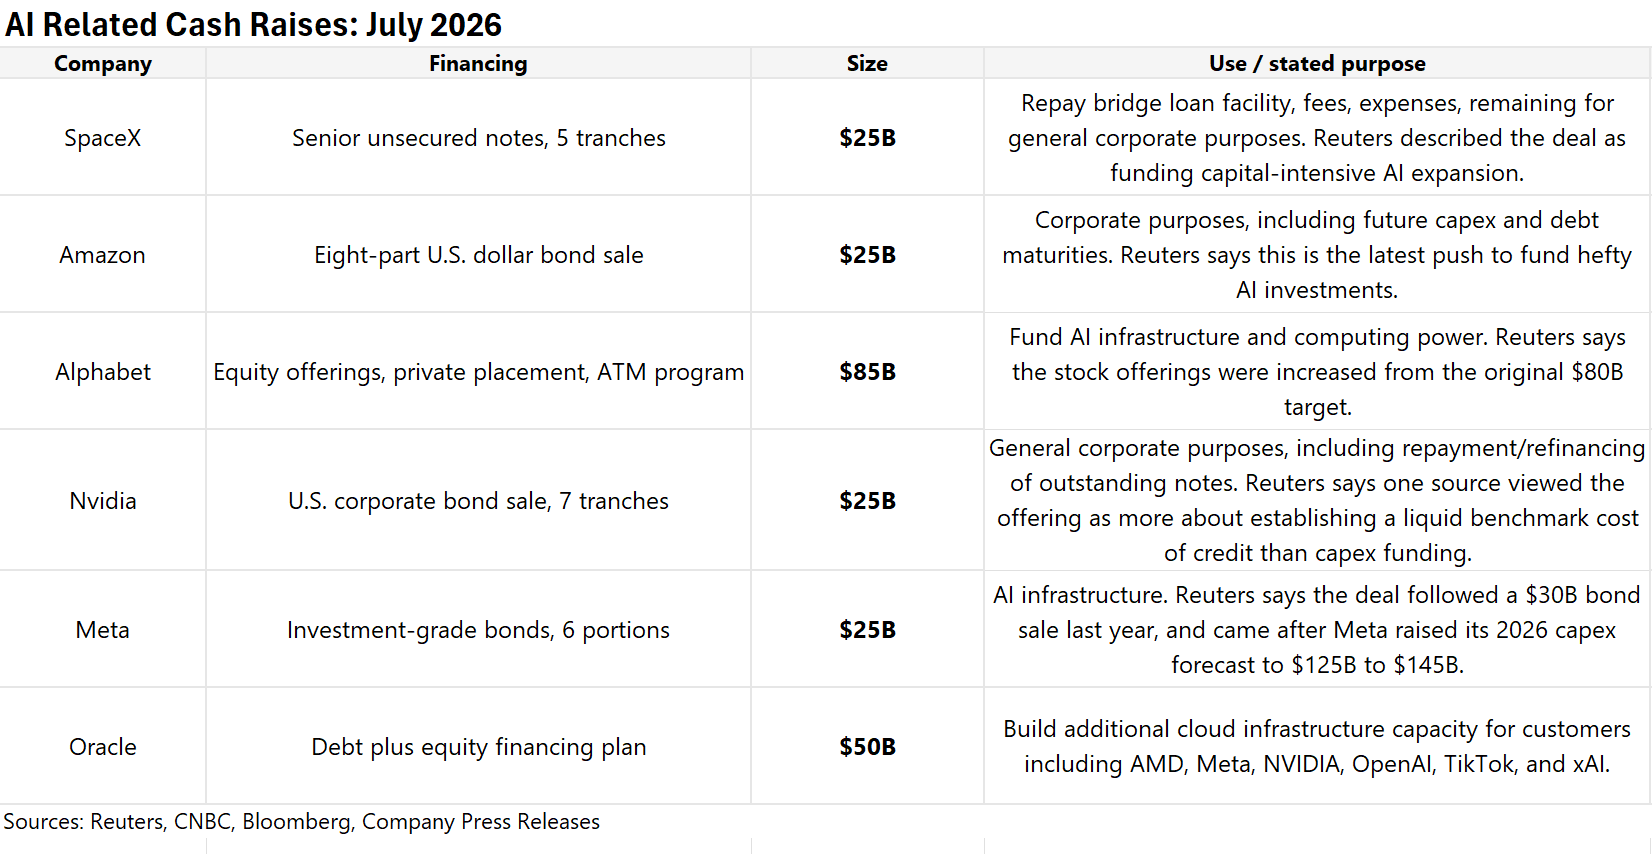
The markets, at least on Tuesday and Wednesday were not so sure following Amazon's announcement of another $25B bond issue, which follows their just completed $50B bond issue. Not counting SpaceX's ~$75B it raised in the IPO, that's $235B of new cash being raised from the markets just this month.
It may seem like a relatively small amount given the size of the companies borrowing the money, but these charts from the WSJ show how big of a change this really is.
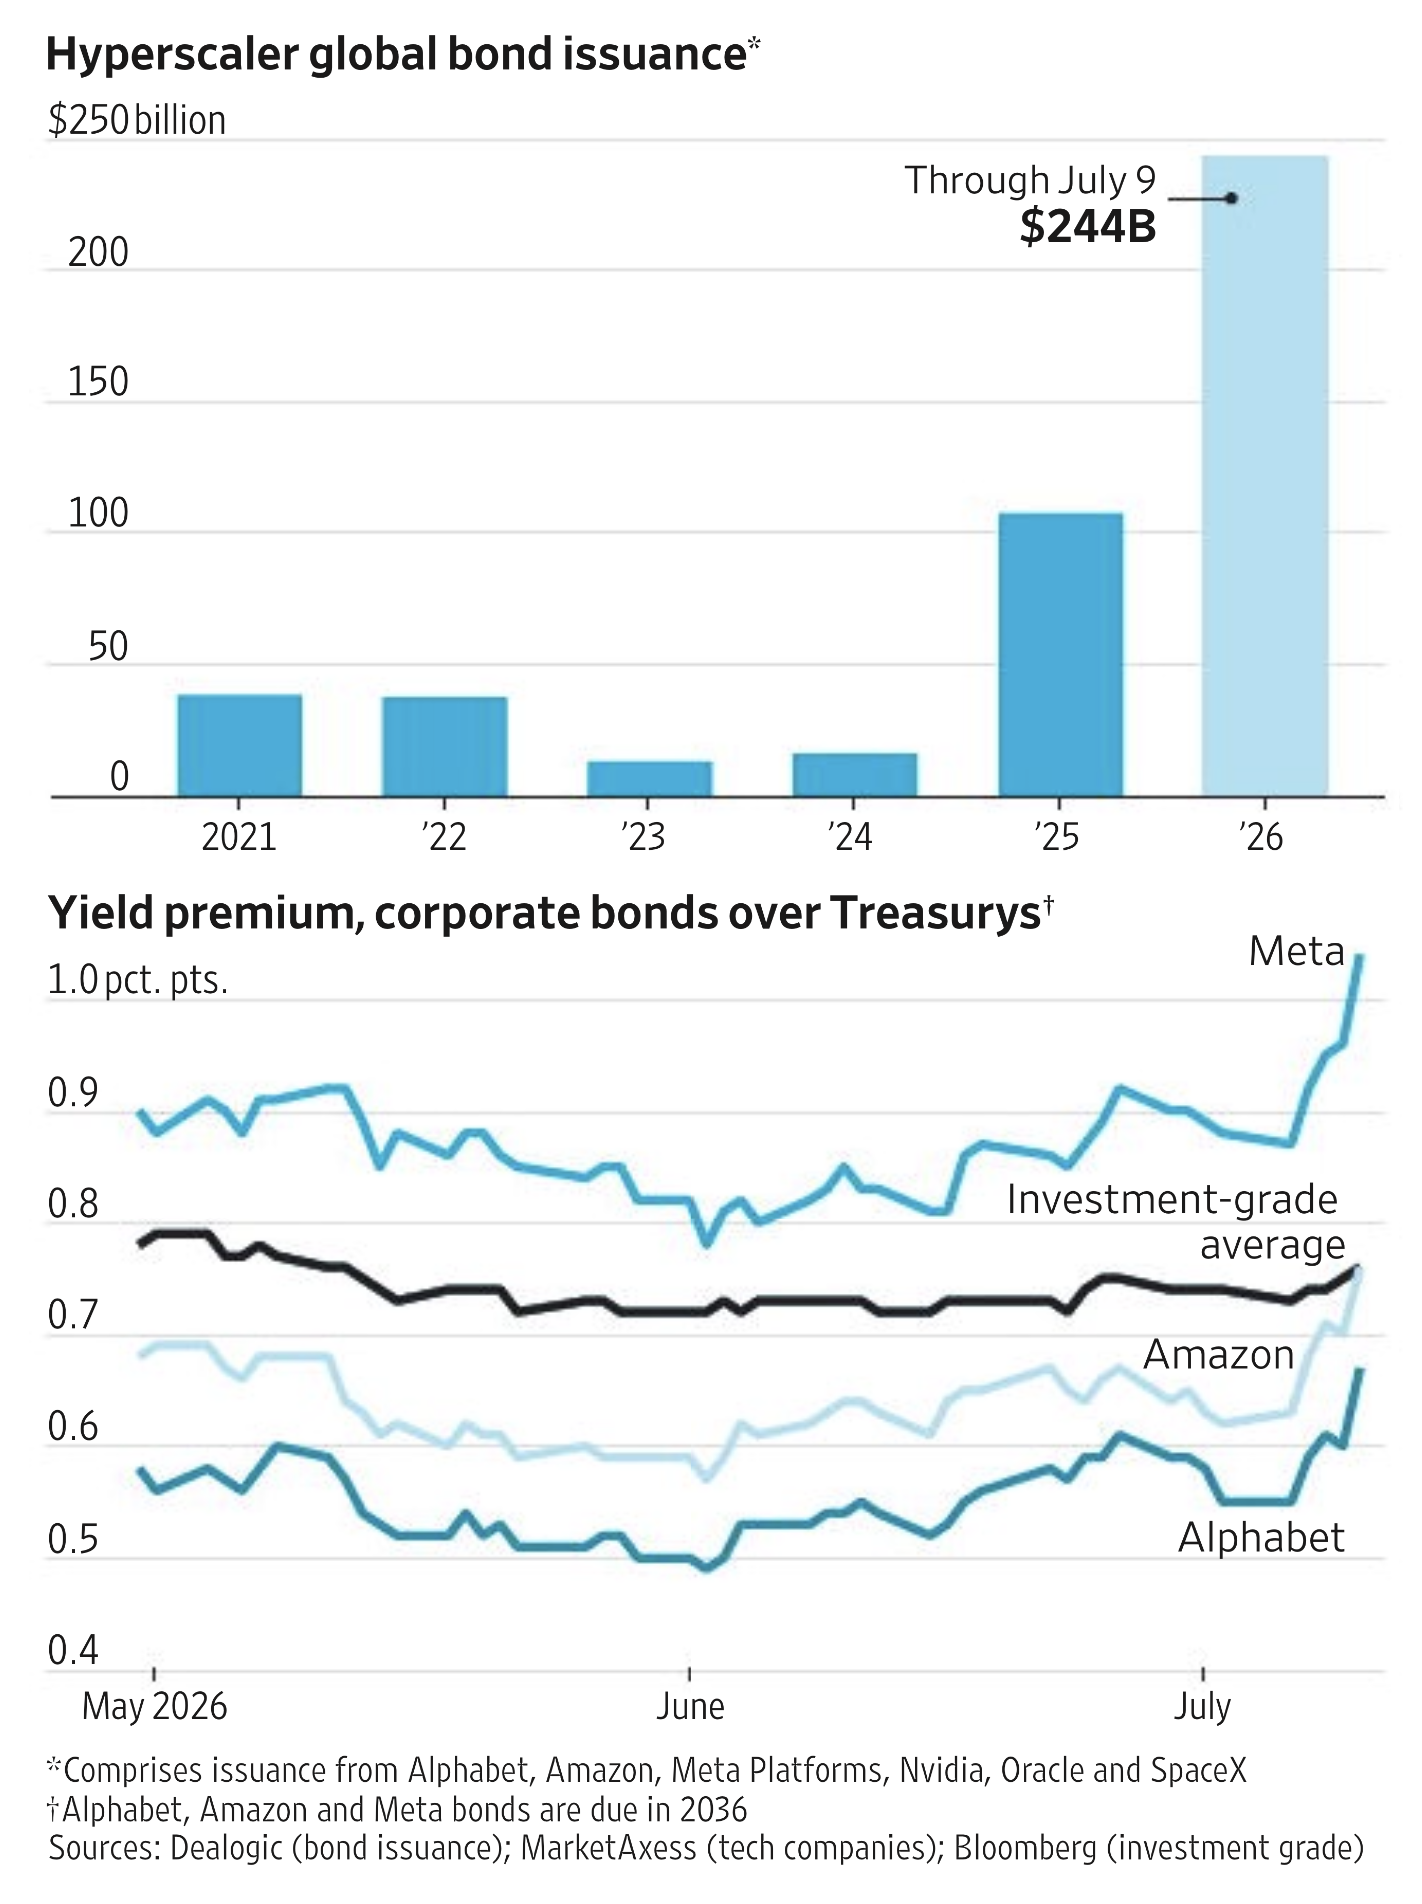
Again, while small, the spread on the hyperscaler bonds jumped more than the average investment-grade issue. If the companies continue to borrow at the rate everyone expects, this will add volatility to investment-grade bond portfolios and could lead to a reduction in demand for the bonds.
2.) The new Fed Chair is serious about inflation
I've been managing money since 1995, which means I've had Allen Greenspan, Ben Benranke, Janet Yellen, and Jerome Powell as heads of the Federal Reserve during my career. I wasn't around when Paul Volker slayed the inflation bear in the 1980s so I don't have a comparison between him and Kevin Warsh. I will say this – Mr. Warsh is by far the most "hawkish" Fed Chair I've seen in my career (based on the messaging and actions from his first meeting). All the other Fed Chair's were more focused on the ridiculous mandate Congress added in the late 1970s.
I've criticized that mandate my entire career because monetary policy (that set by the Fed) is not the best tool for this. Fiscal policy (set by Congress) and Regulatory policy (usually set by the Executive Branch) are better served to increase employment. Often times the "maintain price stability" mandate and the "maximize employment" are fighting against each other. In the past the Fed Chair's chose to keep the foot on the growth gas too long, creating inflation which led to pushing the brakes too hard and for too long, creating a recession.
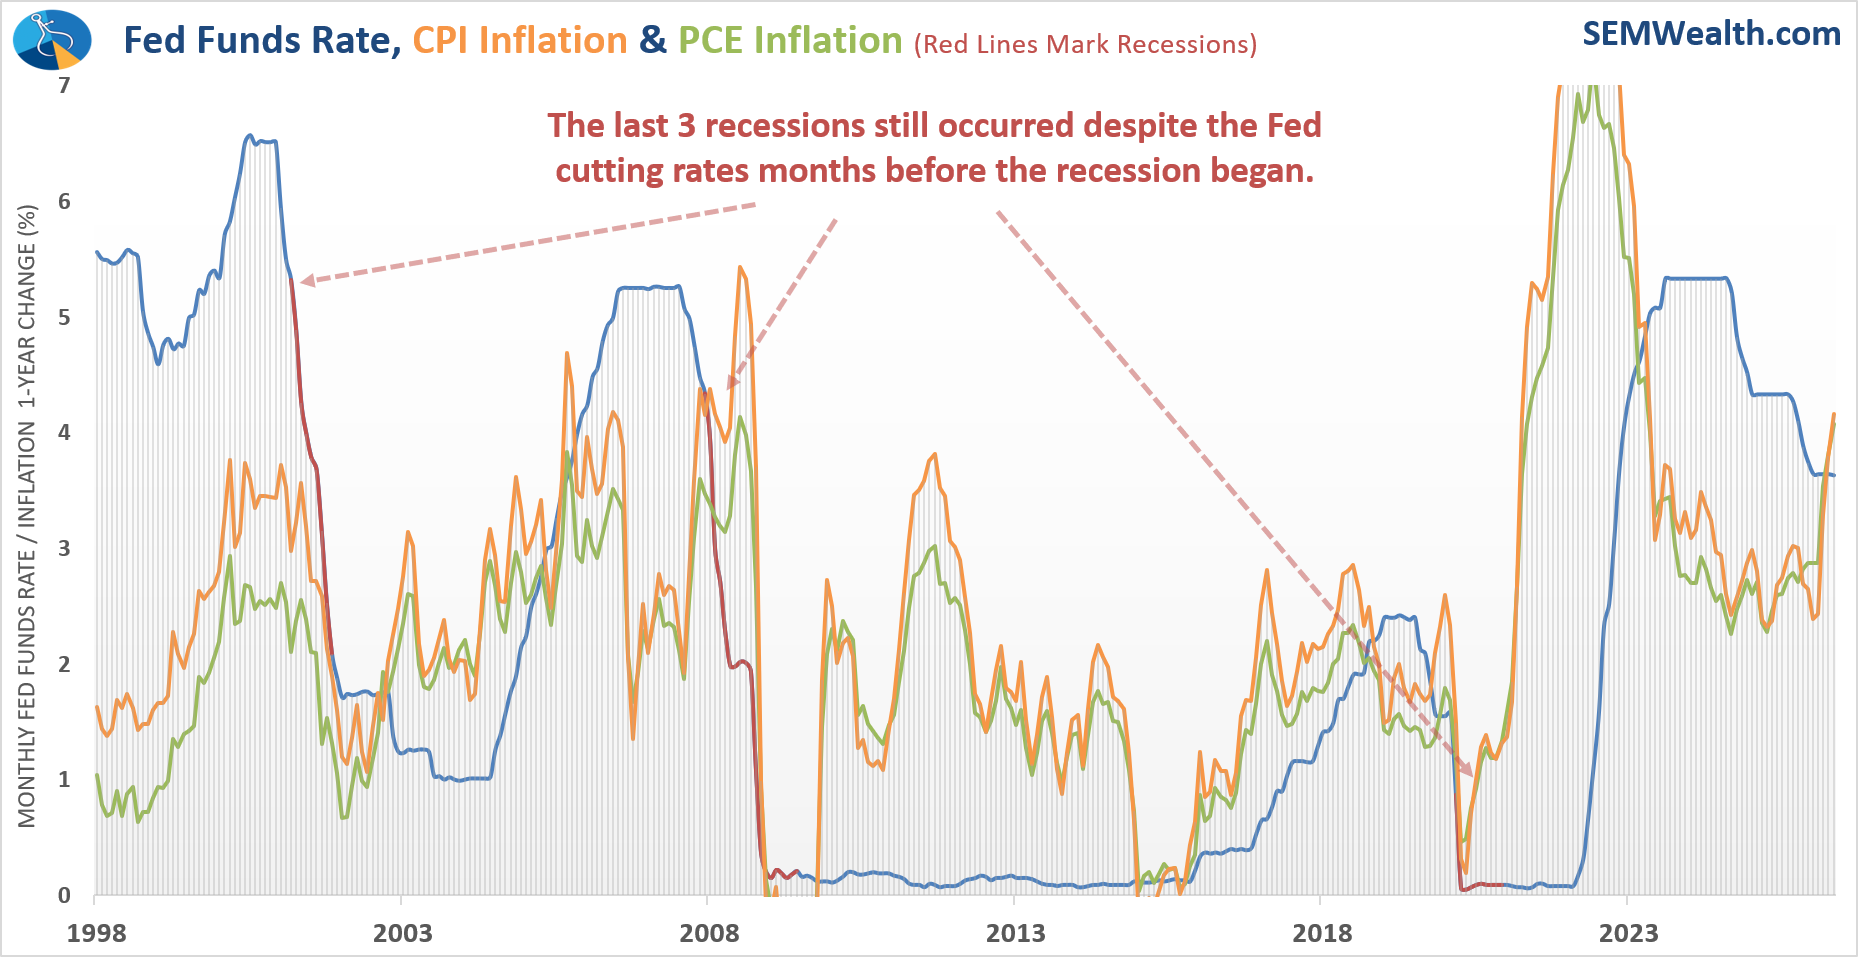
I don't think the market is ready for this new focus. It can especially have an impact on the AI spending spree mentioned in #1 above.
3.) Inflation is more than oil and risks becoming structural
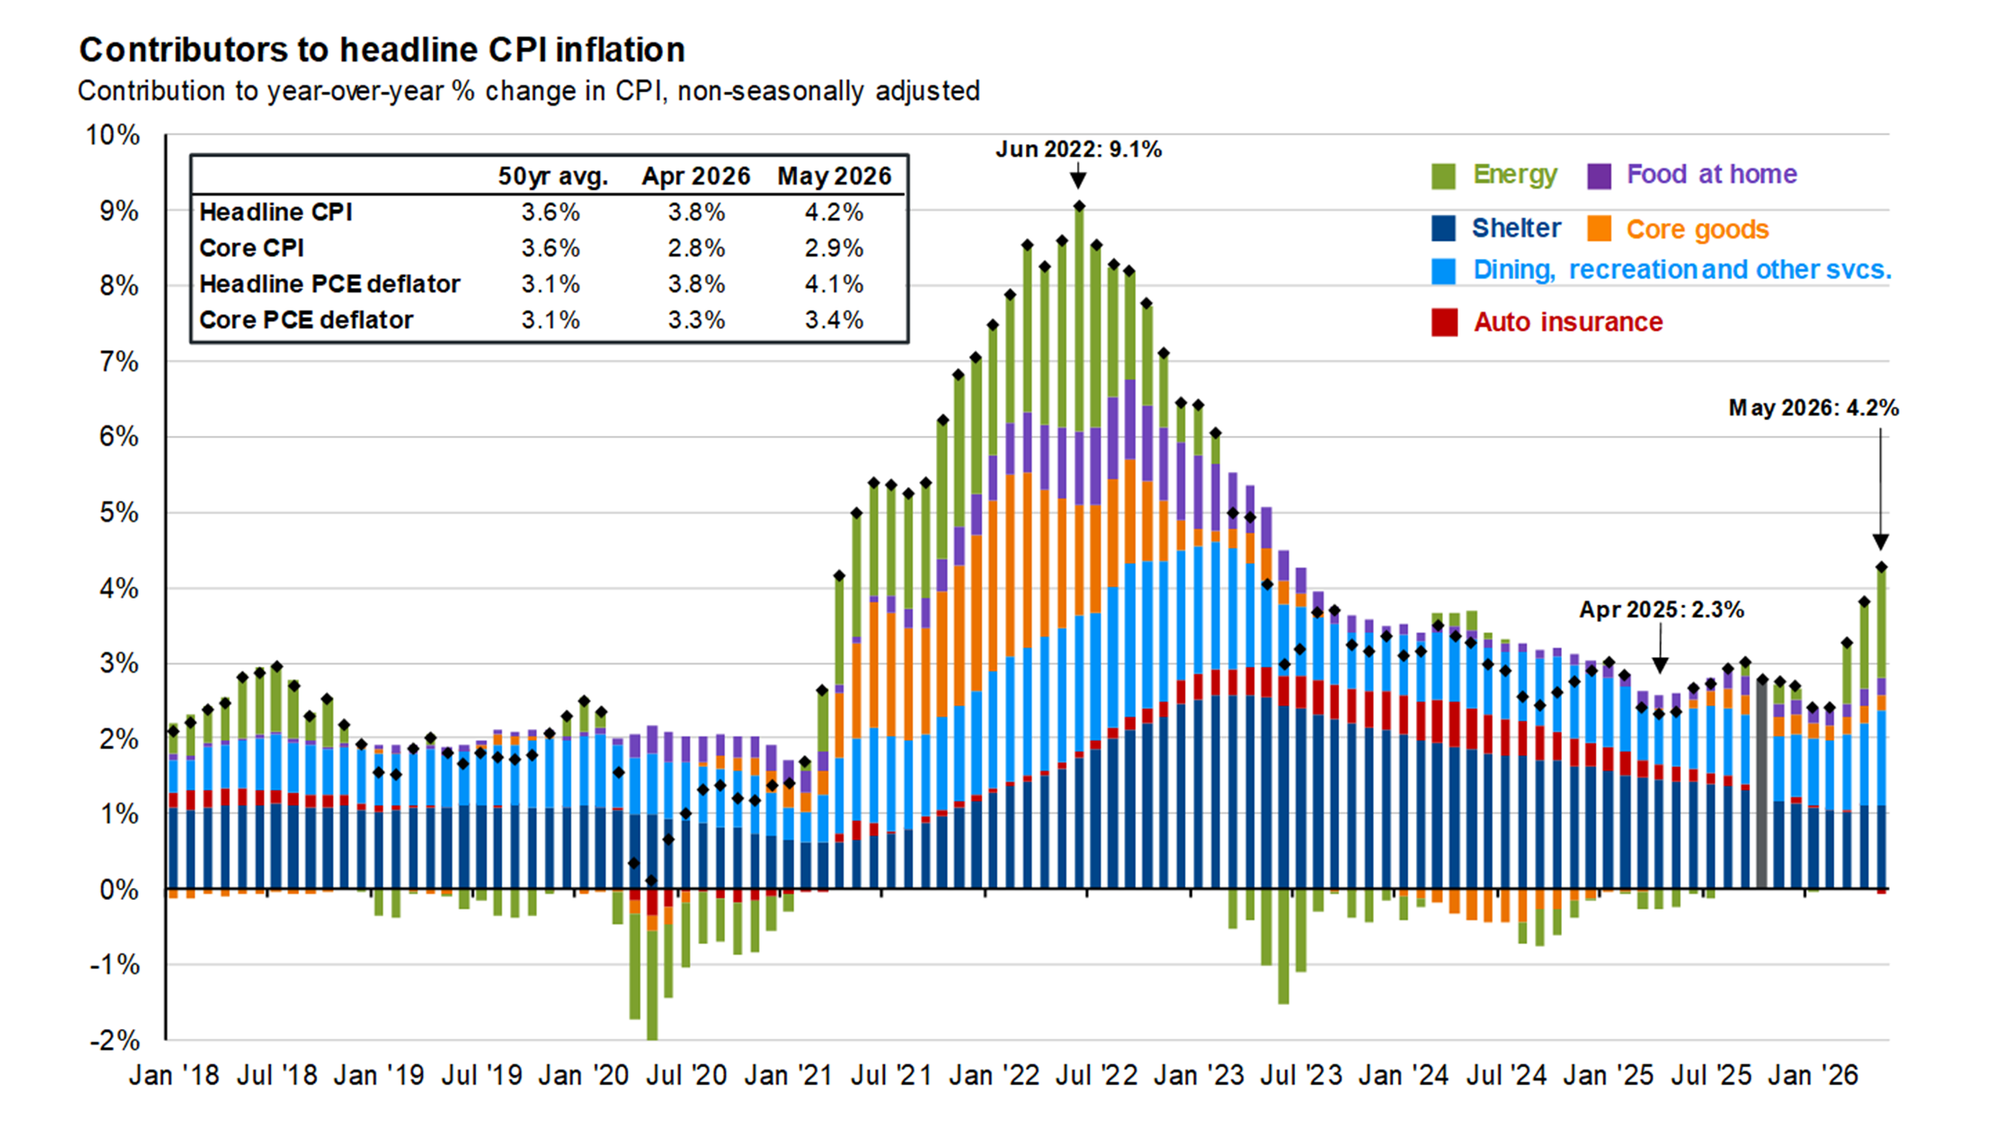
We saw it a few weeks back with Apple and Microsoft announcing price increases on their consumer products due to the high cost of the components they use. The AI buildout is creating shortages in materials, energy, and even labor, which is inflationary. While energy prices may come down in the coming months, the risk is other components will increase, which is much tougher to fight. This makes Kevin Warsh's job that much more difficult and again could play a role in #1.
4.) All that said, earnings growth is strong and the economy is holding up
Our blog last week included our latest economic update. Short-term the labor market is improving a bit, but we did identify a long-term problem we will have to deal with in the years ahead.
 Jeff Hybiak, CFA
Earnings growth has been spectacular so far this year. This comes on the heels of impressive growth the last 2 years. Impressively, the growth has been a near equal combination of growth in revenue and an increase in profit margins.
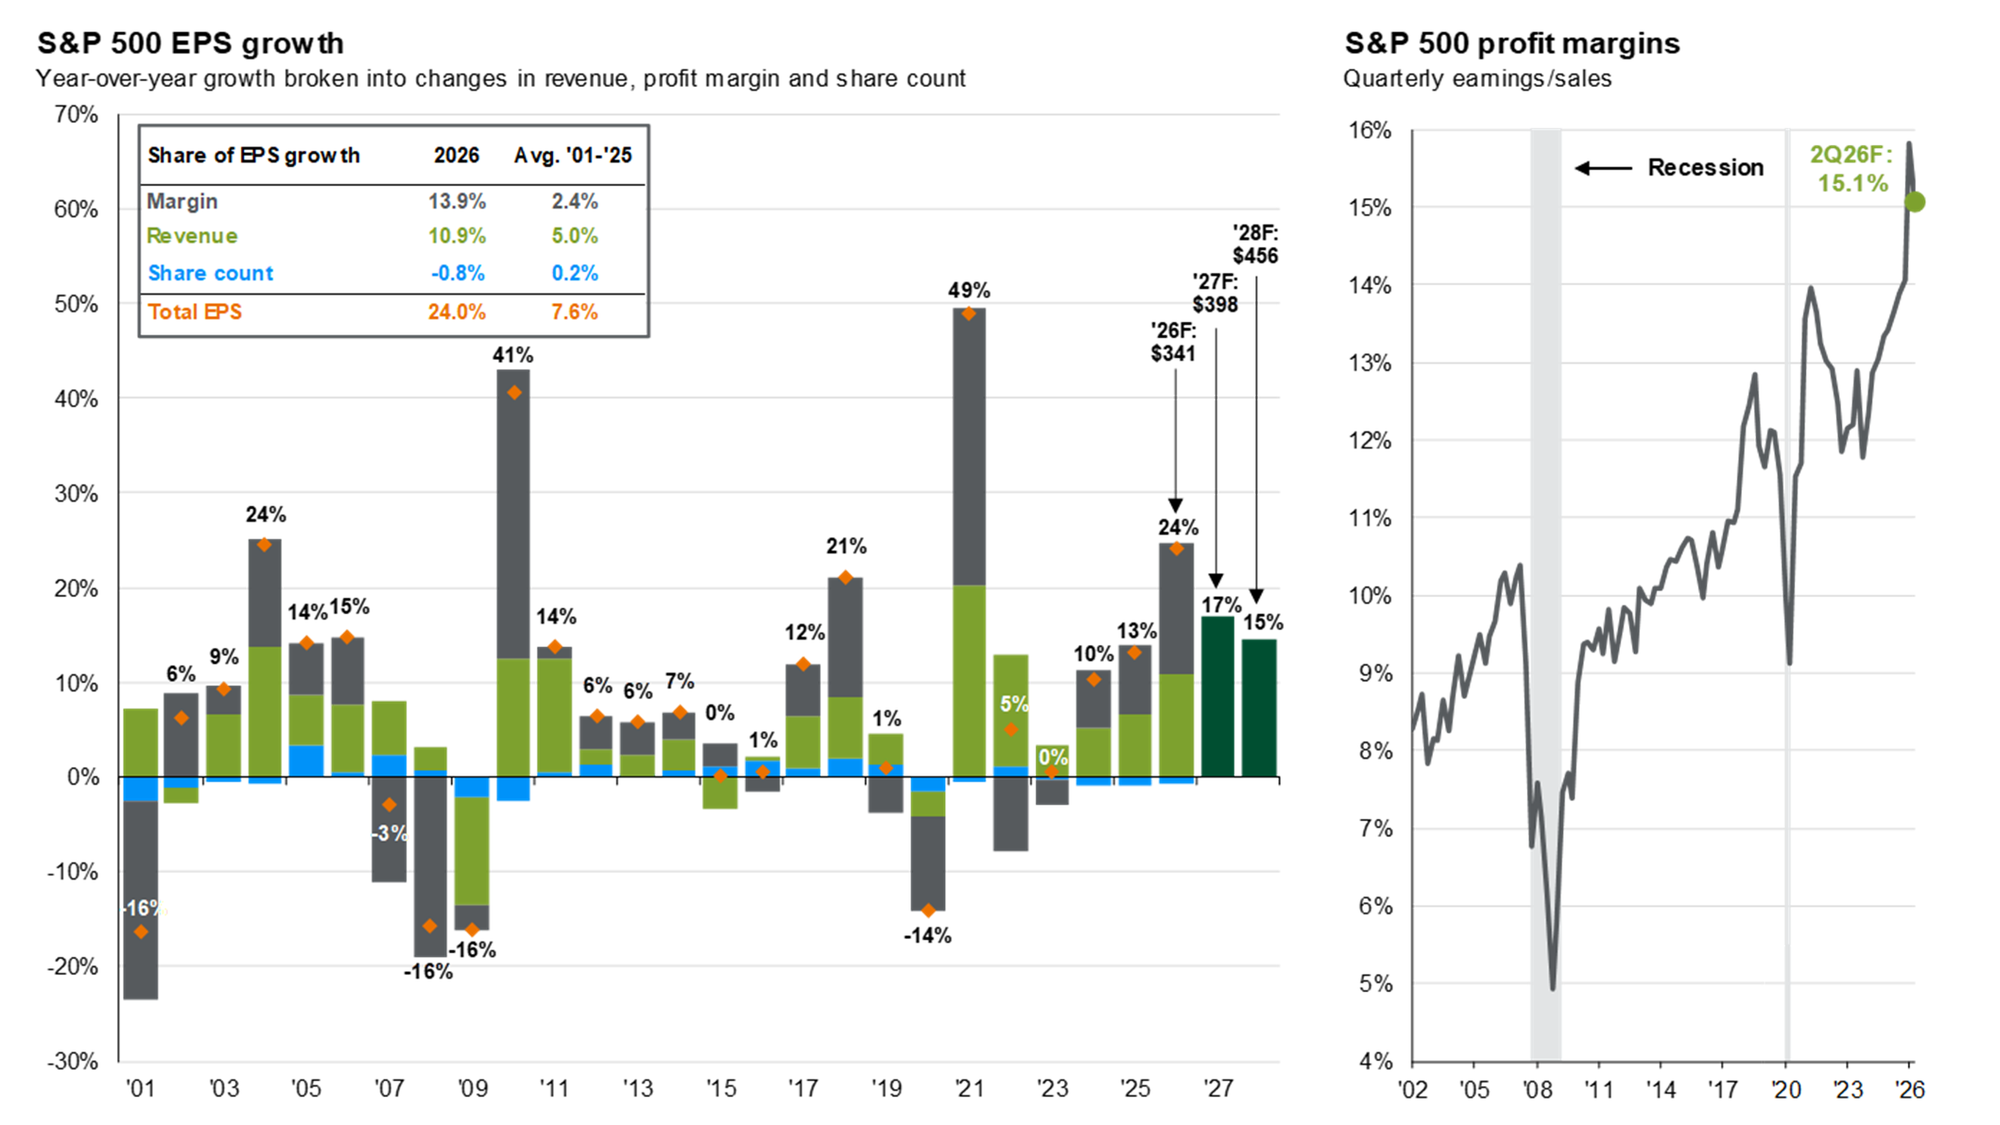
JP Morgan and others do see the growth rate slowing down, but still running the next two years at above average rates. I will say this – I remember vividly how impressive the earnings reports were in April 2000. They blew away everyone's expectations and made us all believe nothing could stop the growth. As we all learned the hard way, the first quarter of 2000 marked the peak in profit margins and revenue growth.
I'm not saying we are there yet, but we all must be careful in believing that nothing will stop this rally. My first 3 points are all headwinds that could hit the last point before anybody is ready for the party to be over. What should you be doing? We discussed this in our Summer Newsletter. The client focused newsletter discussed the importance of rebalancing, especially as the market continues to move in what seems like an unstoppable upward path. We're not saying to make wholesale changes, but we are urging everyone to re-examine their financial plan given the strong returns the past several years and ensure you don't have more risk than you can afford.
 Jeff Hybiak, CFA
Hello there, I'm George Moore IV - the newest addition to the SEM Wealth Management team, joining as a member of the investment team. Before landing at SEM, I have developed experience in researching, managing, and engaging in conversations for high-net worth clients covering both public and private markets across various investment and advisory firms within the Commonwealth of Virginia.
Numbers and financial markets have always been my thing, but I also love finding the story behind the data, you know, the kind of chart or graph that makes you stop scrolling and think, "huh, that's interesting."
That's the idea behind this series. Each week I will share a chart from the investment world that has caught my eye, something worth a second look, a good conversation starter, or just a clear read on what's moving markets from my perspective. And without further ado....
The American Dream Isn't Dying, It's Transforming
We've all heard the phrase, "The American Dream", at some point through one's voyage of adulthood and attempt to decipher what that was. From our Founding Fathers introducing "life, liberty, and the pursuit of happiness" to somewhere to the tune of work hard, get a job, buy a home, etc. It's unique to every individual or whatever age "bucket" society has placed us in (millennial here) and we ultimately realize that, in markets, the only constant is change.
Fueling my passion for behavior finance, I read 1929: Inside the Greatest Crash in Wall Street History by Andrew Ross Sorkin and currently reading Risk & Reward by Ben Carlson. Both publications beautifully unwrap the behavioral, economic, political changes over the course of recent history. One highlight that can't be ignored, the change in household wealth in America.
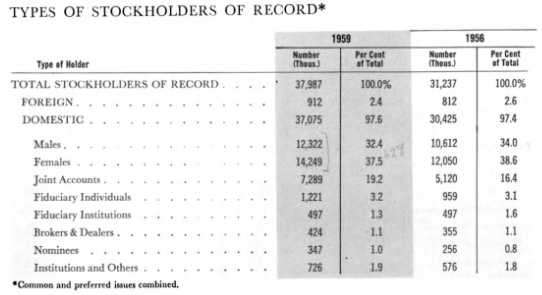
For perspective, in the early-1950s, nearly 4% (6.5 million) people in the U.S. owned a listed share of stock. In 1959, stock ownership for men accounted for 32.4%, and 37.5% for females, respectively. The average shareowner had a median household income of $7,000 and the median age of all shareowners was 49.
Fast forward to 2025, stock ownership has risen to 62% for the U.S. population and currently accounts for the highest proportion of household wealth at 34%.
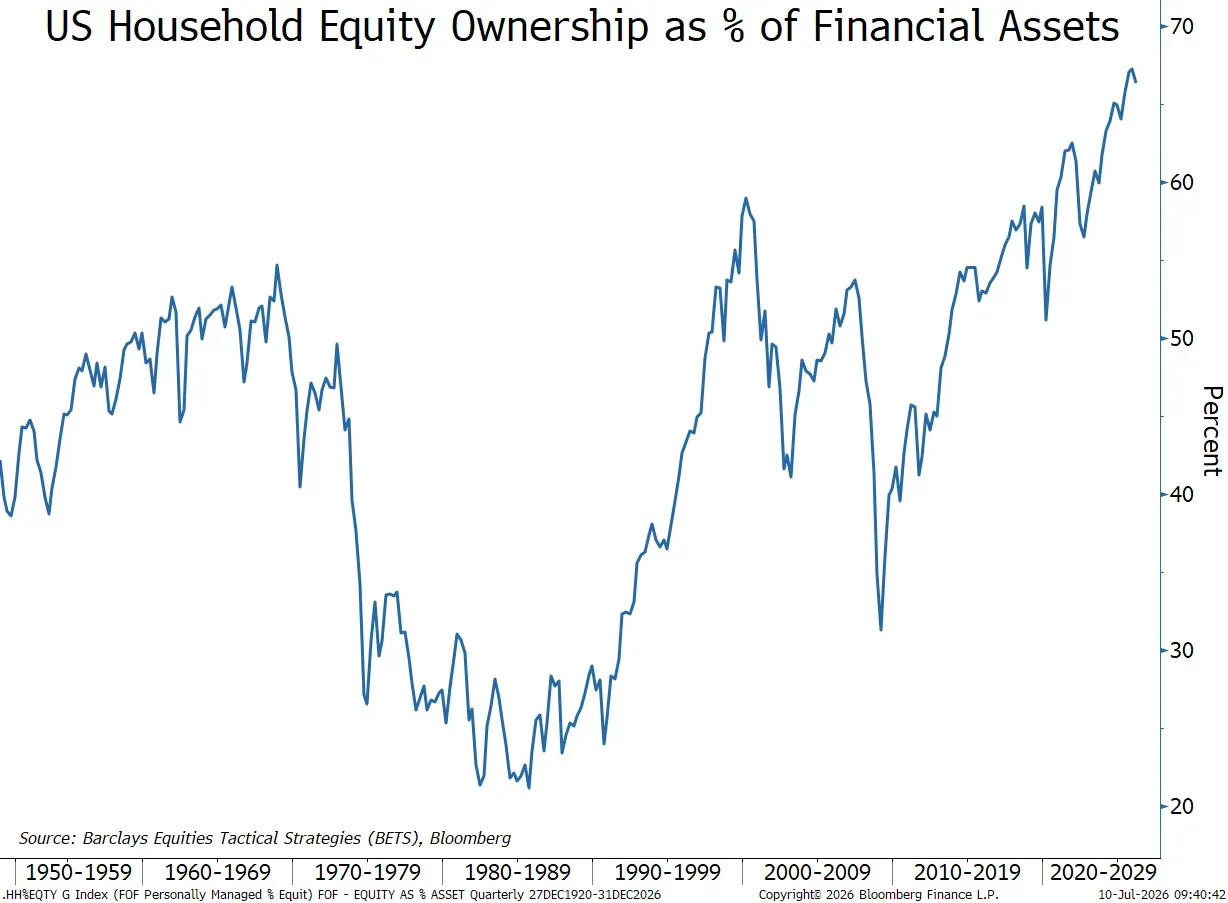
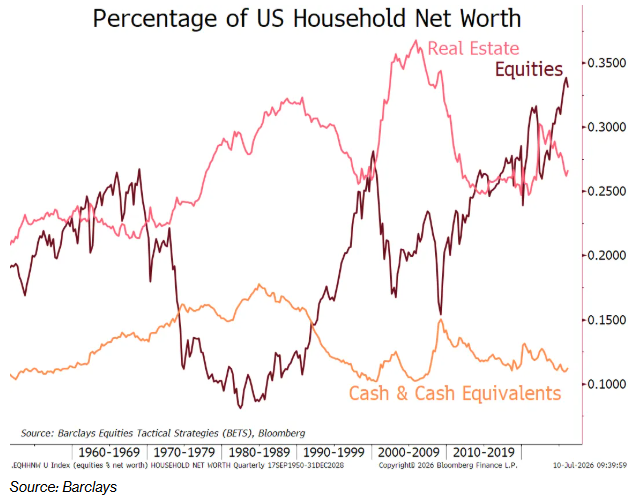
Even after the 2008 housing bubble, real estate was the poster-child for being the driver of America's total wealth. Now, that has shifted for ~26%.
The spread of household net worth between real estate and equities has widened to an 8 percentage point difference, the widest on record.
But let's go into detail a bit further..
Based on the combined data from Gallup's Economy and Personal Finance surveys from 2024-2025, the percentage owning stock among adults is the highest, 87%, for those earning $100,000 or more, followed by college graduates (84%), and married adults (77%).
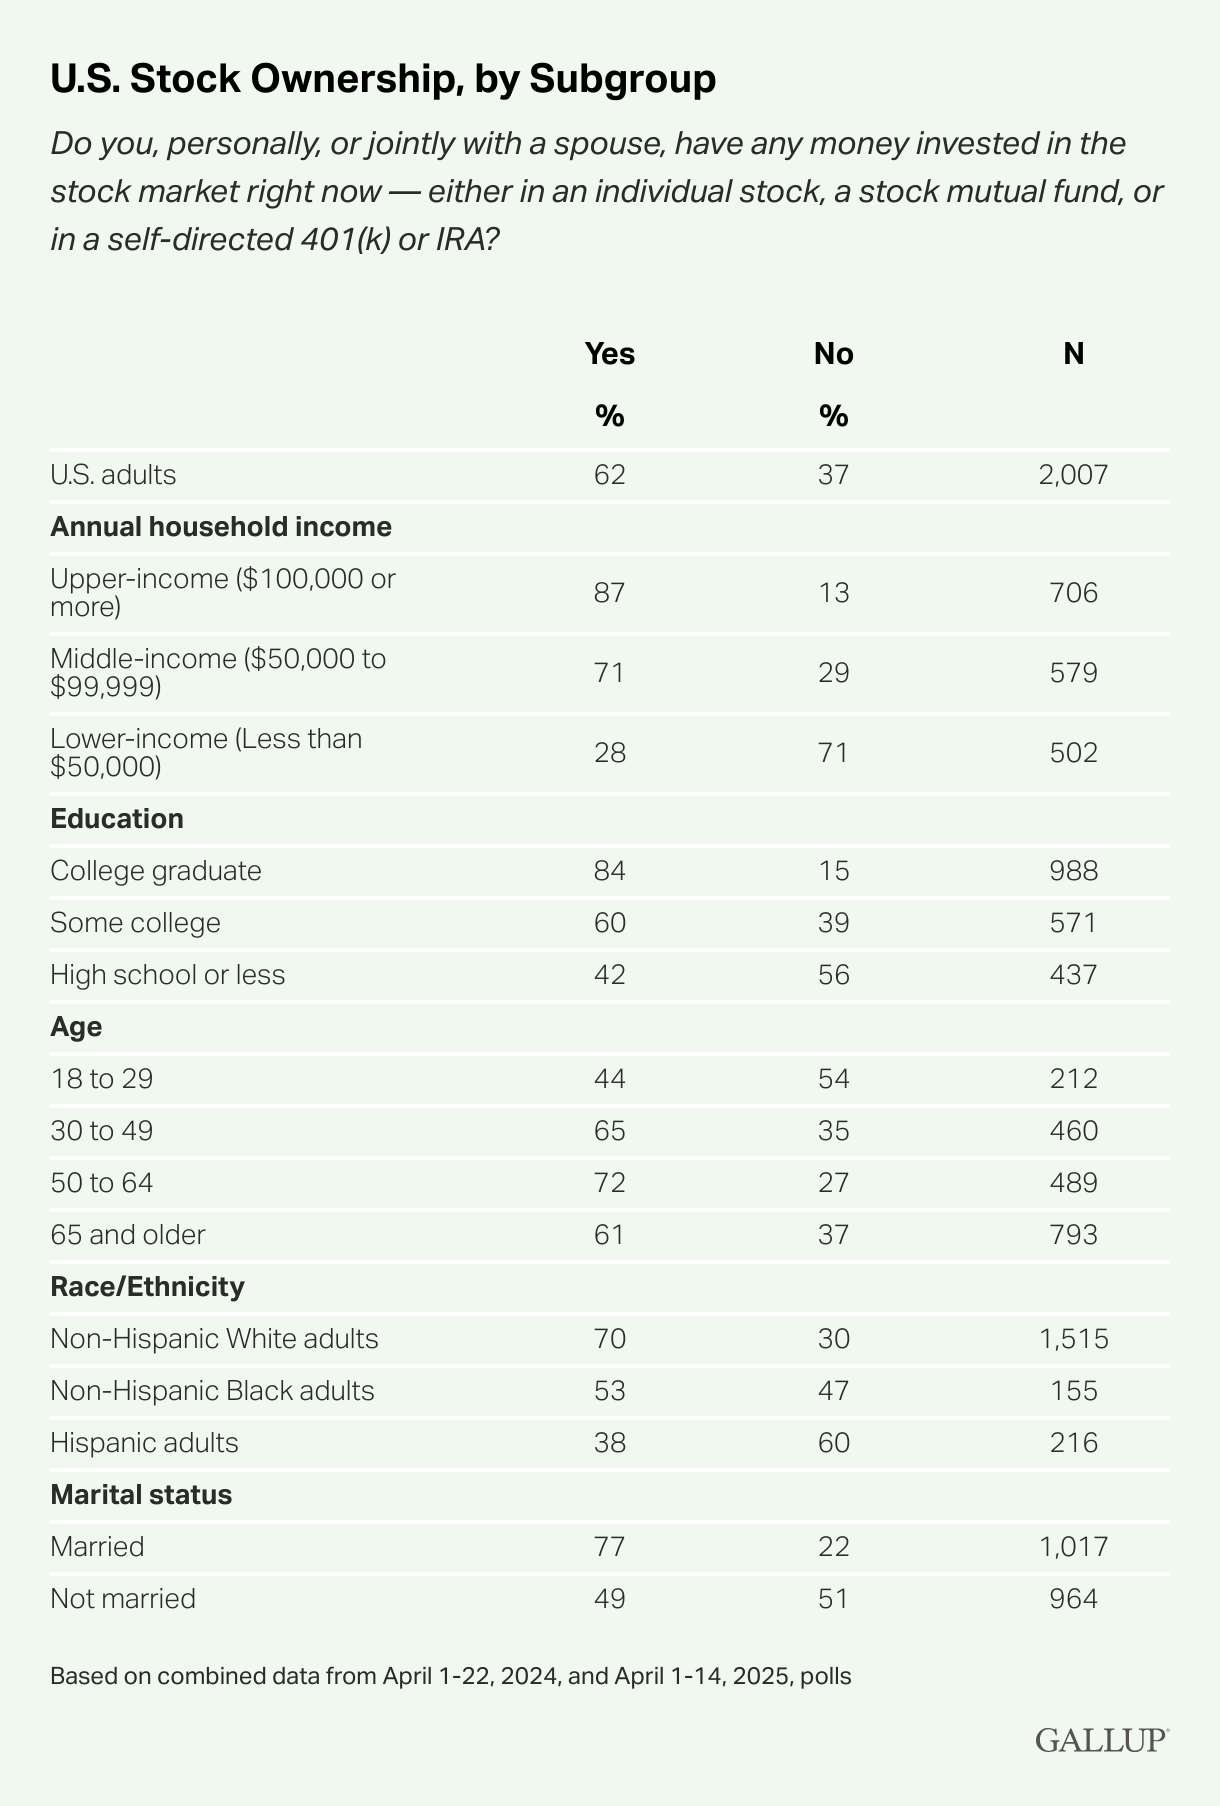
Sure, there have been a lot of drivers that allowed this to come to fruition over the years. Stock ownership, in total, only significantly grew beginning in the 1990s. For the younger demographic, beginning an ownership in stocks amidst rising housing costs, etc. can be seen as a shining light for putting disposable income to work to supplement their longer time horizon.
With stock ownership, the broader US economy, and household wealth becoming so dependent on one another, it's like we've all collectively pushed all of our chips into the pile and wished that our American dream reveals a continuation of positive performance from the US equity market.
As we navigate through this journey of markets and continue that "dream", we are reminded, the only constant in markets is change.
Thanks for reading the inaugural edition of George's Chart of The Week. I hope to continue to share these talking points about markets, investing, etc. for you to share with family, friends, coworkers, or whoever along the way.
See you next time!
Market Update
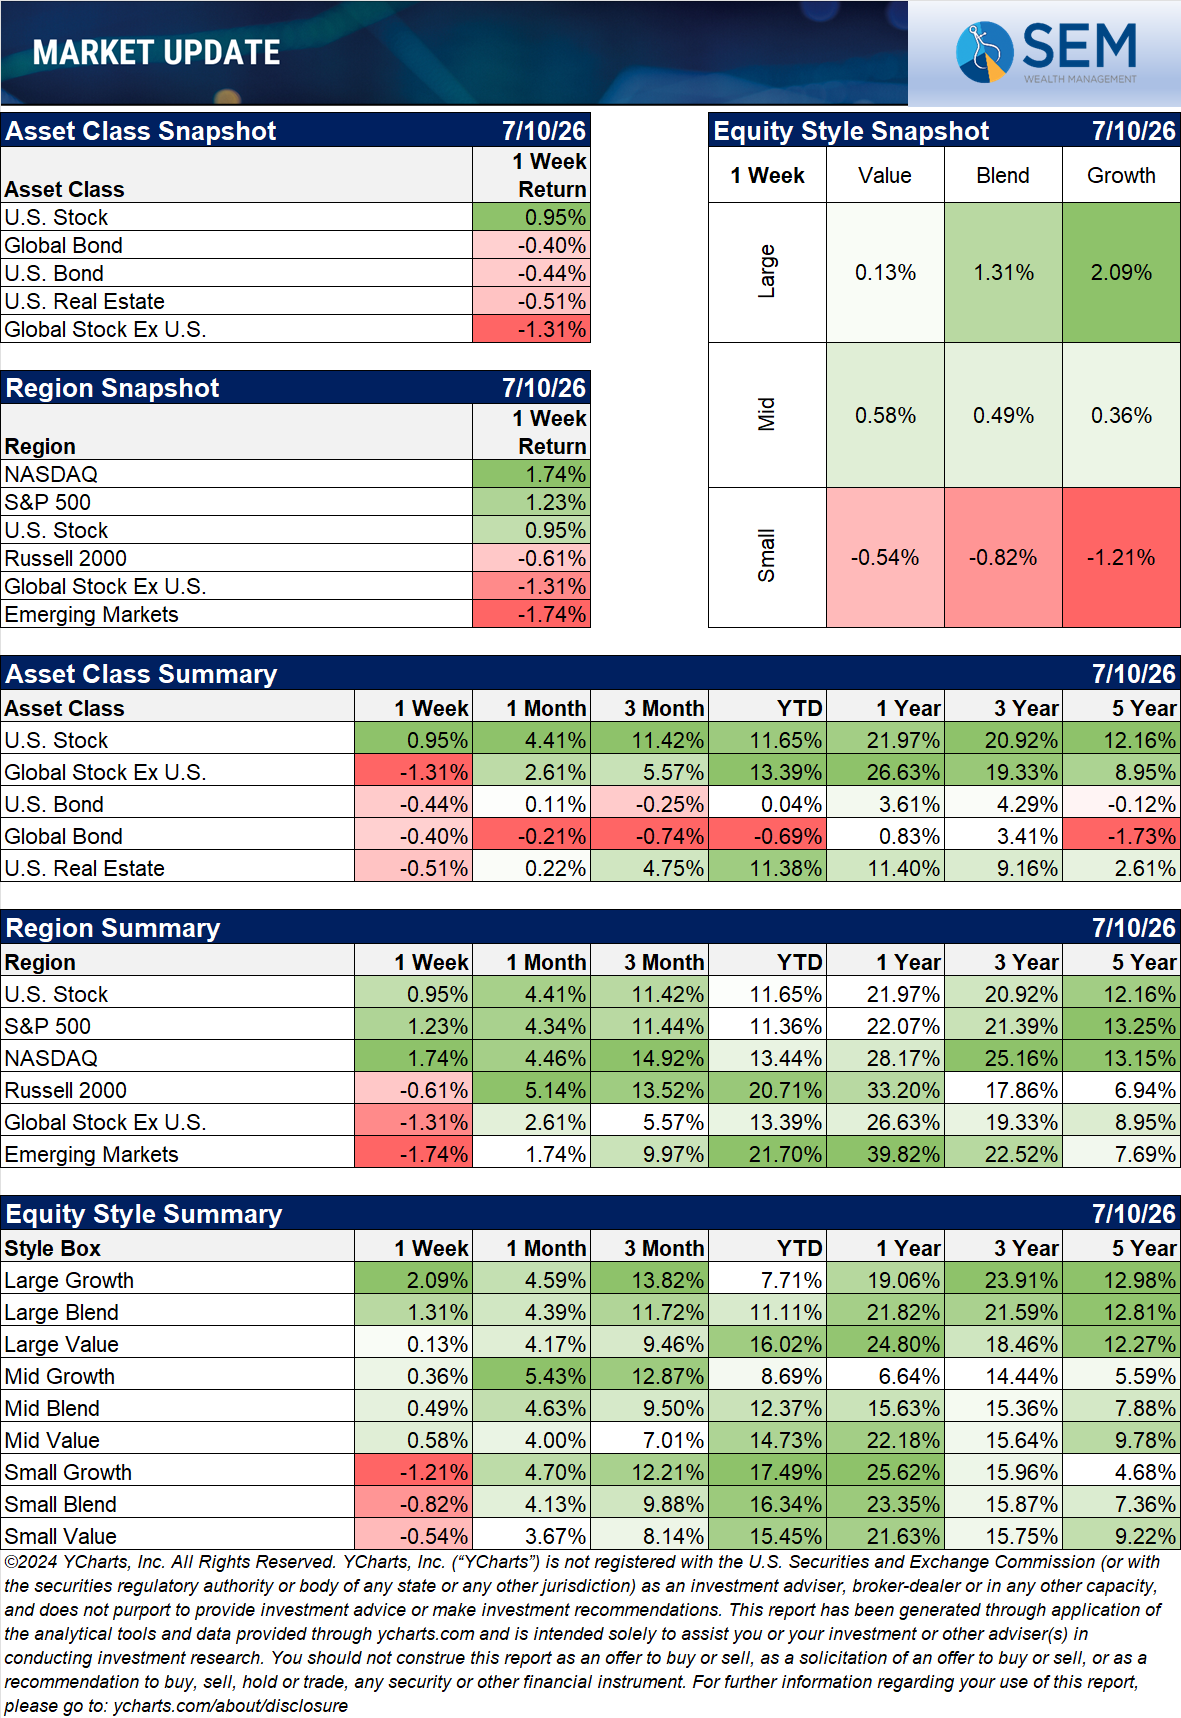
Large Cap Growth stocks led the way last week with the rest of the market suffering.
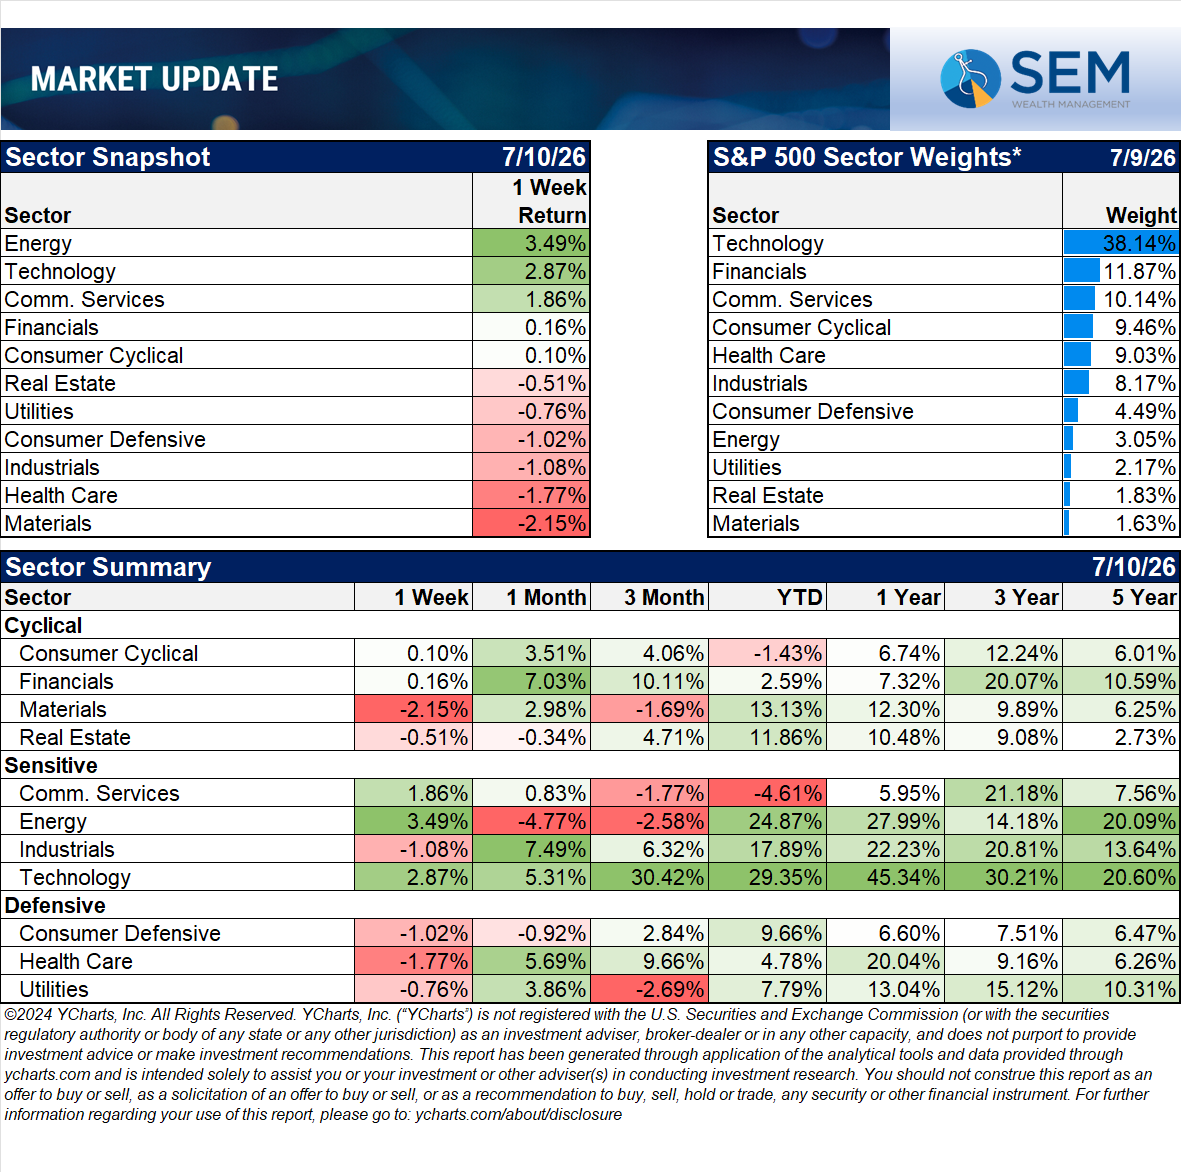
The energy and tech sectors, which are atop the 2026 leaderboard were again the top sectors last week.
Tech stocks actually stumbled (as noted in the lead article above) on Tuesday and Wednesday, but were able to rally back to bring the S&P close to its all-time high.
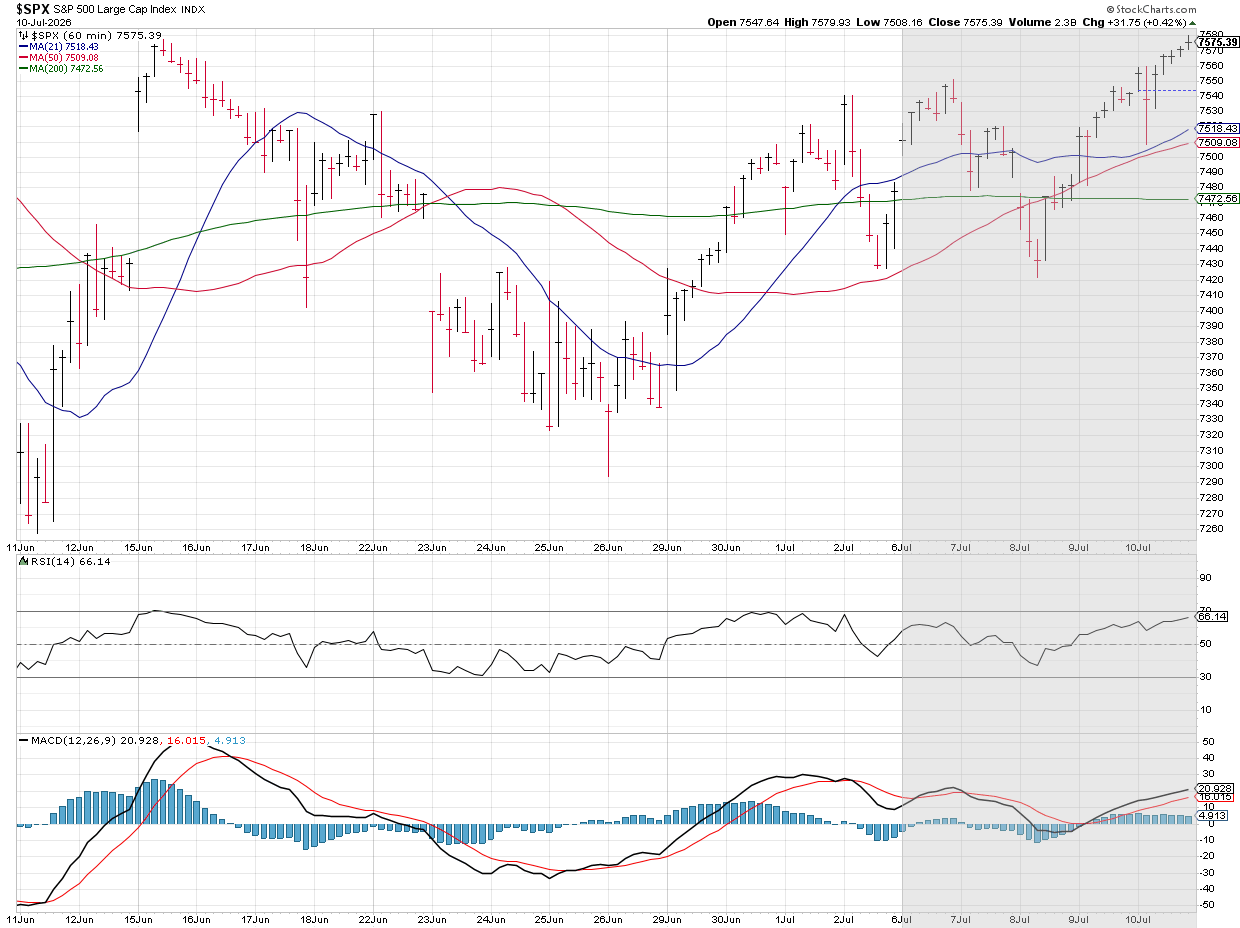
The S&P 500 is now above where it was before the Fed meeting. It seems for now stock investors are not so worried about the Fed raising rates.
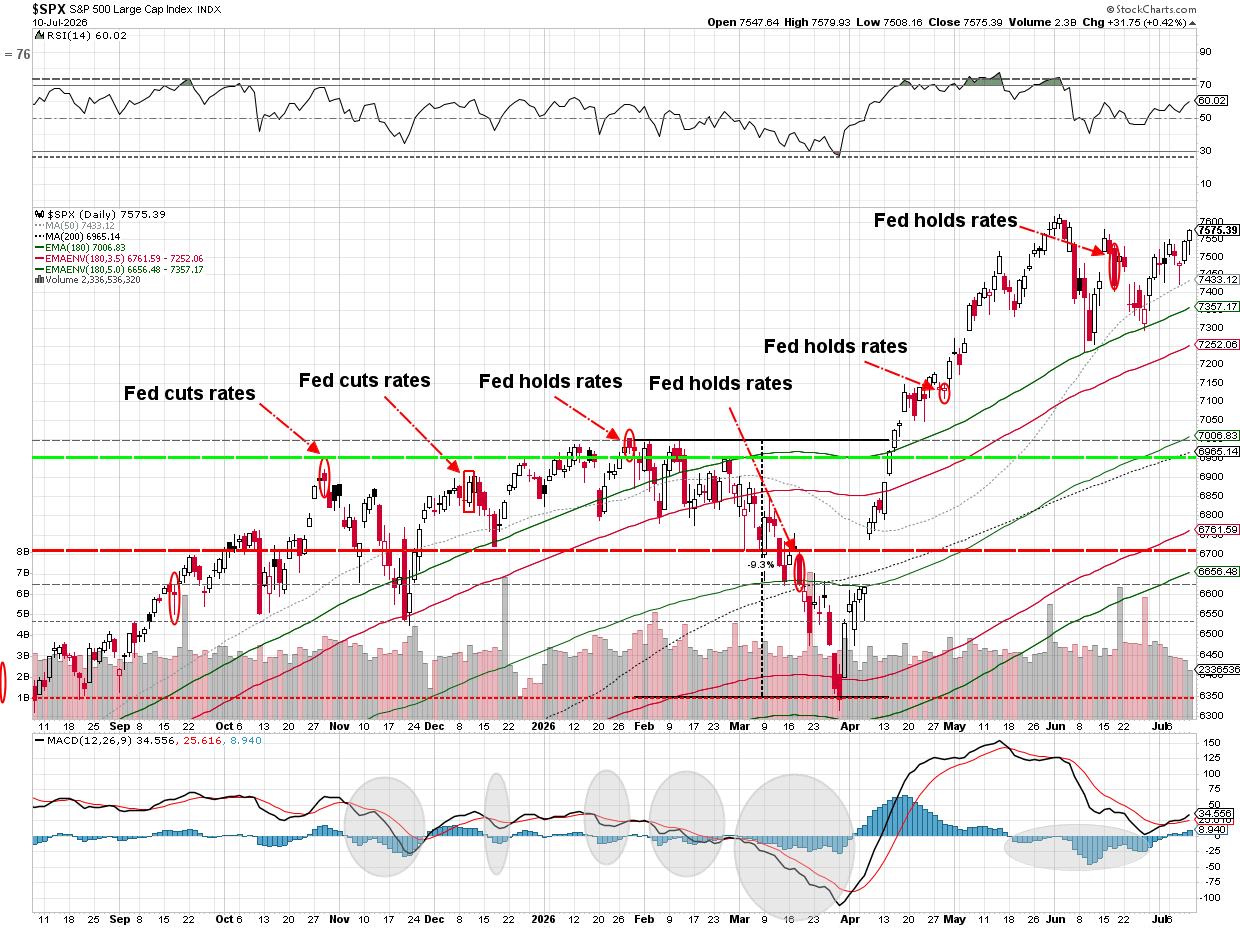
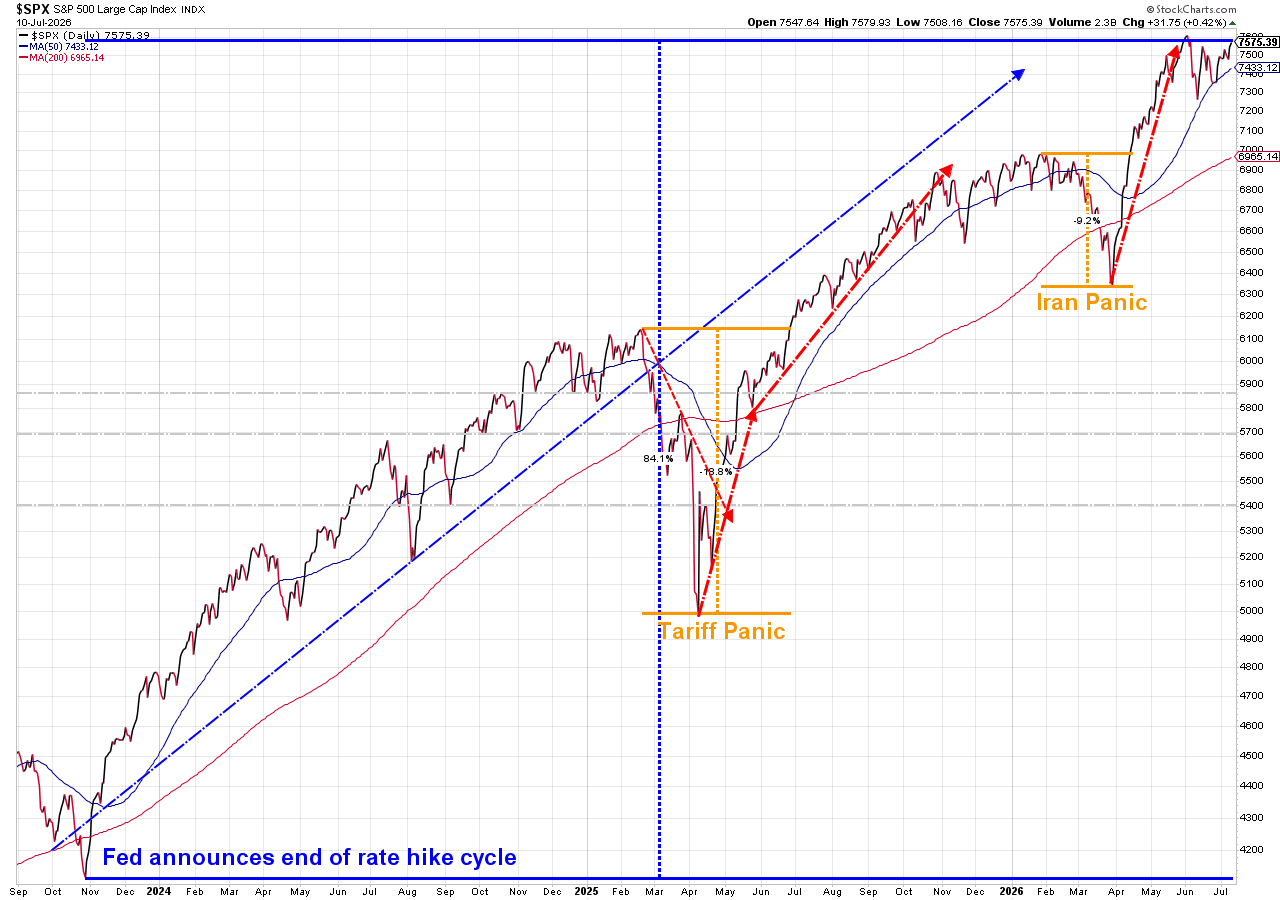
There has only been 2 minor blips since the Fed announced the end of their rate hiking cycle at the end of 2023. How long can this continue? Time will tell.
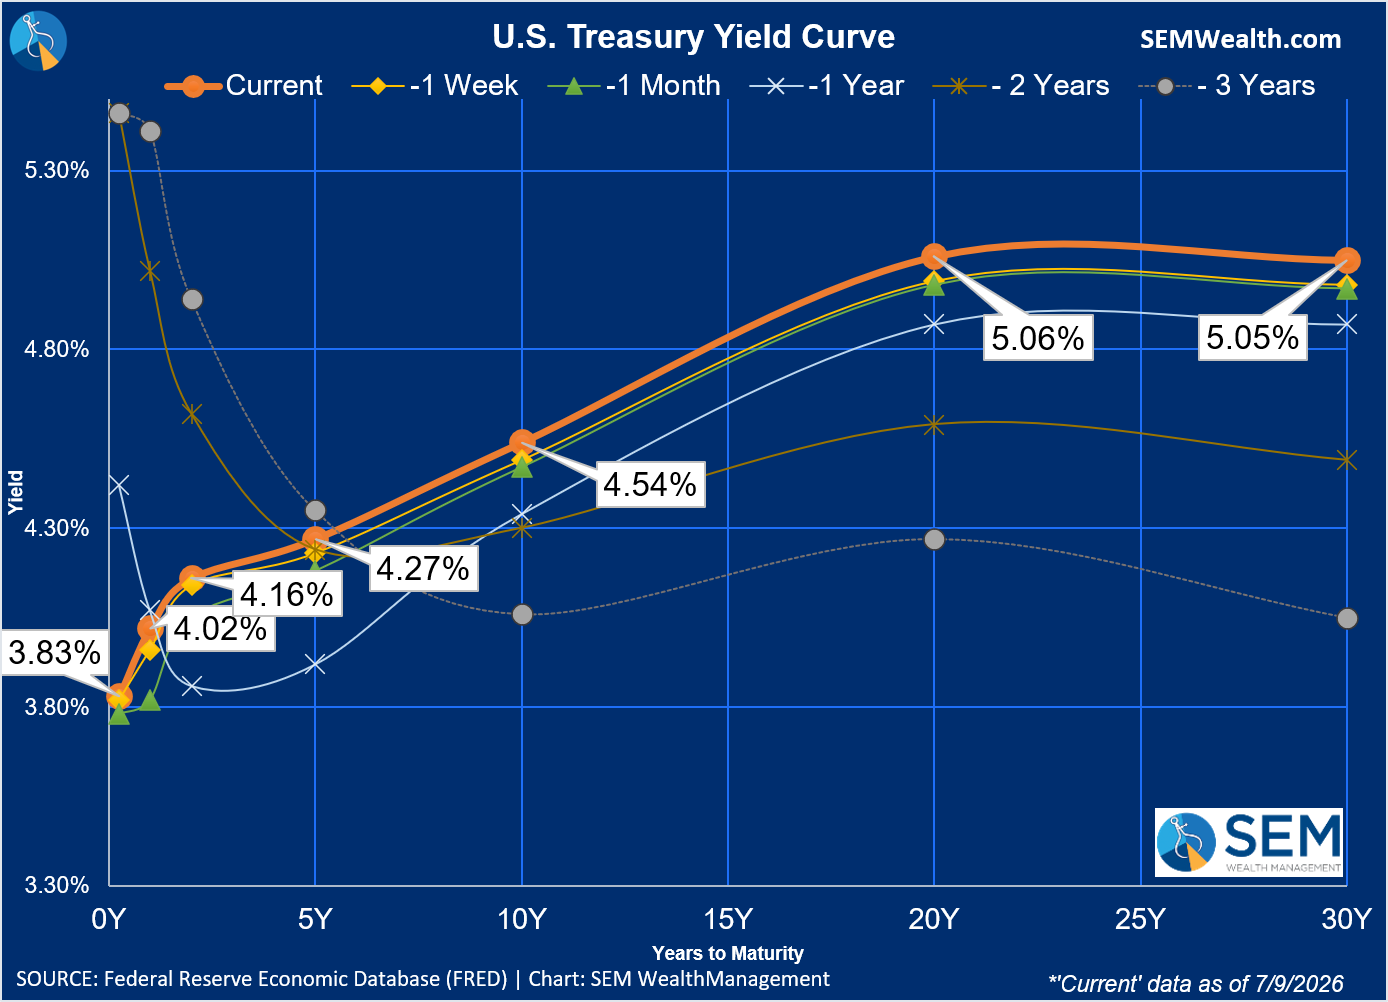
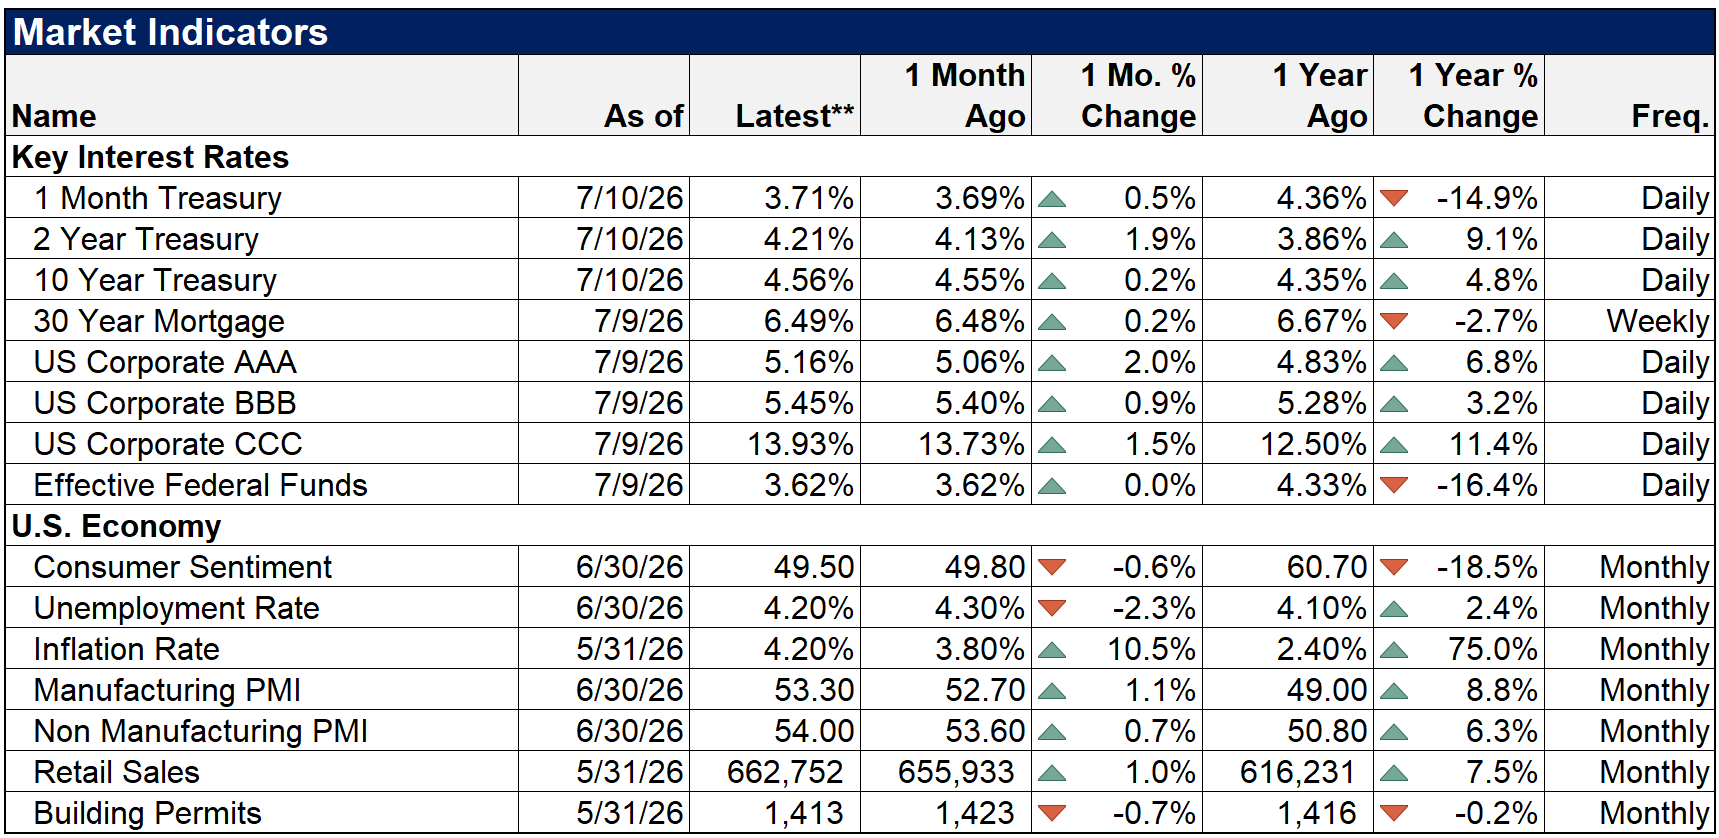
Rates did push higher across the board last week and are significantly higher than they were a year ago. Again, time will tell when this matters.
Economic Data
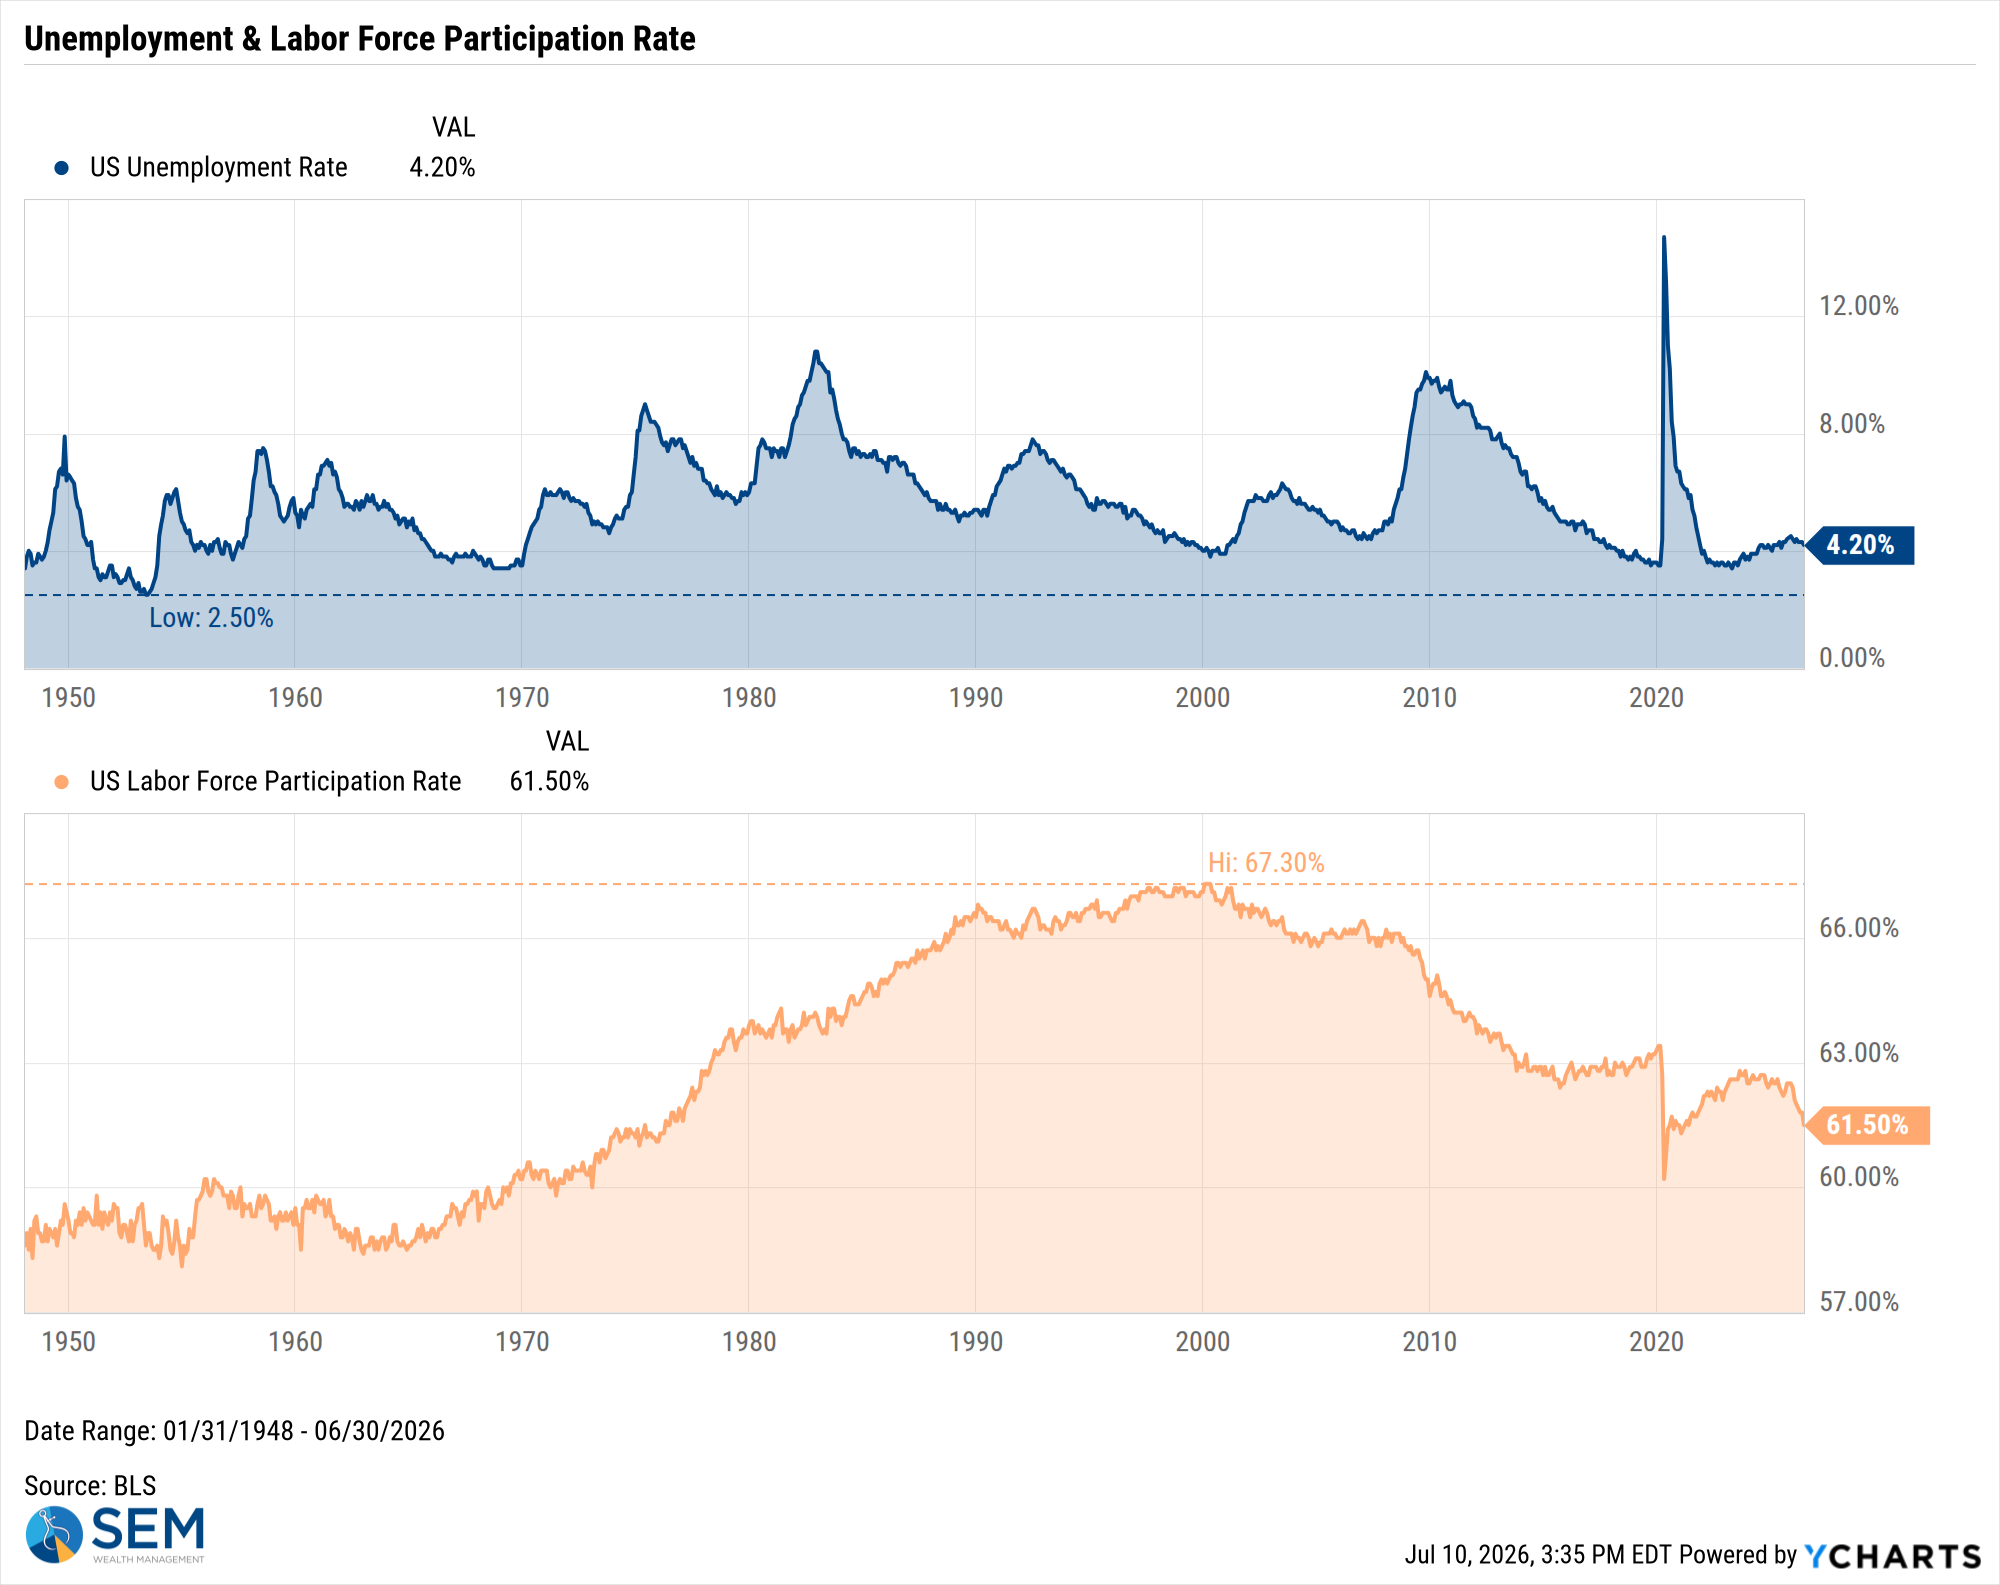
US Unemployment Rate data by YCharts
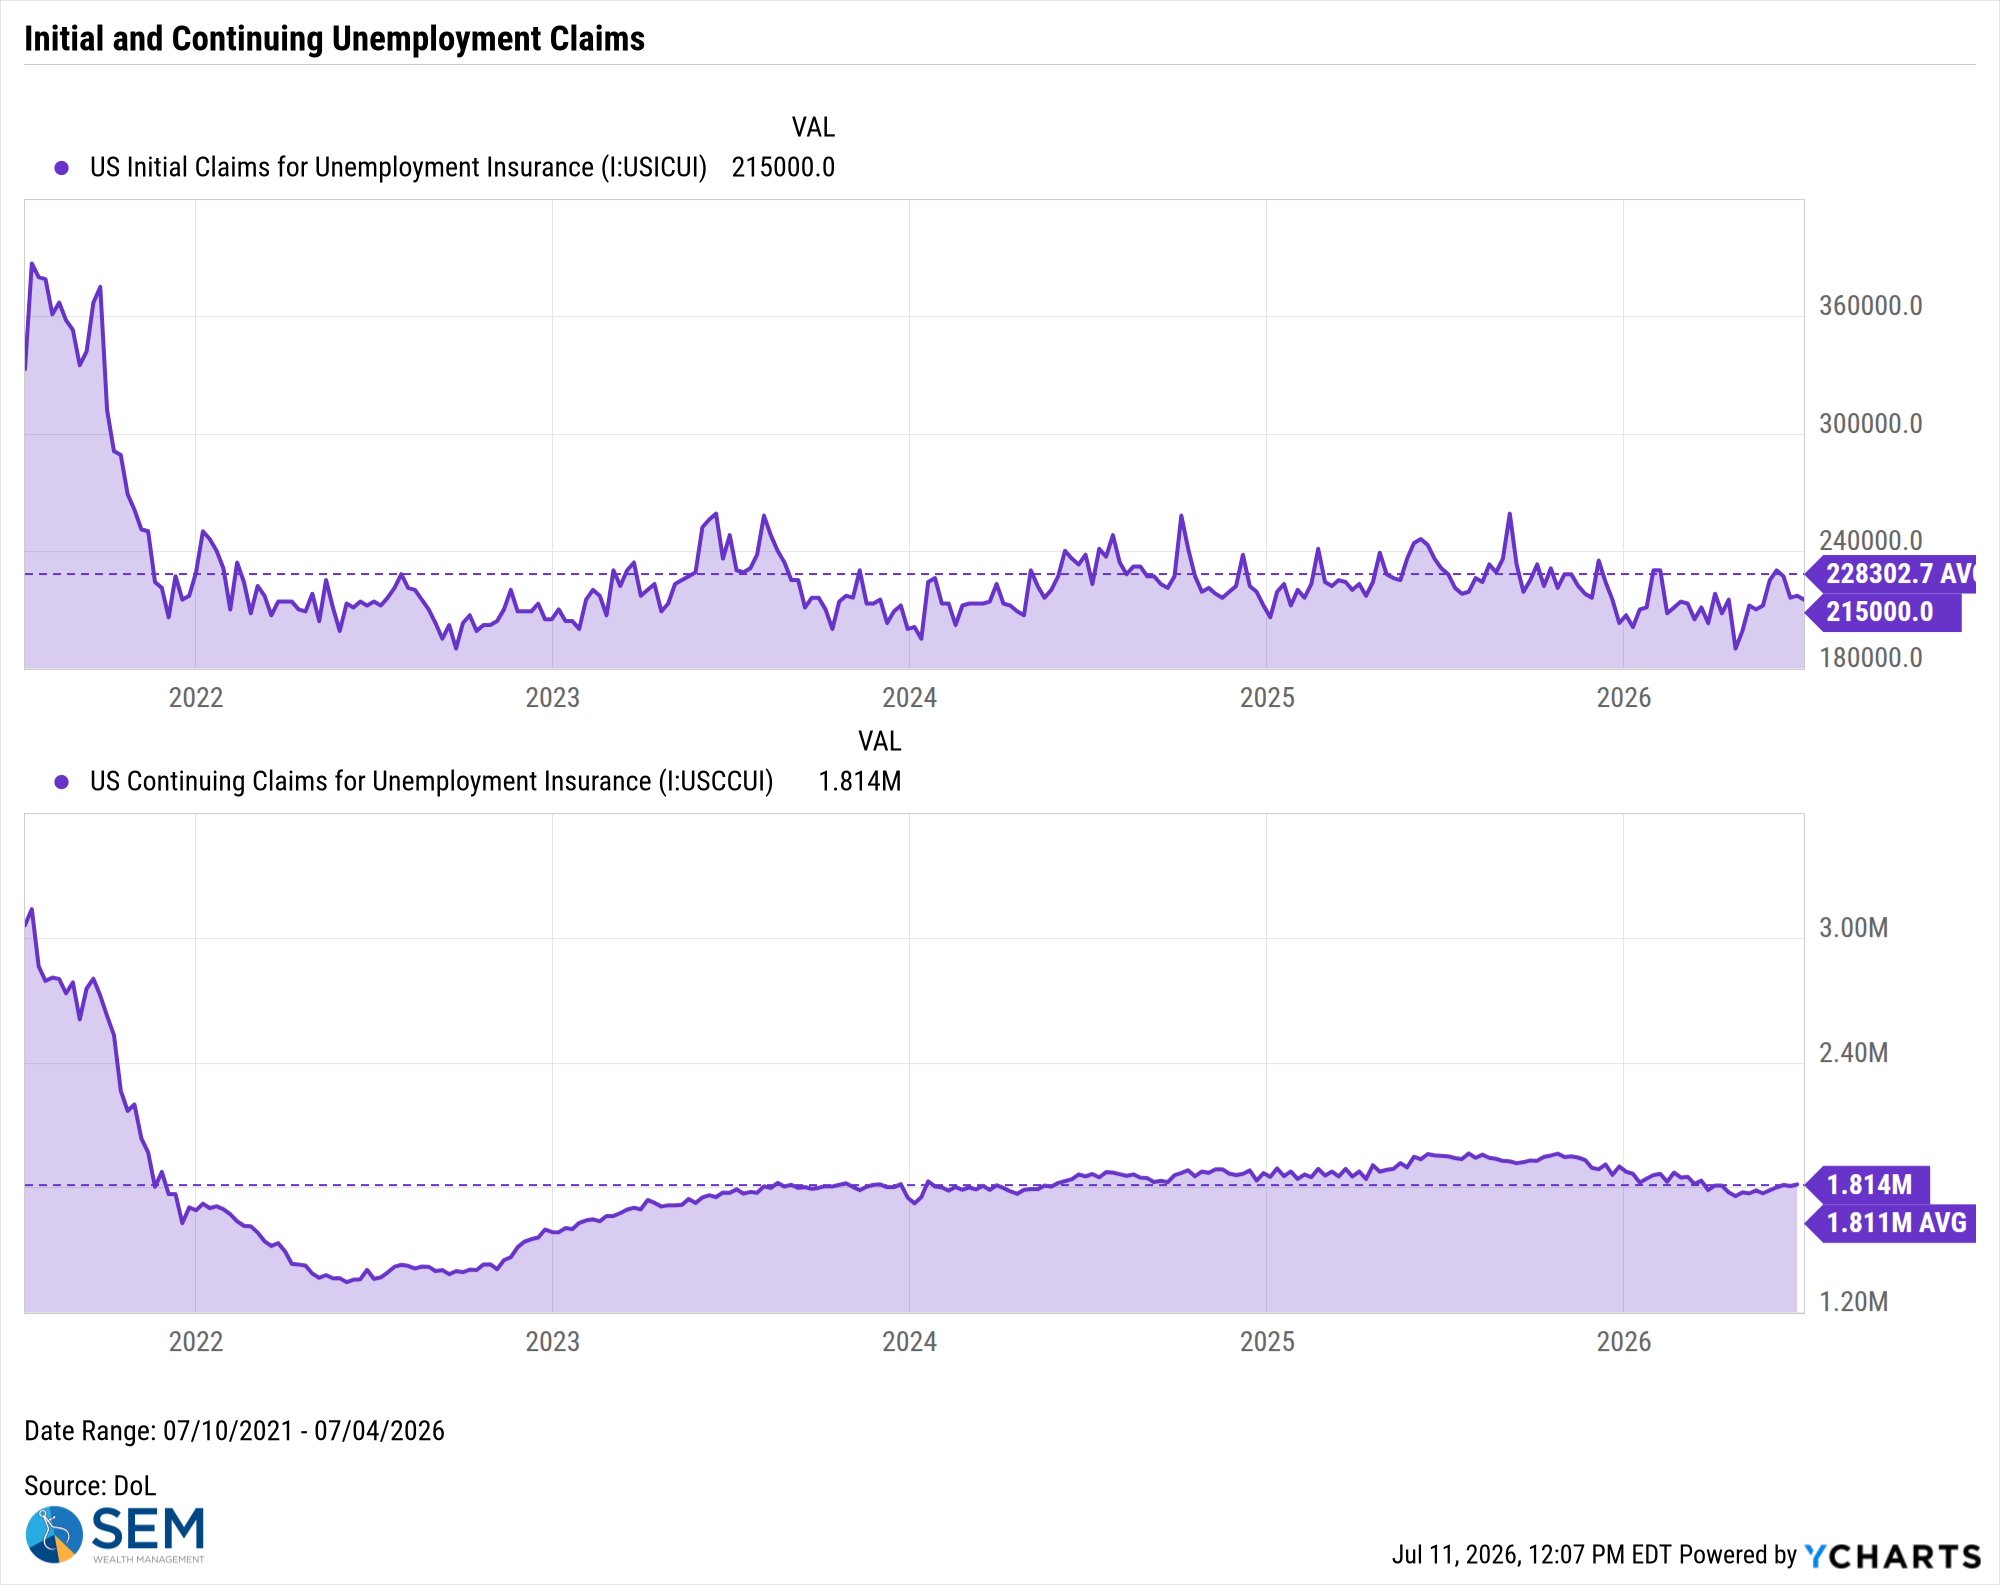
US Initial Claims for Unemployment Insurance data by YCharts
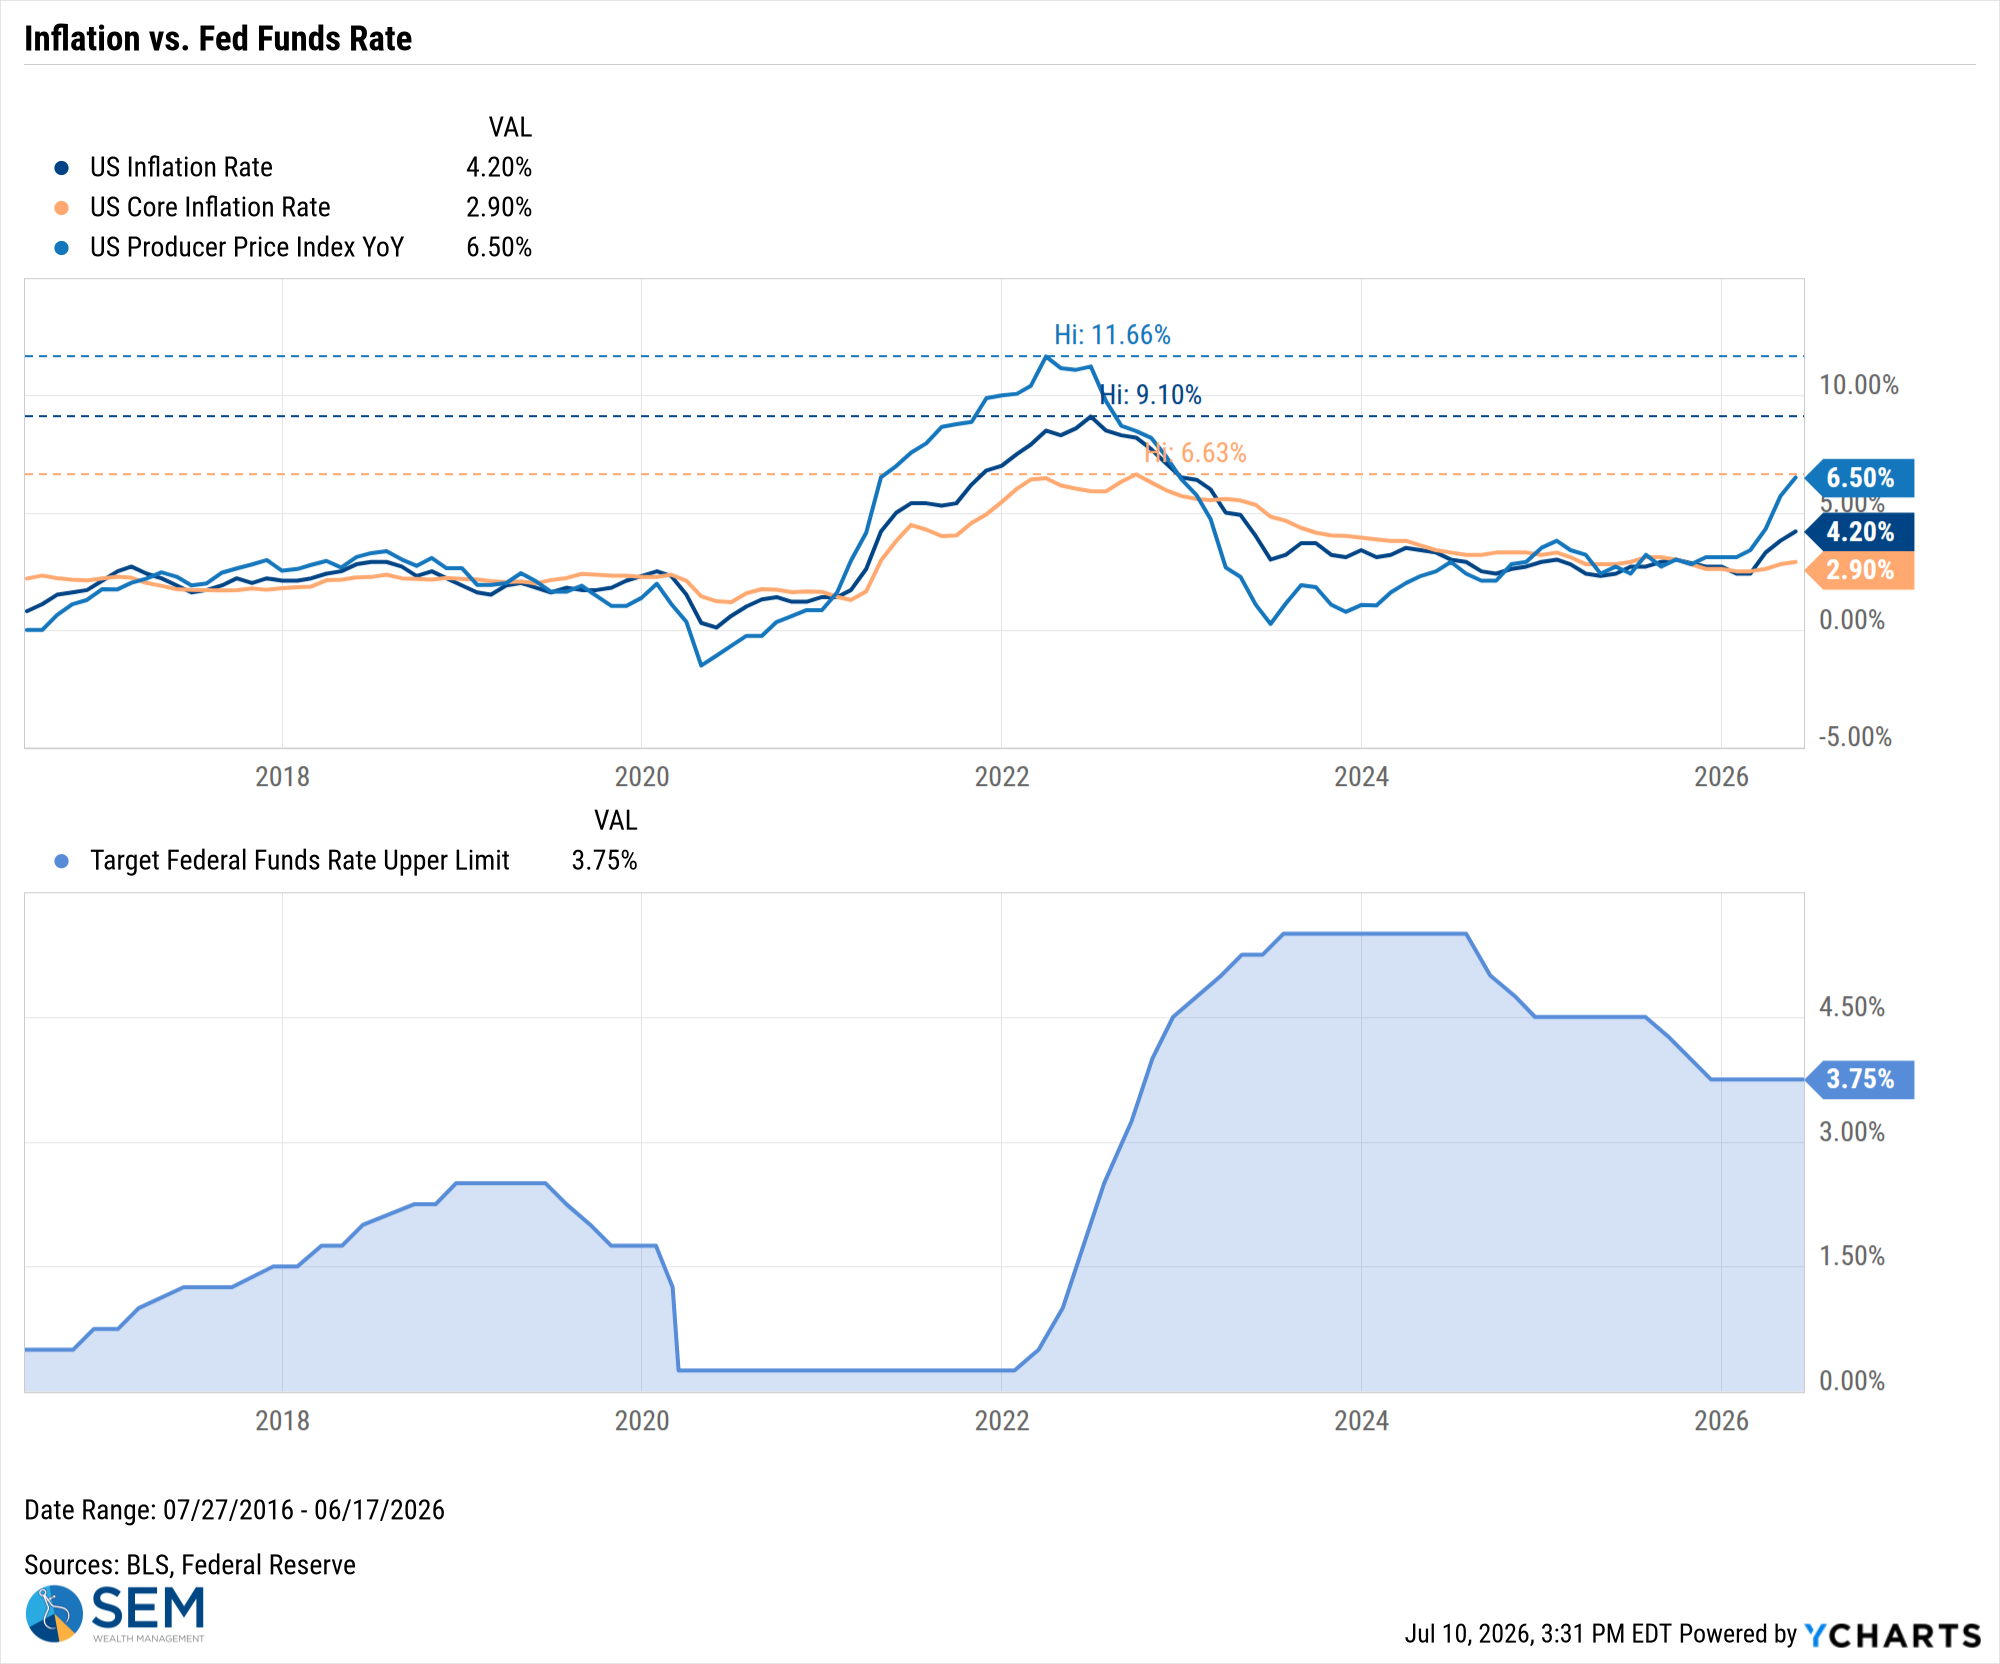
US Inflation Rate data by YCharts
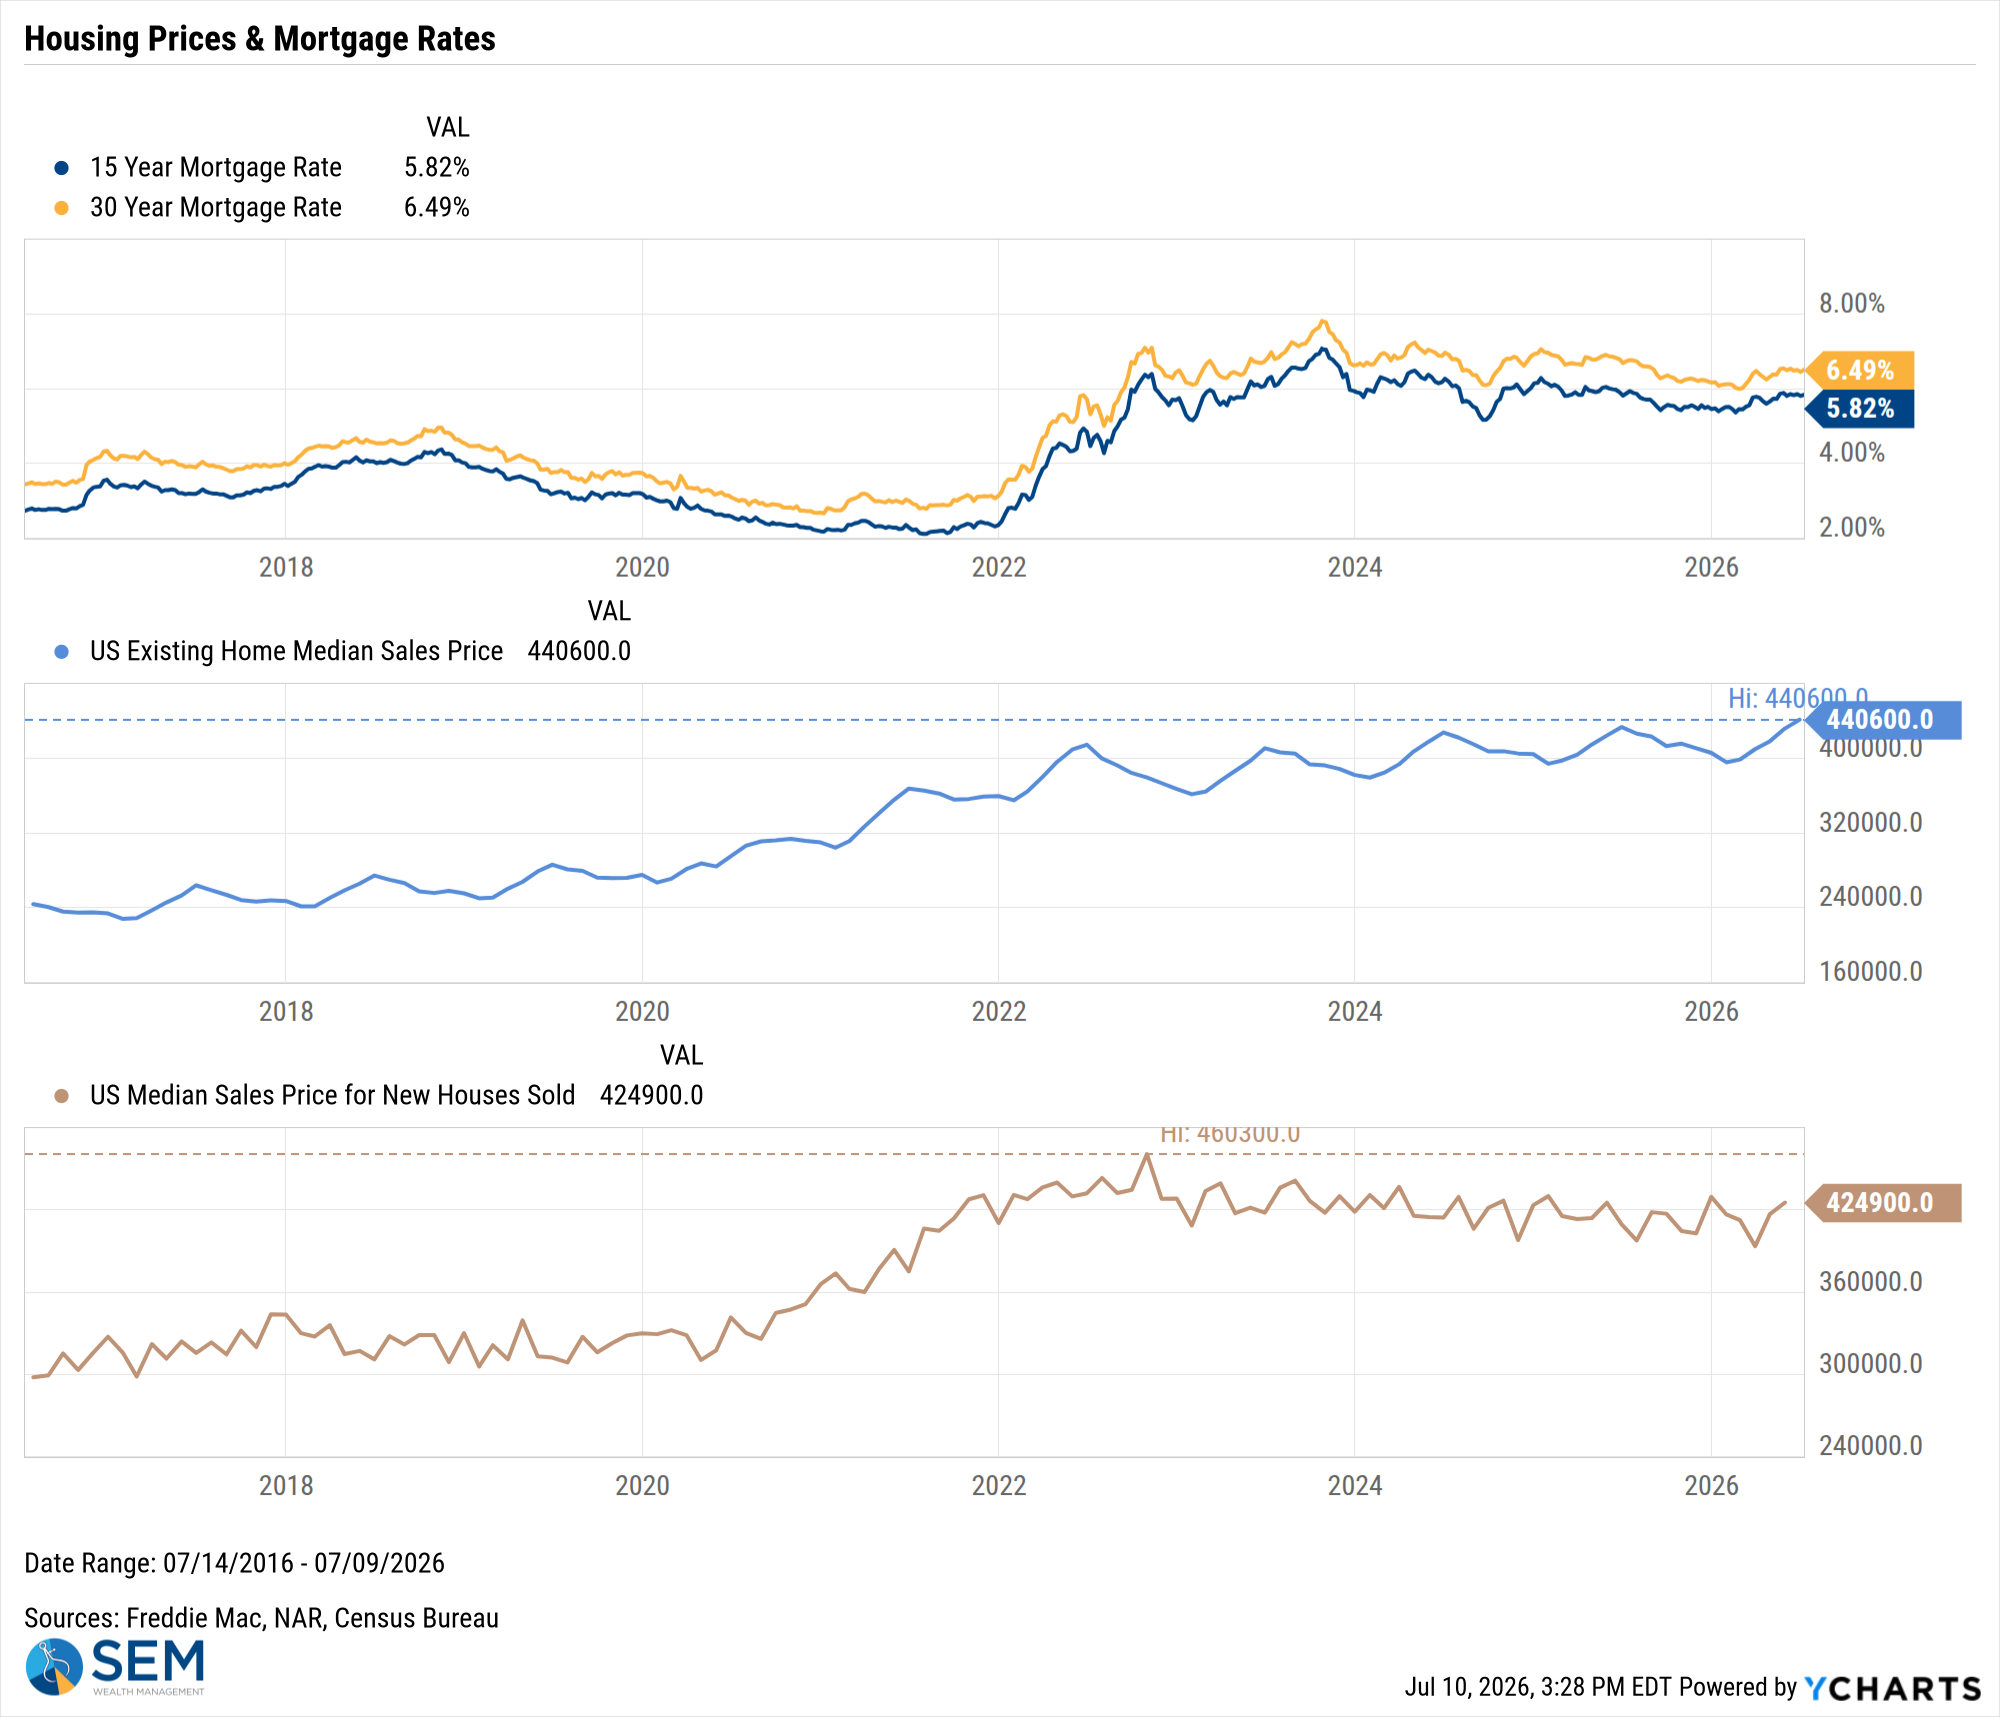
US Existing Home Median Sales Price data by YCharts
SEM Market Positioning
SEM deploys 3 distinct approaches – Tactical, Dynamic, and Strategic. These systems have been described as 'daily, monthly, quarterly' given how often they may make adjustments. Here is where they each stand.
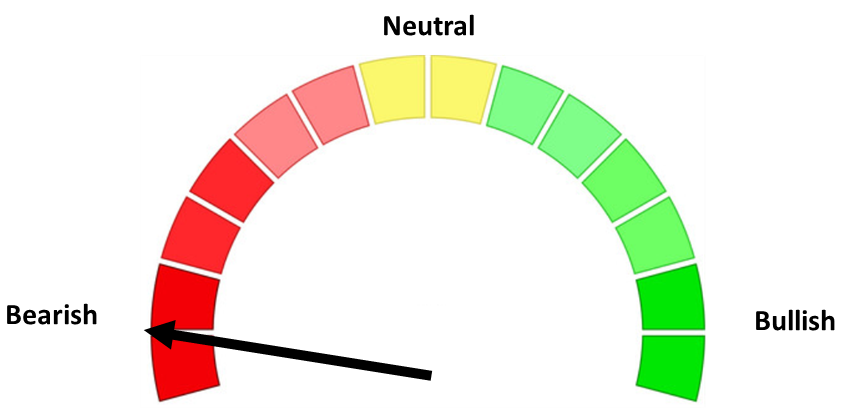
- Tactical = BULLISH | 100% High Yield Bond (4/8/2026) | High-yield spreads remain narrow but trend is slightly higher
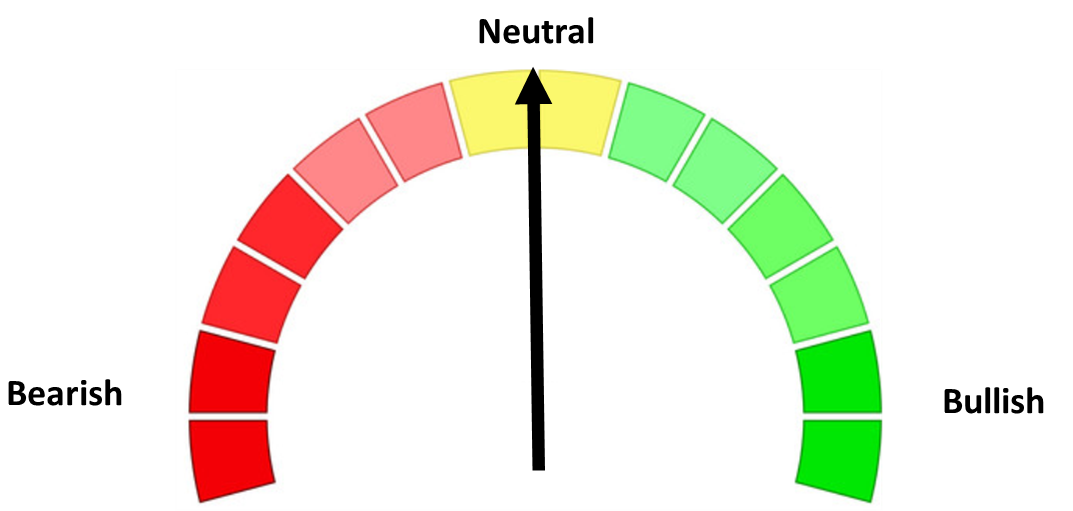
- Dynamic = NEUTRAL (2/15/2026) | "Benchmark" Allocation | Economic model inconclusive
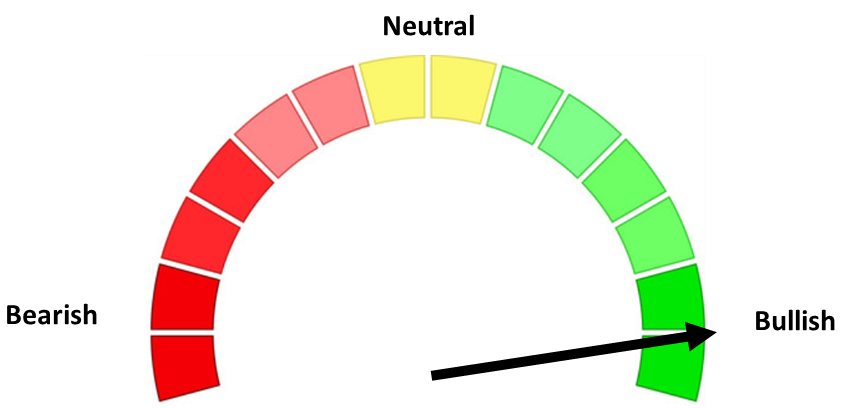
- Strategic = BULLISH (4/15/2026) | V-Bottom projecting "end" of Iran War
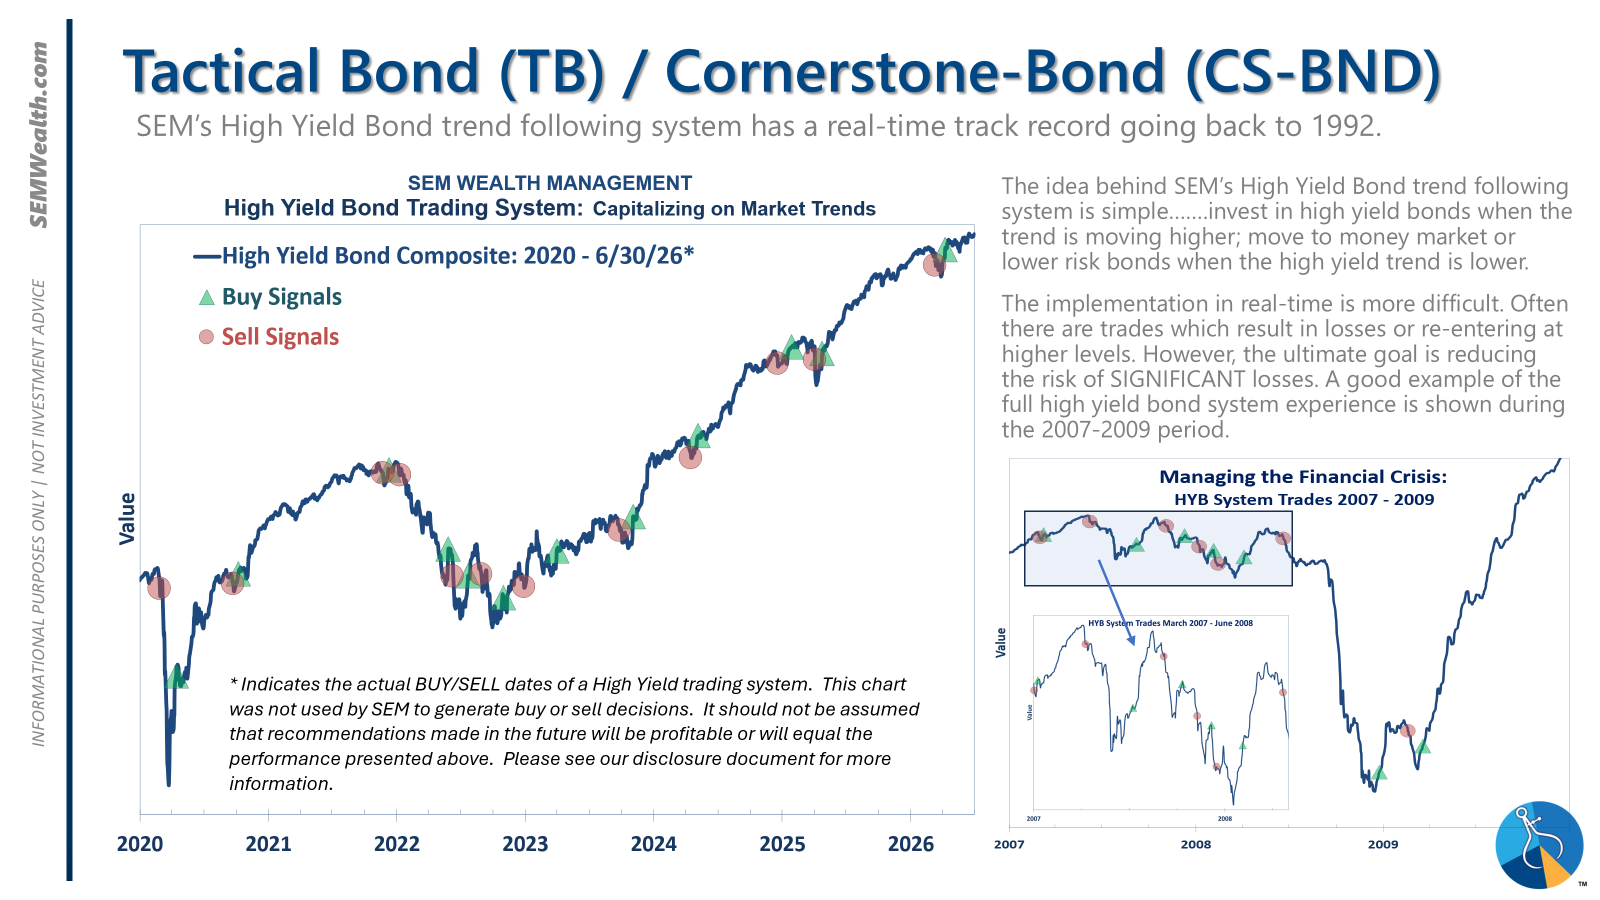
Tactical (daily):
- Monitored DAILY
- Models: Tactical Bond, Cornerstone Bond, Income Allocator, Tax Advantaged Bond
- Designed to follow the trends for use in our lower risk models
- BUY Signal issued April 8, 2026 (exiting the sell from March 13)
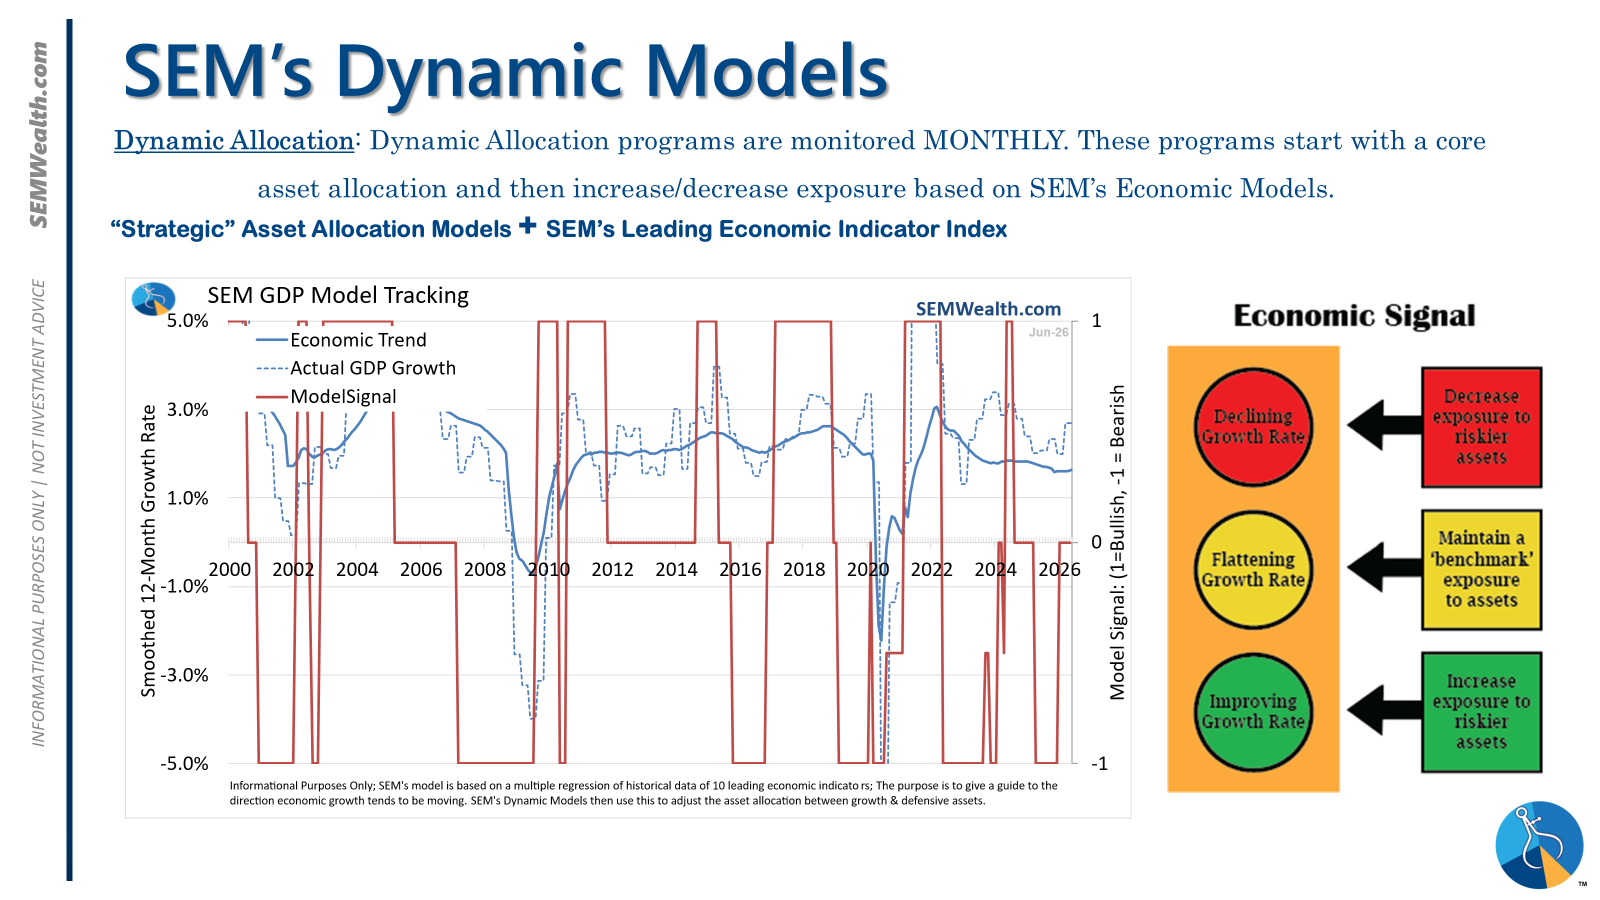
Dynamic (monthly):
- Monitored MONTHLY
- Models: All "Dynamic" Models (Income, Balanced, Growth, and Asset Allocator)
- Uses SEM's Quantitative Economic Model
- Designed to overweight riskier assets if economic trend is higher & underweight those assets if economic trend is lower.
- NEUTRAL signal issued February 15, 2026 (following BEARISH signal from July 2025)
Strategic (quarterly)*:
- Monitored QUARTERLY
- Models: AmeriGuard (Balanced, Moderate, & Growth) and Cornerstone (Balanced & Growth)
- Core Component: Quantitative Filter using 4 different time horizons across universe of asset classes
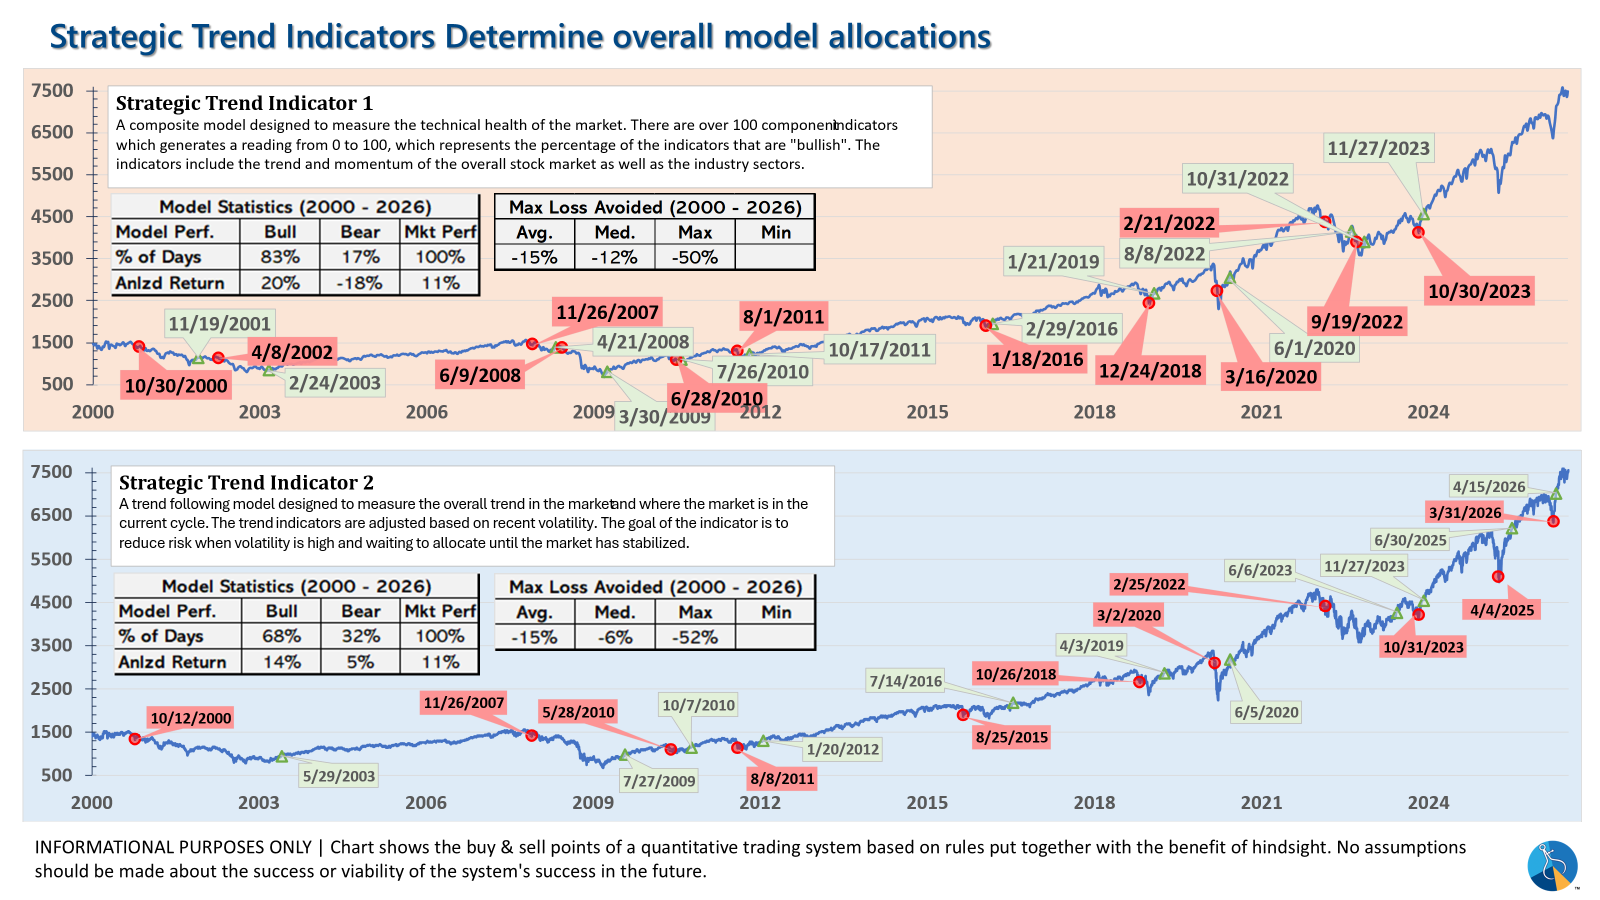
- Trend Indicator: Two different Quantitative Systems monitoring the intermediate-term trend, health of the market, and volatility
- CORE has been overweight small cap and international since October 2025 – overweight increased slightly in January
- Both TREND INDICATORS are BULLISH following 10% drop and "V-Bottom" reversal in early April
- AmeriGuard & Cornerstone Max DO NOT use the Trend indicator and are always 100% invested in stocks using our CORE rotation model.
The core rotation is adjusted quarterly. This quarter we saw half of our international positions reduced (we sold developed markets and kept our emerging markets exposure). We also saw the remaining share of mid-cap reduced in favor of more small cap exposure. We remain with a "barbell" core portfolio – about half in large cap and half in small cap as the models expect the market to "broaden".
The * in quarterly is for the trend models. These models are watched daily but they trade infrequently based on readings of where each believe we are in the cycle. The trend systems can be susceptible to "whipsaws" as we saw with the recent sell and buy signals at the end of October and November. The goal of the systems is to miss major downturns in the market. Risks are high when the market has been stampeding higher as it has for most of 2023. This means sometimes selling too soon. As we saw with the recent trade, the systems can quickly reverse if they are wrong.
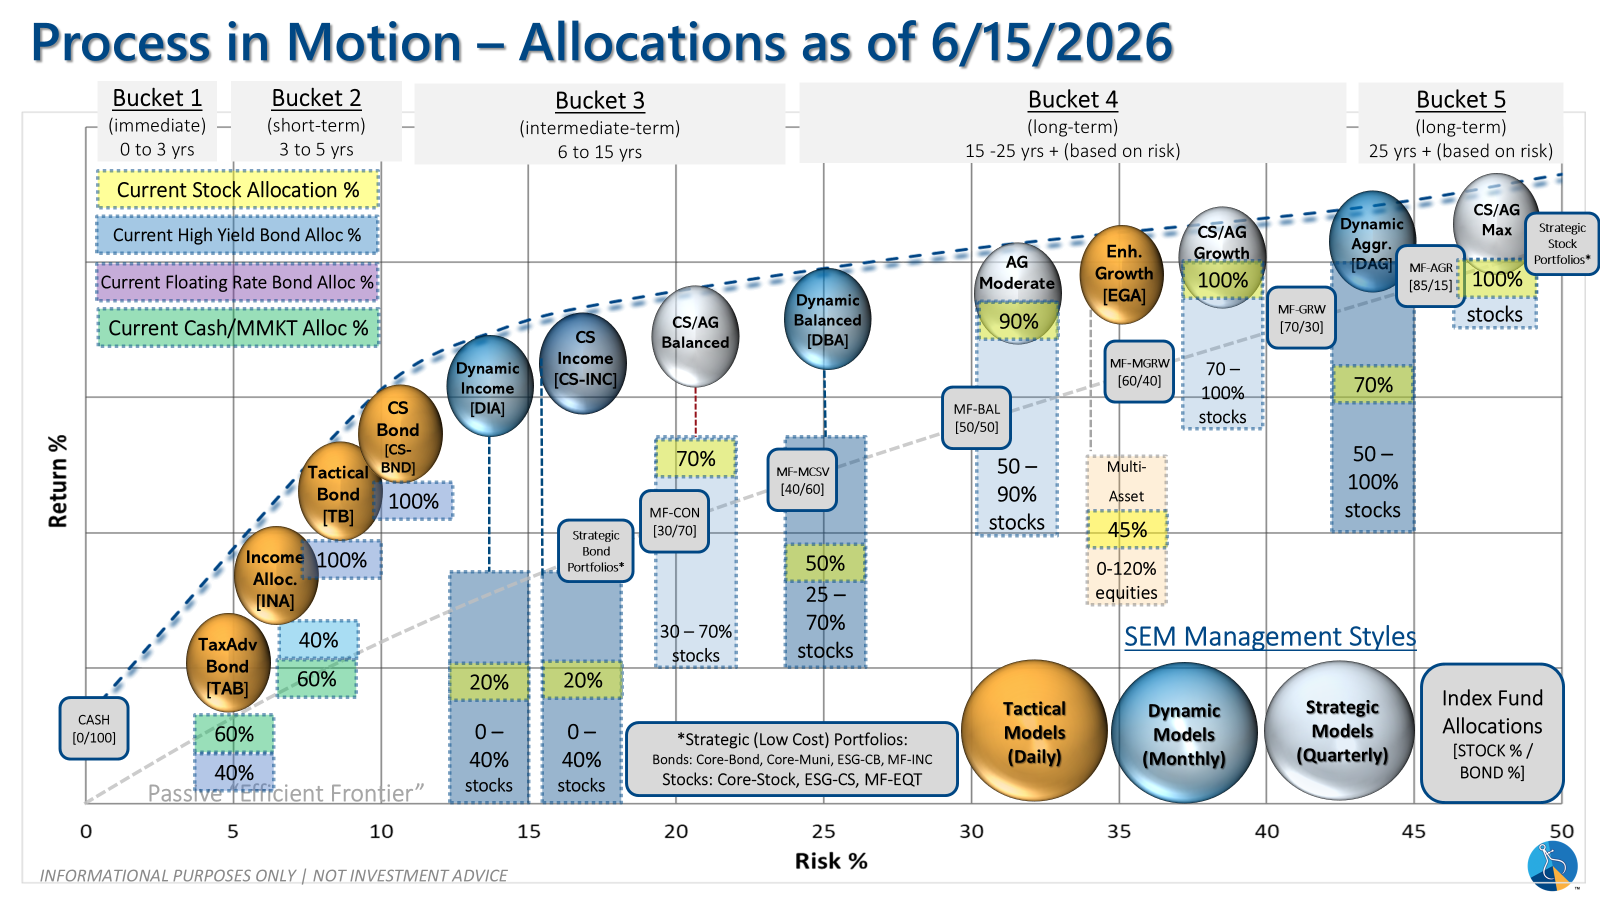
Overall, this is how our various models stack up based on the last allocation change:
Curious if your current investment allocation aligns with your overall objectives and risk tolerance?