
Last March the markets panicked as the yield curve “inverted”. It inverted once again this week causing a sharp sell-off on Wednesday. An inverted yield curve means short-term interest rates are higher than long-term interest rates. This has long been known as a leading indicator of a recession. Bond investors demand higher rates for shorter-term loans because they fear companies will have a hard time paying back their loans during times of economic slowdowns. The inversion in March followed the release of very weak economic data. Investors temporarily forgot about the data following the Fed’s early June comments about moving to a stimulative policy due to weak economic data. They followed this with a rate cut at the end of July.
I warned at the time they cut rates about the Fed’s “horrible track record” in preventing recessions (they keep the brakes on too long and then start cutting when it’s already too late.) I also warned in our 3rd Quarter 2019 economic and market outlook about what would happen if the economy continued to weaken despite the Fed’s rate cut (click here for the 3-minute version or here for the 30-minute detailed discussion.) We are getting a sneak peak at that exact situation as investors panic and gobble up “safe” (relative to stocks) long-term Treasury bonds, which causes the yields to fall faster than the Fed can cut short-term rates (thus inverting the yield curve.)
ILLUSTRATIVE PURPOSES ONLY — PLEASE SEE DISCLAIMER AT BOTTOM OF PAGE
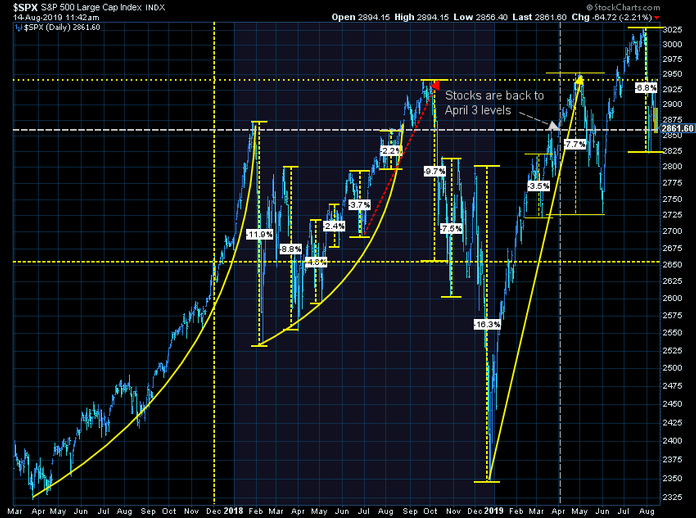
[Note: This article was originally published on March 27, 2019 after the panic of the yield curve inversion. The only updates are in the data and addition of this week’s yield curve inversion. It is interesting to note how stocks are nearly back to the level they were at during the late March yield curve panic.]

Over the past five months we’ve seen all kinds of articles and television segments discussing what the inversion means for investors and the economy. I look at it more of a “chicken and egg” discussion. Does the yield curve inversion cause a recession or does a looming recession cause the inversion? Because the markets and economy are comprised of humans, I think the answer is both.
Short-term rates rising above long-term rates make it very hard for banks to make money. Banks use short-term deposit accounts to make their money on long-term loans. If they have to pay out higher short-term rates they will not be incentivized to make loans. This certainly can create a recession as it resonates through the economy. During the past two market crashes a yield curve inversion seemed to start the process of deflating the asset bubble. Remember, the final stage of a bubble is the “ponzi” borrowing that takes place where corporations (and governments) are borrowing more money to pay back maturing loans. An inversion of the yield curve completely destroys the chances of that scheme working. (This could be a major problem for all the Investment Grade Junk bonds out there. If you haven’t read this piece you really need to add it to your reading list as I believe too many advisors and investors will be shocked when they start to see defaults in the “investment grade” bond market.)
On the other hand, I’ve long argued bond investors are far better people to watch than stock investors. Stock investors are only concerned with being able to sell their stock at a higher price. Bond investors are concerned about the ability of creditors to pay back their loans. If they are growing concerned about a looming recession, they will demand higher rates for shorter-term loans, thus inverting the yield curve.
In the whole scheme of things, it doesn’t really matter to us at SEM whether the yield curve is inverted or what caused it. We follow the data and make adjustments accordingly. We mentioned at the beginning of March how the SEM Economic Model has moved to “negative”. This led to our Dynamic models jettisoning a large chunk of risky assets that will struggle during a slowing economy (small caps in our Dynamic Aggressive Growth & dividend stocks in our Dynamic Income models.) Our other models adjust to the yield curve in other ways. High yield bonds have come under pressure, which led to both Tactical Bond and Income Allocator to dump most of our “junk” bond positions early last week (August 5). Our Enhanced Growth Allocator has had a 20% position for a while in long-term Treasury Bonds, so it too is profiting from the rally in 10-year bonds that caused the inversion.
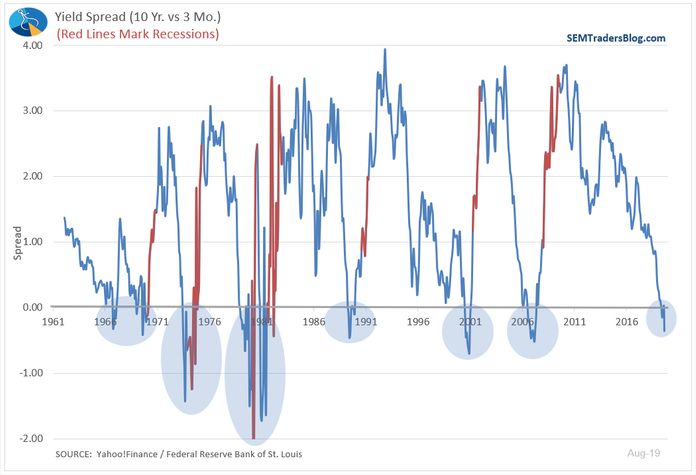
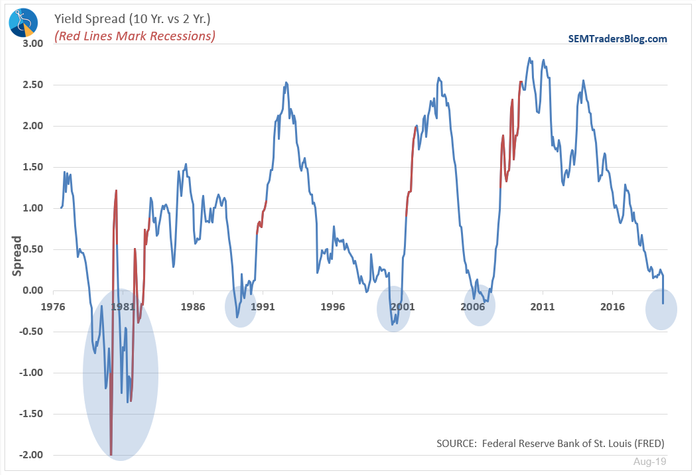
Do you see the theme? At SEM we don’t have to try and figure out why the yield curve is inverting and what it means. We simply do what we’ve always done since 1992 — react to the data. For what it’s worth, the Charts of the Week shows the 10-Year to 3 Month and 10-Year to 2-Year spreads. Whether it’s the 3-month or 2-year spread, it has been one of the best predictors of an upcoming recession. I circled on the charts the times it inverted in the past. Note how both the inversion happened well before the recession and the fact the yield curve had already flipped back to normal during the recession.
ILLUSTRATIVE PURPOSES ONLY — PLEASE SEE DISCLAIMER AT BOTTOM OF PAGE
ILLUSTRATIVE PURPOSES ONLY — PLEASE SEE DISCLAIMER AT BOTTOM OF PAGE
This is just another example of market noise that can cause emotional reactions. As always, if you have any questions about what an indicator really means, let me know.


