

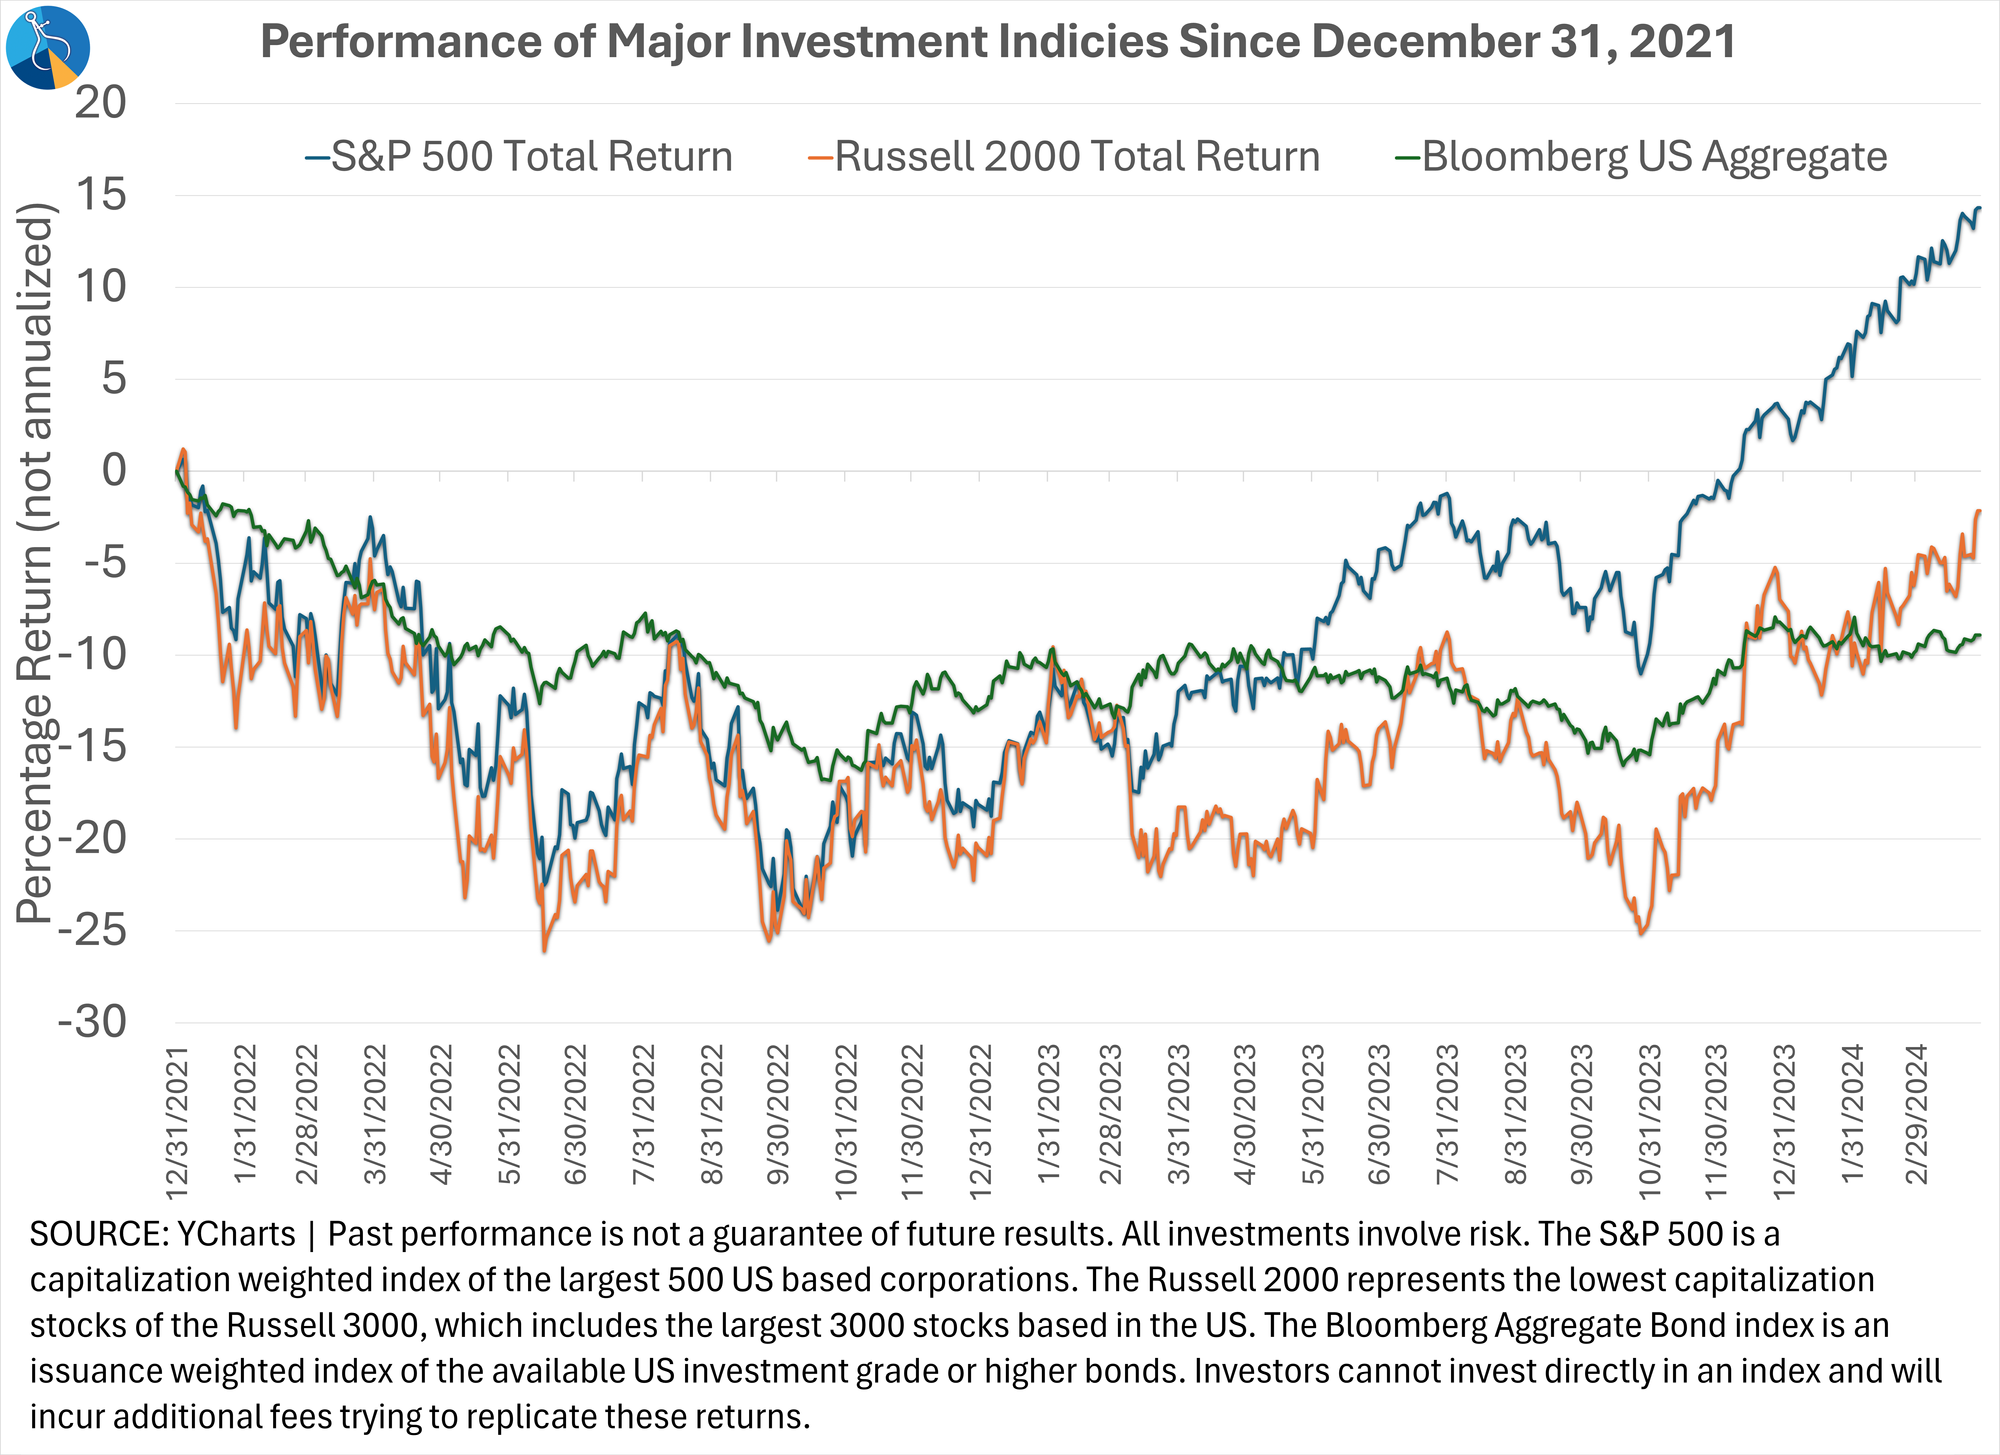
3 Different Markets
The S&P 500 attracts all of the headlines. This index is comprised of the 500 largest US based corporations and is weighted by the market capitalization. As of the end of the quarter the top 10 stocks represented 32% of the S&P 500. 50% of the index is in just 33 stocks.
The Russell 2000 index represents the other end of the spectrum — smaller US based companies. Small company stocks tend to better represent how the overall economy is doing in the US. As the chart on the right shows small caps (the orange line) have not enjoyed the same gains the S&P 500 (the purple line) has the past couple of years.
Bonds (the blue line) typically help reduce risk in a portfolio, but over the past 2 years any allocation to bonds has hurt returns. This is abnormal and likely to revert back to a more normal function as the Federal Reserve winds down their inflation fight.
We are tracking this closely at TradersBlog.SEMWealth.com
Offsetting the Behavior Gap
For over 25 years, SEM has been following the Dalbar Quantitative Analysis of Investor Behavior. It always fascinates us to see the results. Despite decades of education and data illustrating the value of remaining invested for the long-term, each year when the results are released they tell the same story —- the average investor tends to let their emotions get the best of them which keeps them from keeping pace with the returns they should have achieved.
The most striking outcome of the study has been the damage our natural human behavior can do to our bond investments. Over the last 10, 20, and 30 years, the average bond investor has LOST MONEY in what is supposed to be the lower risk portion of their portfolio. As students of investor behavior we know the reason — conservative investors tend to have inherent behavioral biases which lead to poor investment results. At SEM our primary role is to provide investment portfolios which offset these natural tendencies to allow our clients to achieve their financial goals.
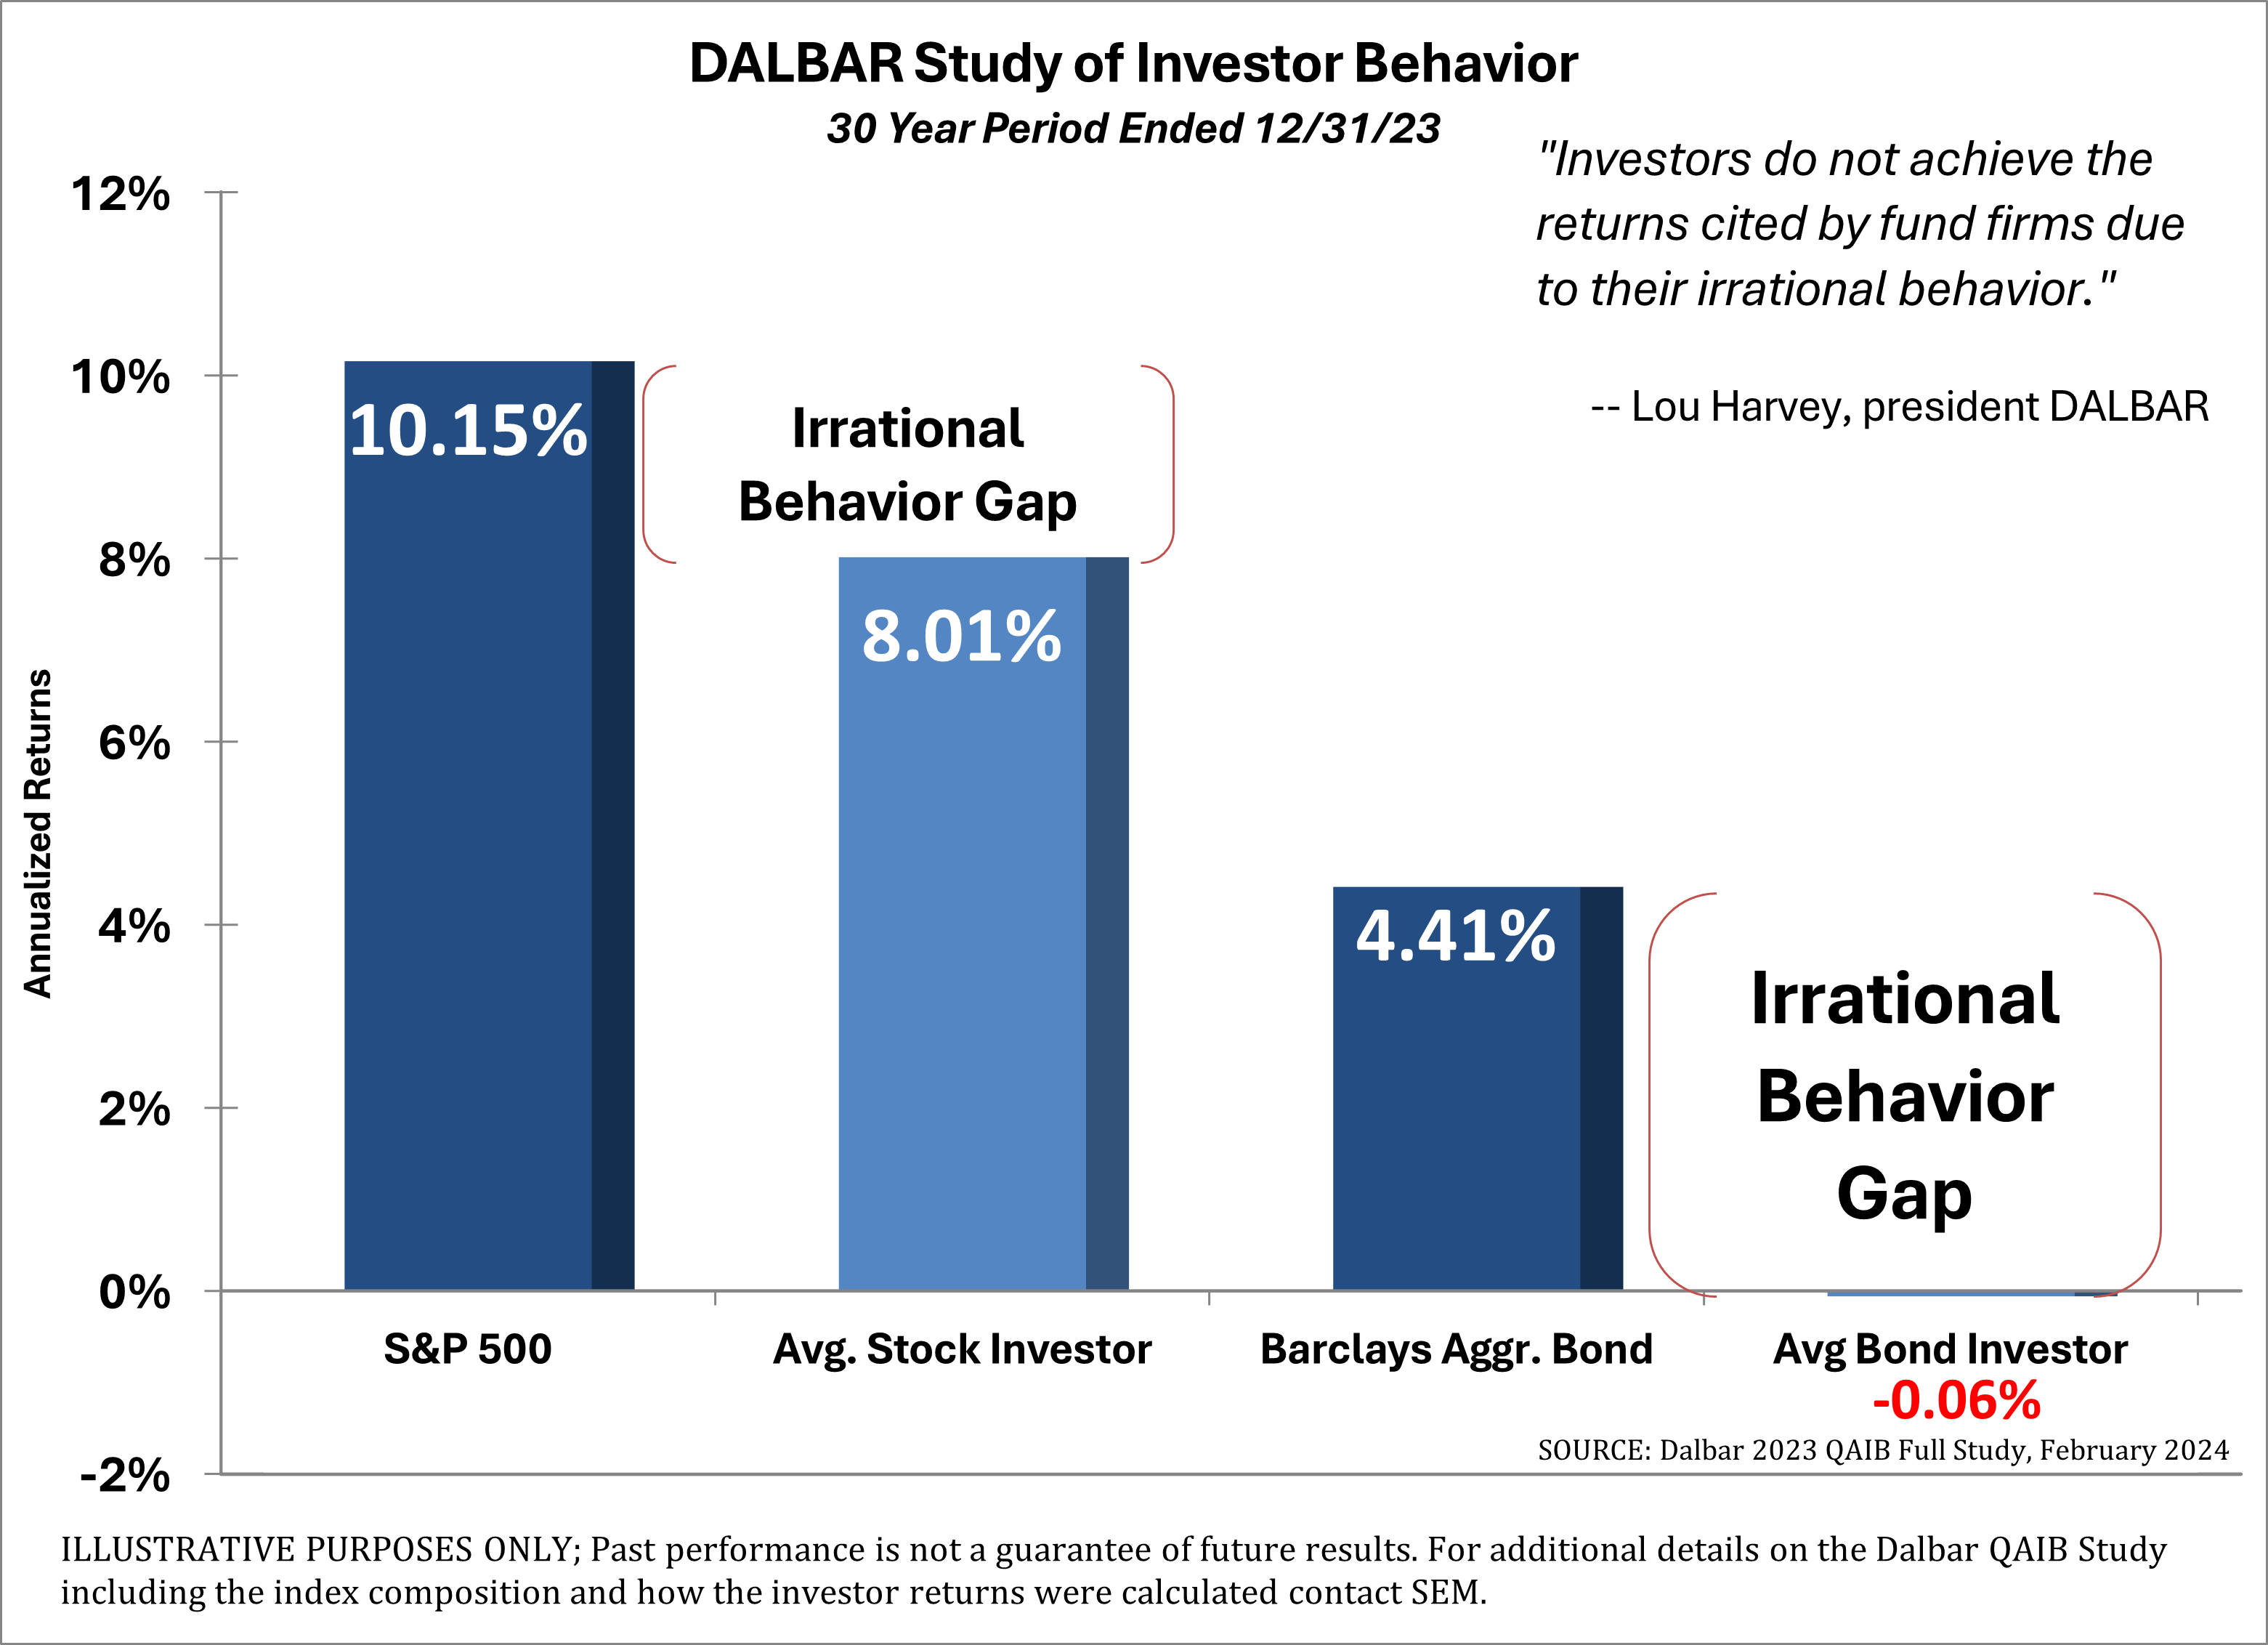
While we cannot post our investment returns in this newsletter, we can say the real-time results for our ‘bond’ investments has been significantly better.
If you’d like to see how SEM would structure your own personalized investment portfolio and how those results compare, go to Risk.SEMWealth.com
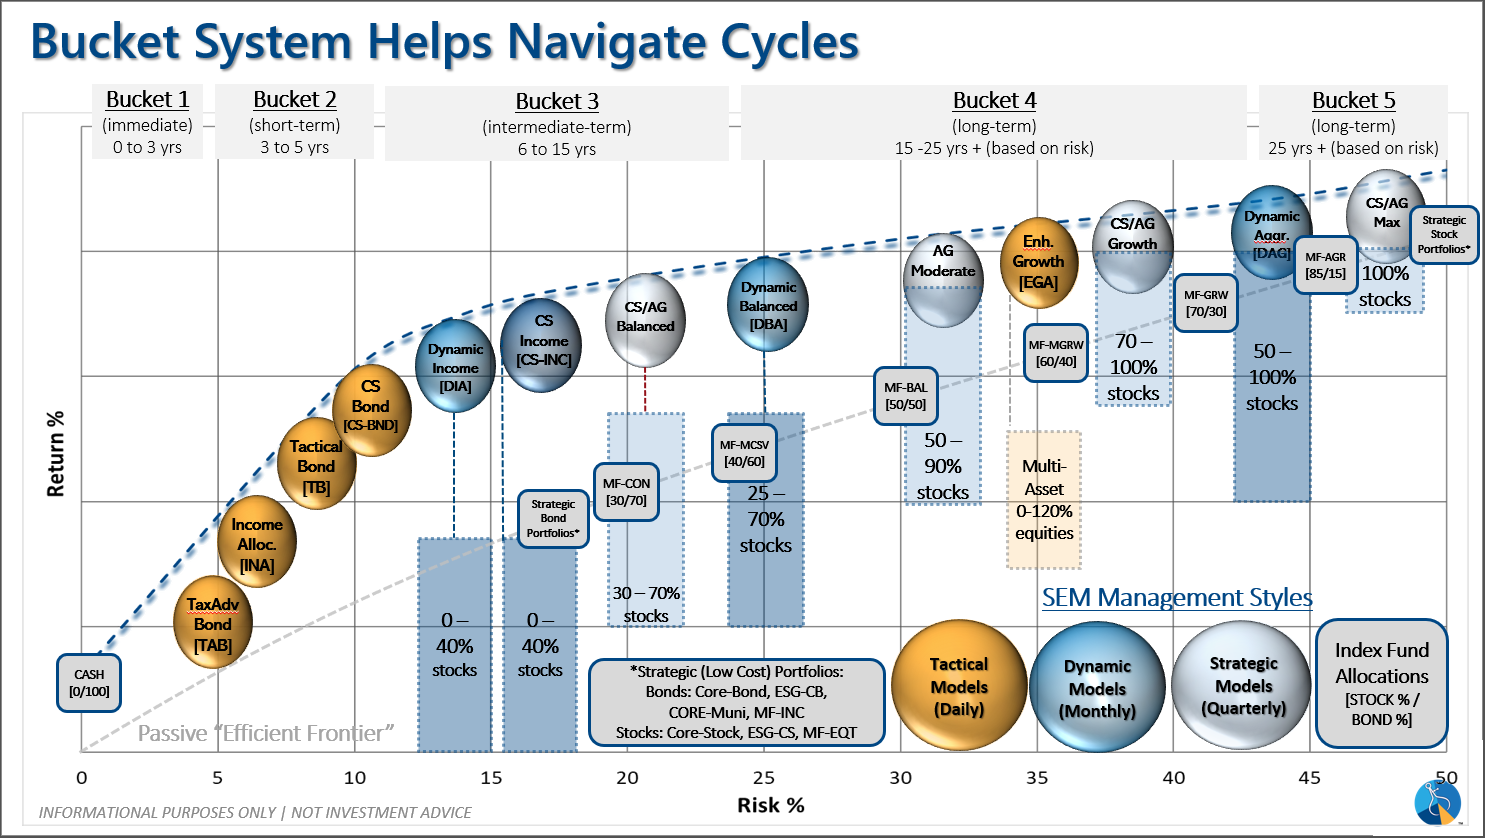
Customized Plan for Unprecedented Times
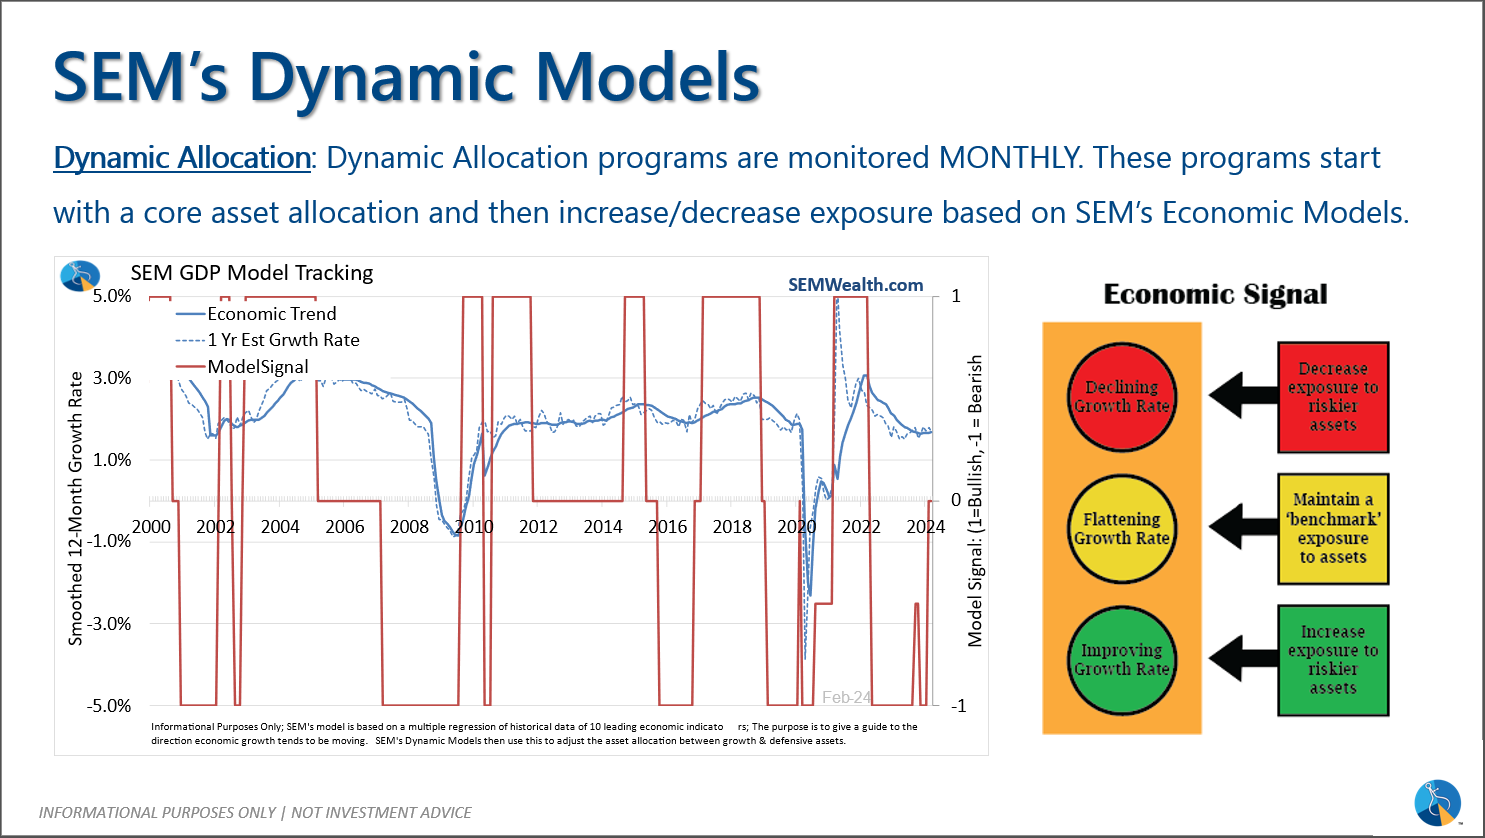
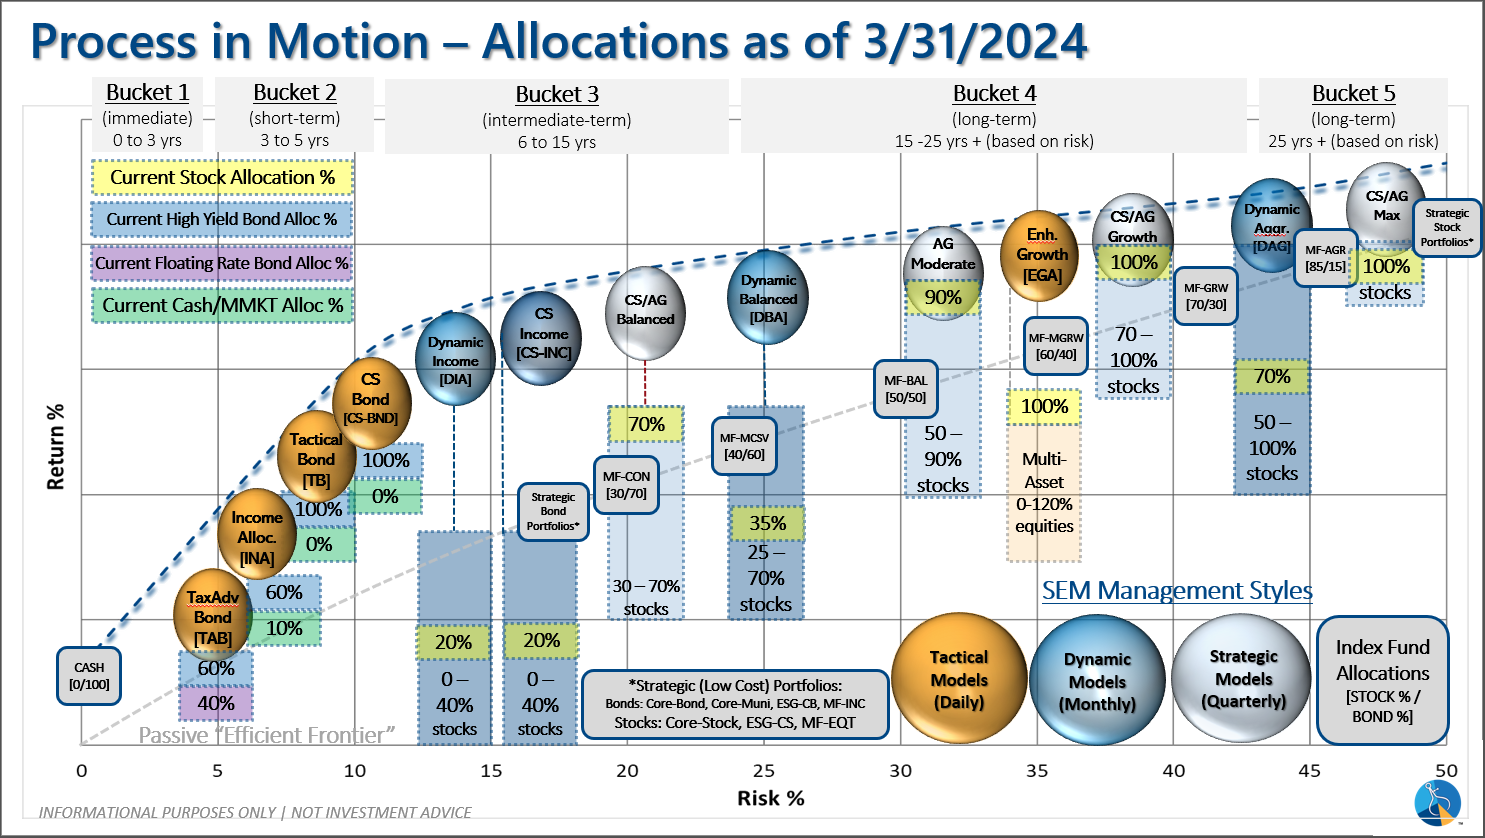
The last 4+ years have had plenty of ‘unprecedented’ events which led too many people to make snap decisions on their investments. At SEM our quantitative, engineered investment approach gives us the ability to adjust portfolios based on the DATA, not our opinions or emotions. We have a wide range of investment models which can be combined to create a portfolio for nearly all types of clients. The chart below shows the various models we have available. If you are at all concerned with your investment allocations, we can take a look at where you are currently and suggest ways to better meet your goals and expectations. To get started go to Risk.SEMWealth.com.
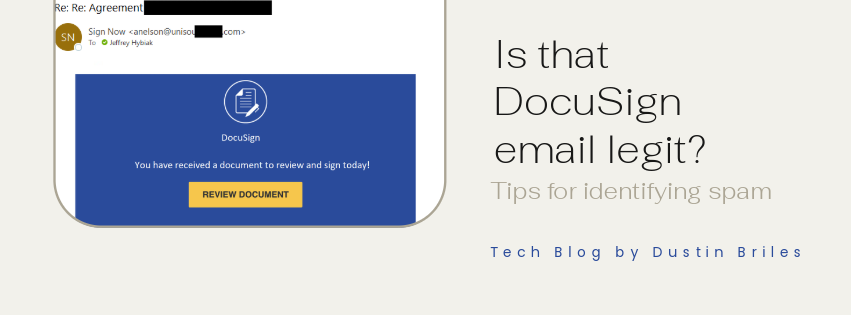
Bonus Content: Fake DocuSign Emails
Fake DocuSign emails are on the rise. Some tips for avoiding DocuSign phishing attacks:
- Confirm the email’s legitimacy by contacting the sender using a different communication method. If you get an unexpected DocuSign from your financial advisor, mortgage lender, etc, don’t reply to the email, pick up the phone, call them, and ask if it’s legitimate.
- Check the sender address. The sender’s email address should almost always end with docusign.net.
- Check the link. The link URL should always go to address whose domain is docusign.net.
Check out the full article for a more thorough rundown on fake DocuSign emails:
What other topics would you like to see covered in the newsletter? Let us know at SEMWealth.com/Contact
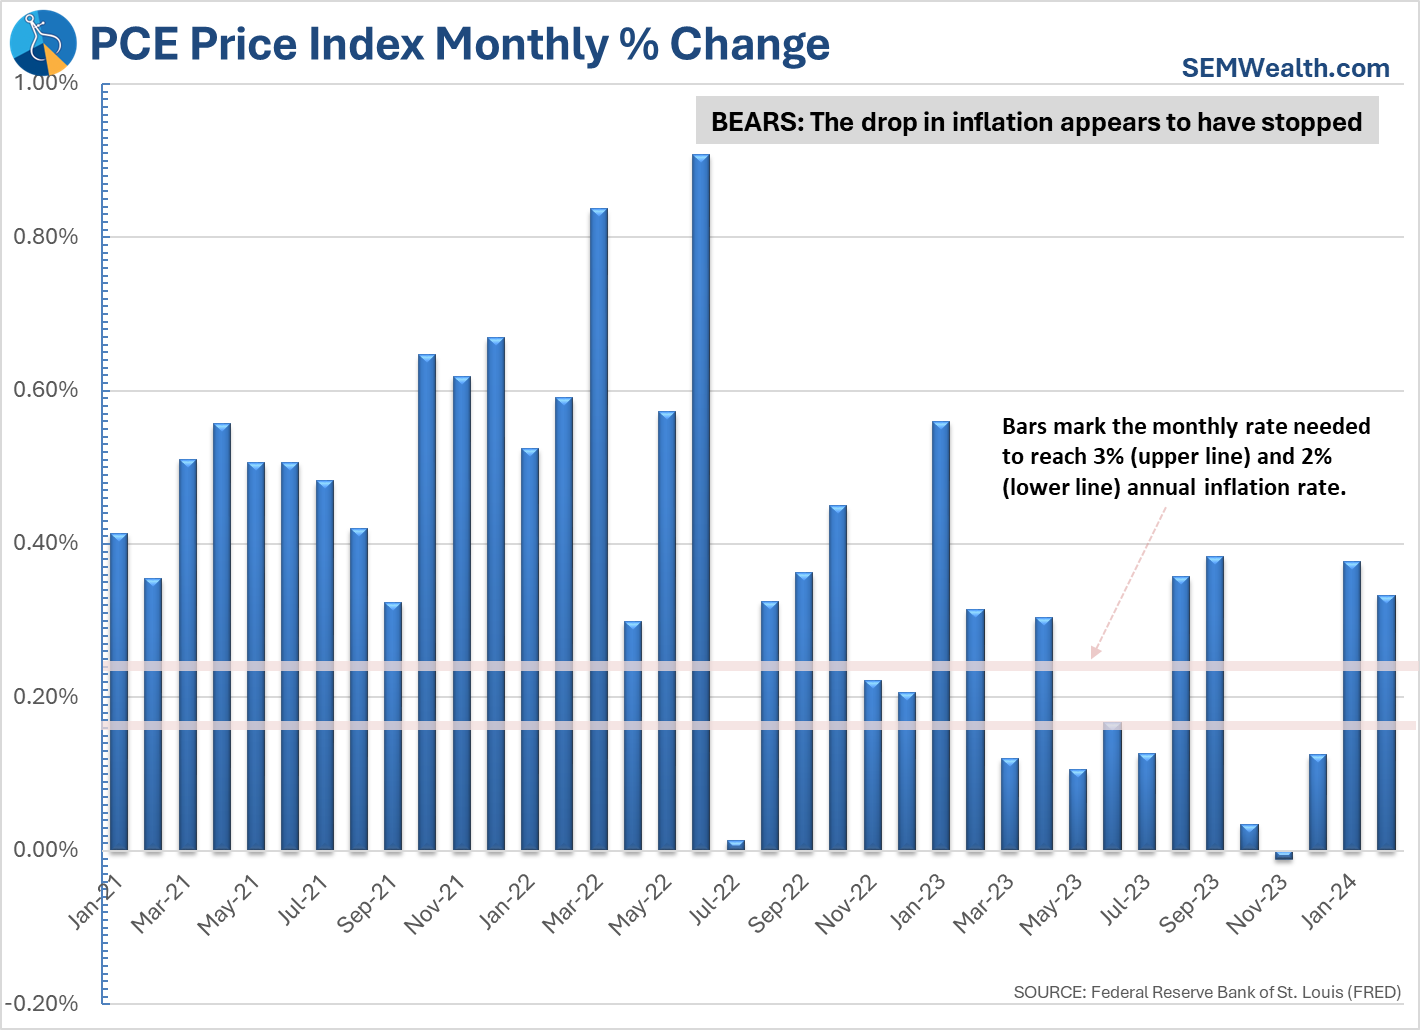
Bonus Content: Which inflation chart matters?
Based on the futures market and the Fed's own forecasts, the Fed is expected to cut interest rates 3 times in 2024. This belief is based on the trust inflation will continue towards the Fed's 2% target. However, recent data has shown inflation is no longer coming down as quickly as it was just 6 months ago.
Whether or not the Fed cuts rates will come down to which of the following charts they believe is more important:
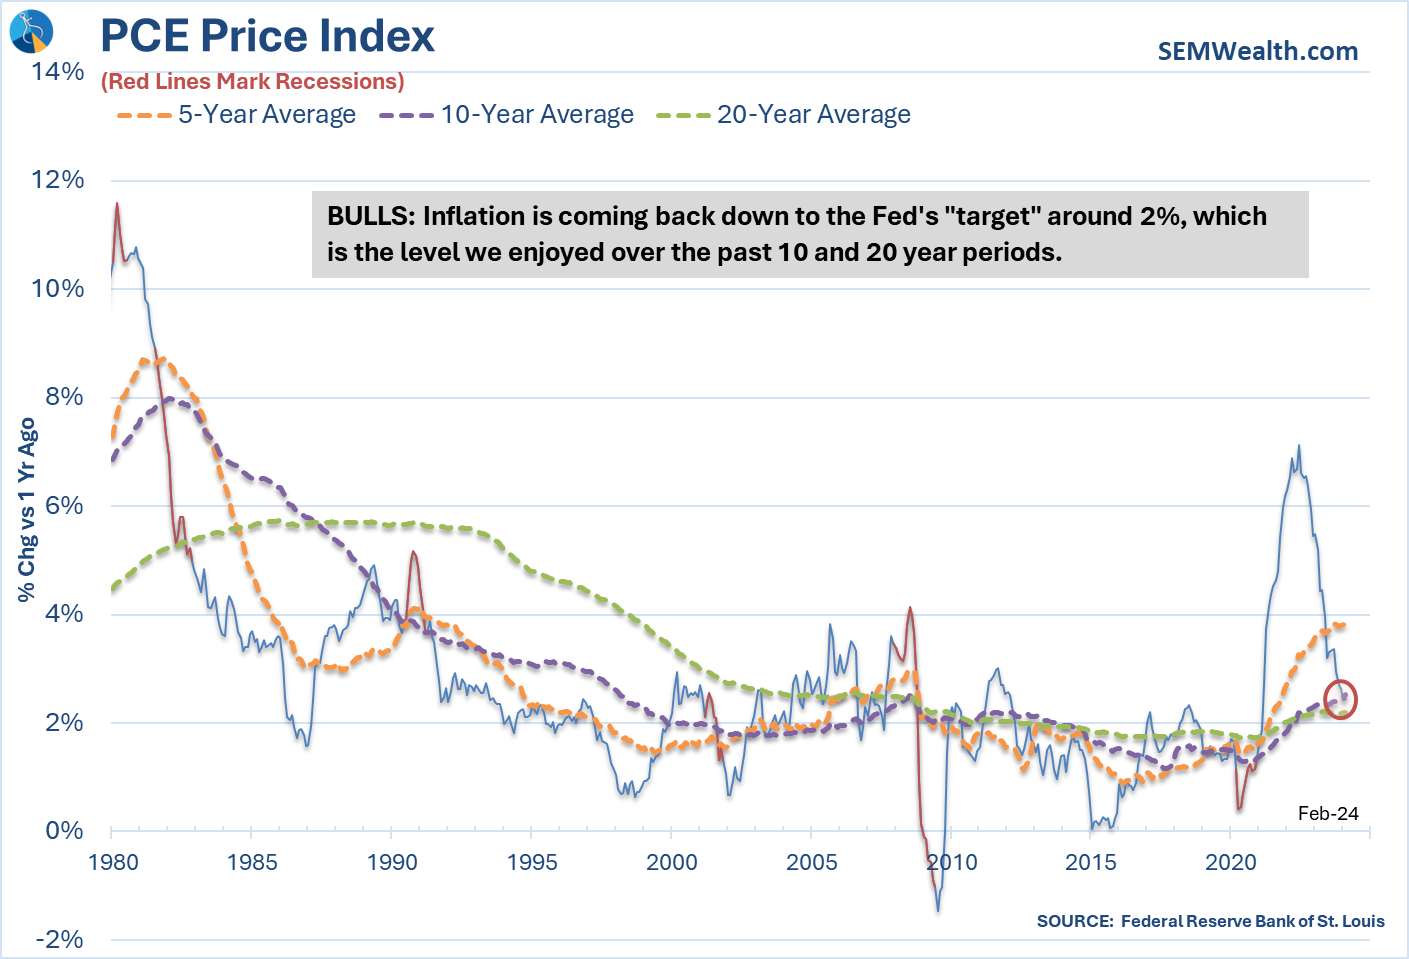
Takeaway for your investments: DO NOT LISTEN TO THE MARKET FORECASTS. Interest rates may be going down, which would be good for bonds, but bad for your savings accounts, but they may also NOT go down, which could be good for your savings accounts and bad for bonds (and stocks).
It's best to stick to your plan and not make adjustments based on what somebody THINKS will happen. For more, see the next section.
Bonus Content: SEM Model Positioning
Every week at the bottom of our Monday Morning Musings blog, we include a summary of SEM's Model Positioning. This is designed more for our advisors who need to follow along more closely or those clients who like to take a deeper look into how SEM is adjusting to the current times.
We thought we'd include the most recent positioning data (from April 1, 2024) as an illustration to the sophistication and detail that goes into every decision made by SEM. More importantly, it shows the broad range of indicators and models we utilize to adjust our allocations based on the DATA, not our opinions.
We spent most of the quarter heavily invested, but that doesn't mean we won't adjust those allocations in the quarter ahead. We've enjoyed some very nice gains the past 5 months, but know from experience it is not the time to lose focus.
SEM Model Positioning
-Tactical High Yield went on a buy 11/3/2023
-Dynamic Models went to 'neutral' 2/5/2024
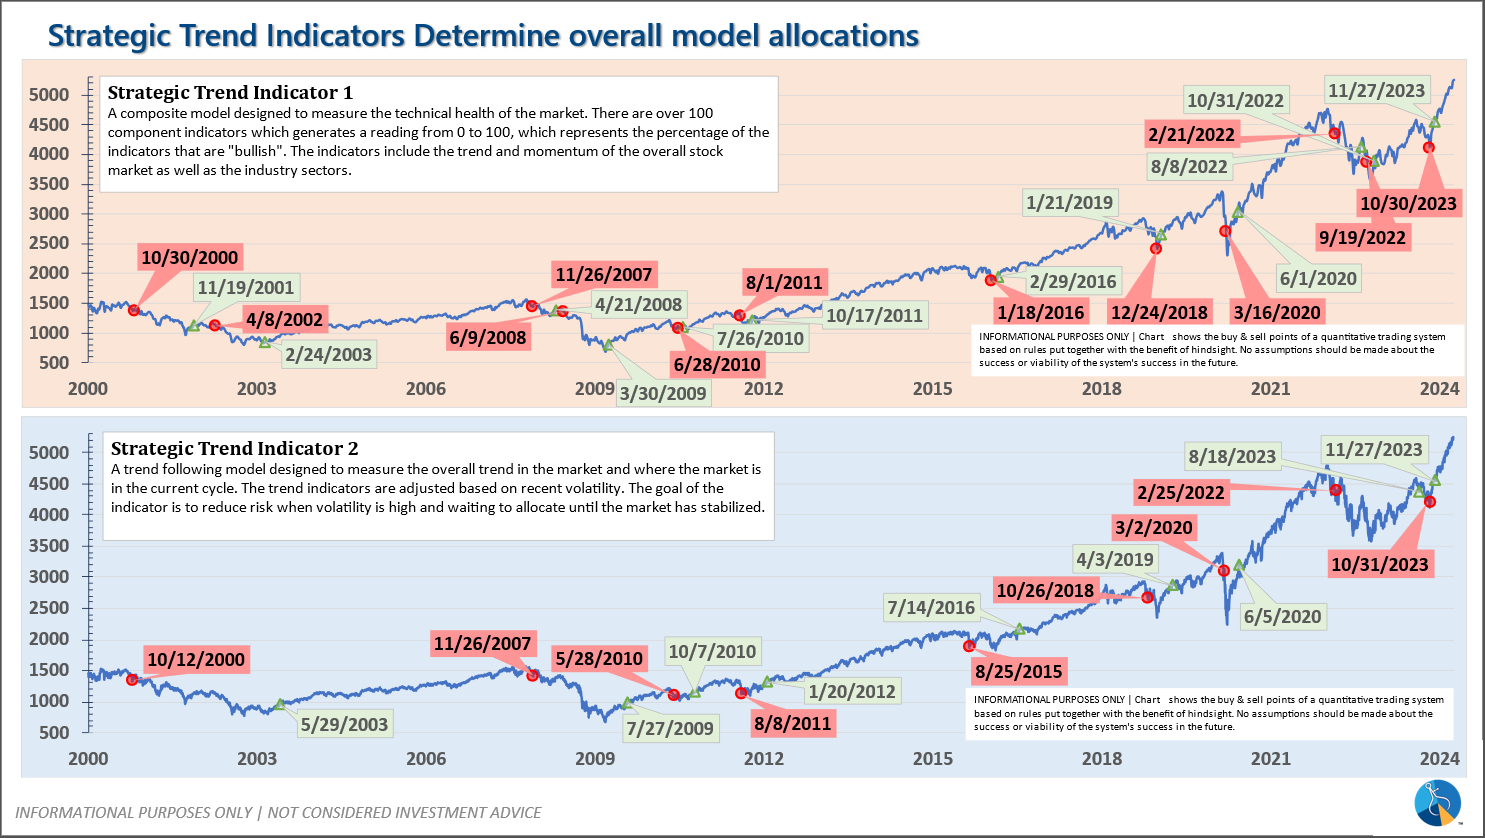
-Strategic Trend Models went on a buy 11/27/2023
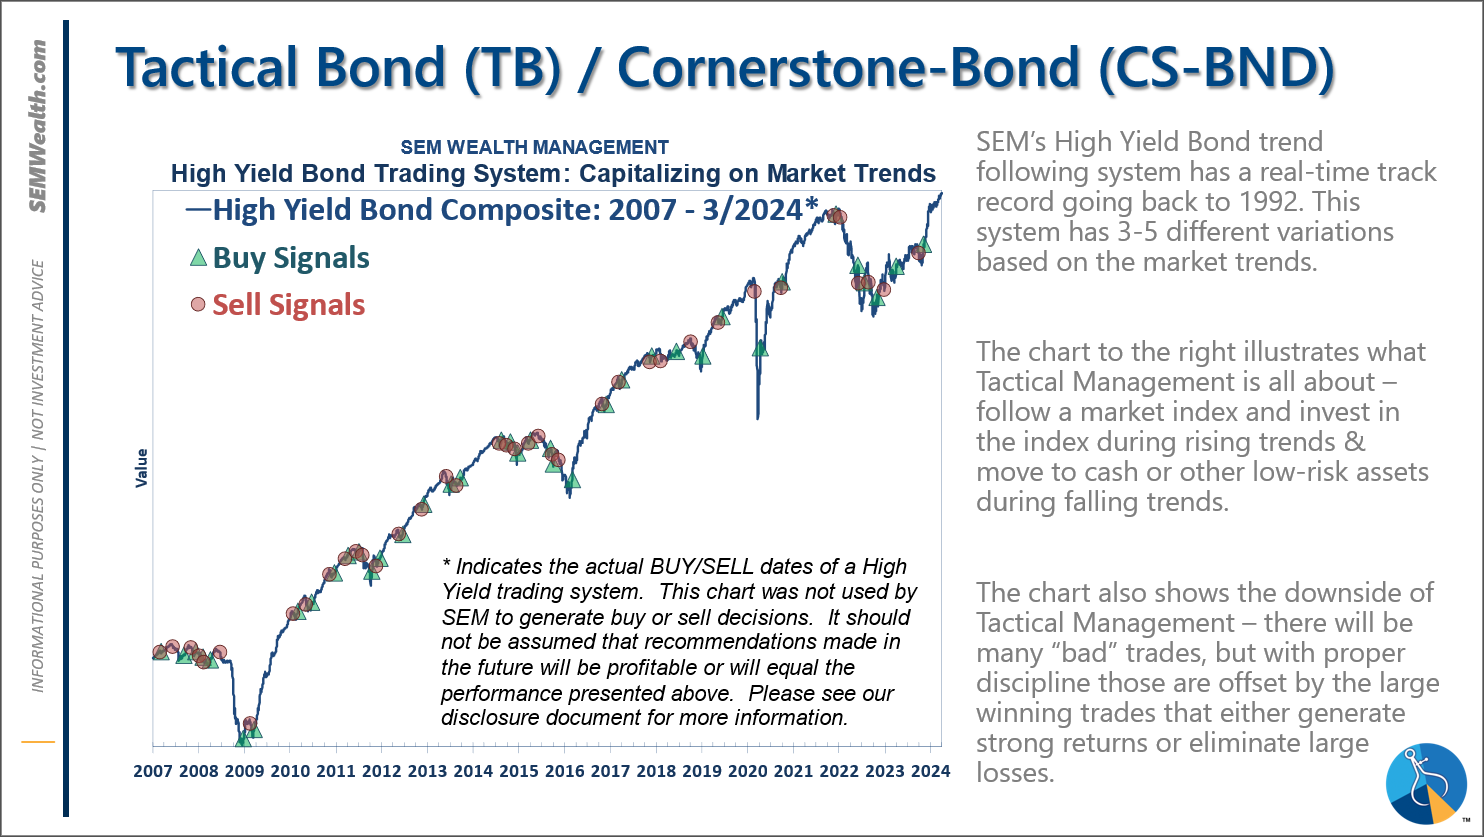
SEM deploys 3 distinct approaches – Tactical, Dynamic, and Strategic. These systems have been described as 'daily, monthly, quarterly' given how often they may make adjustments. Here is where they each stand.
Tactical (daily): The High Yield Bond system bought the beginning of April and issued all 3 sell signals 9/28/2023. All 3 systems were back on buy signals by the close on 11/3/2023. The bond funds we are invested in are a bit more 'conservative' than the overall index, but still yielding between 7.5 -8.5% annually.
Dynamic (monthly): At the beginning of December the economic model reverted back to "bearish". This was reversed at the beginning of February. This means benchmark positions – 20% dividend stocks in Dynamic Income and 20% small cap stocks in Dynamic Aggressive Growth.
Strategic (quarterly)*:
BOTH Trend Systems reversed back to a buy on 11/27/2023
The core rotation is adjusted quarterly. On August 17 it rotated out of mid-cap growth and into small cap value. It also sold some large cap value to buy some large cap blend and growth. The large cap purchases were in actively managed funds with more diversification than the S&P 500 (banking on the market broadening out beyond the top 5-10 stocks.) On January 8 it rotated completely out of small cap value and mid-cap growth to purchase another broad (more diversified) large cap blend fund along with a Dividend Growth fund.
The * in quarterly is for the trend models. These models are watched daily but they trade infrequently based on readings of where each believe we are in the cycle. The trend systems can be susceptible to "whipsaws" as we saw with the recent sell and buy signals at the end of October and November. The goal of the systems is to miss major downturns in the market. Risks are high when the market has been stampeding higher as it has for most of 2023. This means sometimes selling too soon. As we saw with the recent trade, the systems can quickly reverse if they are wrong.
Overall, this is how our various models stack up based on the last allocation change:
Download/Print version of the Newsletter

What is ENCORE?
ENCORE is a Quarterly Newsletter provided by SEM Wealth Management. ENCORE stands for: Engineered, Non-Correlated, Optimized & Risk Efficient. By utilizing these elements in our management style, SEM’s goal is to provide risk management and capital appreciation for our clients. Each issue of ENCORE will provide insight into investments and how we managed money.
The information provided is for informational purposes only and should not be considered investment advice. Information gathered from third party sources are believed to be reliable, but whose accuracy we do not guarantee. Past performance is no guarantee of future results. Please see the individual Model Factsheets for more information. There is potential for loss as well as gain in security investments of any type, including those managed by SEM. SEM’s firm brochure (ADV part 2) is available upon request and must be delivered prior to entering into an advisory agreement.


