
Last week was the 30 year anniversary of the 1987 crash. We heard stories from many people about what it was like back then. Most of the stories included a long-term chart illustrating how the crash was just a minor blip on the long-term chart. The message — don’t panic when stocks go down.
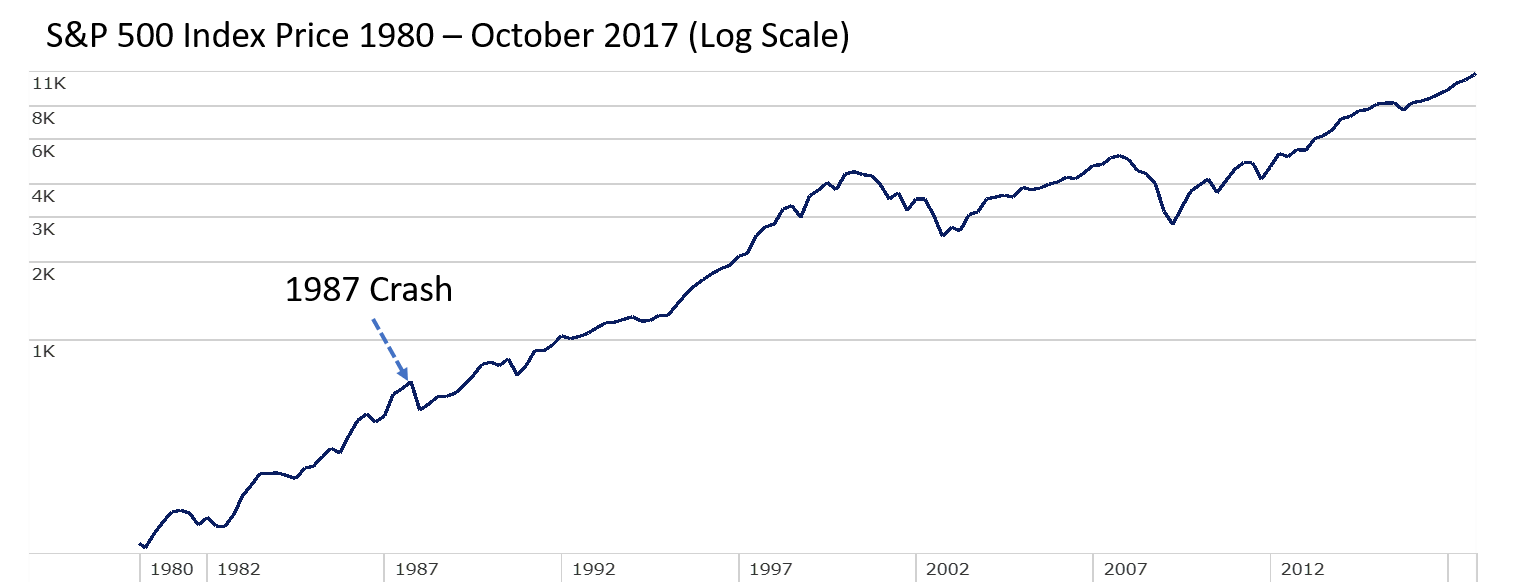
That advice is sound, but difficult to follow. In addition, what made the 1987 crash different than a bear market is the crash came in the middle of a long economic expansion that didn’t end for 3 more years. Even then the recession was quite mild. What is typically far more dangerous to our long-term financial goals is a bear market. The worst bear markets have all occurred inside a recession. This plays with our emotions. Not only are stocks declining, but we are met with dire headlines about job losses, manufacturing slowdowns, declining home prices, etc. The combination of declining portfolio values and the negative headlines causes most people to panic and make adjustments to their portfolio.
SEM’s core purpose is to provide portfolios designed to overcome our emotions, no matter what market environment we are in. Over the past few years we’ve seen far too many investors declare “I can handle a drop of 50%, it always comes back.” Unfortunately our 25 years’ of experience tells us most will not be able to handle it. We heard the same thing in 1998-2000 & 2006 – 2007. Human nature does not change.
SEM’s Scientifically Engineered Models are designed to overcome our natural behavioral biases. With our new partner, Trust Company of America, we are able to create portfolios which include allocations for all types of markets. Our latest offering, the AmeriGuard portfolios provides exposure to the upside of the market while still having some downside protection. When compared to a buy & hold portfolio, this structure helps alleviate some of our tendency to flee when the market declines, but we also know each investor has their own specific risk tolerance.
Measuring risk tolerance becomes the key to long-term investing success. Our portfolios are “risk targeting” rather than return seeking. What we mean is we seek to find the portfolio that provides the highest return at each particular RISK level. Most people do not have the tolerance to handle 100% of the downside of the market, or even 100% of the downside of an AmeriGuard portfolio. Understanding this, we put together a “Moderate” allocation using 4 SEM programs — AmeriGuard, Dynamic Income Allocation, Income Allocator, & Tactical Bond.
While this allocation does not provide 100% of the upside of the market, this illustration shows the value of avoiding the downside.
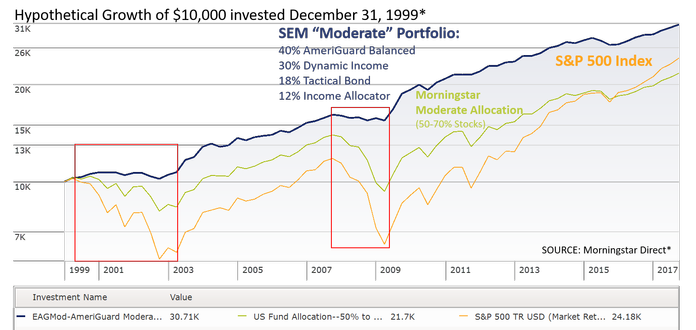
This is one example of the myriad of combinations we can help our clients and advisors create. Having a customized solution allows you to feel like you have complete control no matter when the next crash or bear market occurs.
DISCLAIMER: Maximum SEM fee for the Income Allocator & Tactical Bond allocations is 1.12% per year, 0.75% for Dynamic Income, & 0.50% for the AG Allocation. The default maximum Financial Advisor Fee is 1.12% per year for Income Allocator & Tactical Bond, 0.75% for Dynamic Income & 1.00%for AmeriGuard although some advisors may charge up to 1.12% based on the services they offer their clients. All results assume the default maximum advisory fee was deducted in arrears. ENCORE performance is the blended performance of the standard ENCORE recommendation using the weighted average return (using allocations as of 12/31/15) and the performance of the underlying tracking account. On January 1, 2016, SEM began offering ENCORE portfolios in one single account.If there are less than 10 accounts per ENCORE category, SEM will use the weighted average return of the underlying tracking accounts based on the actual allocation for that month.For a list of historic ENCORE allocations and composite portfolio statistics, please contact Strategic Equity.Periodically SEM may change the allocations of the ENCORE portfolios based on improvements or changes in the underlying investment programs.Unless SEM deems the changes significant enough where the risk/return profile has shifted, SEM will not notify the client.If any significant changes to the risk/return profile occur due to SEM allocation changes, the clients will be notified and given the opportunity to change ENCOREs.ENCORE performance beginning in 2016 represents the actual allocations for the ENCORE portfolios for that month. ENCORE Portfolio’s are a blend of Strategic Equity programs. Performance shown is a blend based on individual program performance and is rebalanced monthly. Rebalance in actual client accounts occurs when any of the individual programs in that ENCORE are realigned, which may be more or less frequent. Results prior to June 30, 2001 for INA and TB programs are model performance results achieved by Merit Advisors, a sub-advisor to SEM. Performance results from June 2001 to December 2003 were subject to services provided by Merit Advisors and represent a single High Yield Bond trading system. Merit provided the buy & sell signals and SEM chose to accept or reject the signal, selected the fund(s) to use and executed the trades.
Performance since June 30, 2001 represents the results of SEM tracking accounts. Results after 2003 for INA reflect multiple trading systems developed by SEM. Results prior to May 1, 2016 for DIA are not actual, they are HYPOTHETICAL model performance. From July 1, 2001 to December 31, 2015, performance results are the asset weighted average performance for each custodian representative account within each program. If custodian represented less than ten percent of the total program assets, results may not be included. Beginning in 2016 results are an asset weighted composite of all accounts in the program for the entire period.For more details on the composite construction, please contact Strategic Equity. Individual client results may vary from the performance of the composite. Some or all of the following may occur: There could be cash flows into or out of the account. The advisor could select a different fund in the same asset class for different client accounts. Different custodians could have different fund availability, annual costs, and fees. The advisor may use different trading systems or system allocations at different custodians. Clients in the same program can be charged different fees.
Prior to June 1, 2017 results for the AmeriGuard portfolios are the result of the investment models being utilized in the AmeriGuard portfolios. These models look at the overall trends in the market and the various asset classes using mathematical formulas. From there they allocate in the available asset classes at American Funds and Vanguard. While the use of mechancial models removes most subjectivity, it should not be assumed the past market environment will be repeated, which could cause the models to have significantly different performance in the future. There are inherent limitations in HYPOTHETICAL results. Actual mutual fund prices are utilized where available.
Where HYPOTHETICAL results were obtained using the actual indices prices, mutual fund expenses are approximated using expense ratios of the funds. Results do not include the benefit of money market dividends used when the active systems are on defense. Real time results WILL deviate from the HYPOTHETICAL results due to several factors such as mutual fund expenses, differences between the time the trade was placed and the actual market closing price, tracking differences between the fund and the index, the fact that material economic and market factors might have an impact on the investment advisor’s decision making process, and the fact that tested results occurred in an unusually strong market environment. Advisor reserves the right to add or replace trading systems during real time without restating model performance results if they believe the return/risk profile will not change substantially. All accounts within a program at a specific custodian are managed in a similar manner. Beginning on June 1, 2017 results are an asset weighted composite of all accounts in the program for the entire period.For more details on the composite construction, please contact Strategic Equity. Individual client results may vary from the performance of the composite. Fee schedules are available in Strategic Equity Management’s Firm Brochure or upon request. Benchmark results were provided by Morningstar or the index provider and include dividends unless otherwise indicated. Past performance is no guarantee of future results. There is potential for loss as well as gain in security investments of any type, including those managed by Strategic Equity Management, Inc.
The investments discussed in this presentation may not be suitable for all investors. Strategic Equity Management’s Firm Brochure is available upon request.
Benchmark Descriptions and Comparison to SEM Programs
There are material differences between the programs Strategic Equity Management manages and the benchmark selected that impact performance. The objective of the benchmark is to represent a passive investment in similar asset classes to this program. The objective of all SEM Portfolios is to provide benchmark type returns with lower volatility over a full market cycle. The returns in this program should be expected to vary from the returns of the benchmark due to our active management style, which utilizes money market funds and inverse funds or sub-accounts with the goal of reducing volatility. The benchmark for each Platinum portfolio is designed to represent the risk & return objective of the portfolio.
The following is a description of the benchmarks used in the performance materials:
S&P 500 Index: The S&P 500 is a capitalization weighted, unmanaged group of 500 stocks as selected by the Standard & Poor’s Publishing Company. They are usually the 500 largest companies in terms of market capitalization and are chosen to represent the entire market’s value. The S&P 500 is used by many institutional investors as a performance benchmark representing the “stock market” return.
Morningstar Allocation Category: The Morningstar Allocation Categories are designed to match the objective asset allocations in the name of the portfolio. Each allocation portfolio includes funds whose portfolios match the equity allocation range listed. The balance of the portfolio is invested in bonds or cash.
There is no representation made as to the future results of SEM’s programs or if they will be profitable.


