
When we are facing unknown situations our brains will try to find similar situations and then use it to make decisions. This is called representativeness bias. It can be especially dangerous because we may miss some critically different situations that render the past situation useless for decision making. This applies in all walks of life, but I see it most commonly used in investing.
I warned about this bias in early 2017, shortly after President Trump took office. I saw too many people who saw an (R) behind his name and assumed it was smooth sailing for stocks and the economy. We've certainly saw some of that at times, but as I said in the video, if I was pushed to pick one president to use as a proxy it would have been Andrew Jackson due to his polarizing stance on many issues. In other words, it's a wild card. If you're interested, here's the link to the video.
 Jeff Hybiak, CFA
Since March, on my calls with advisors and clients I've been pressed to give some sort of an outlook. Since my "expertise" is more in technical analysis and not in market forecasting, I've relied on our models and traditional technical rules. Most of those follow the trend with a heavy focus on the underlying volume and breadth of the rally (how many stocks are participating in the rally). This allows us to make shorter-term decisions and reserve the right to adjust the outlook as the data changes.
That said, when pressed I said my best guess would be we would see several phases. Panic – Relief – Pause – Reality
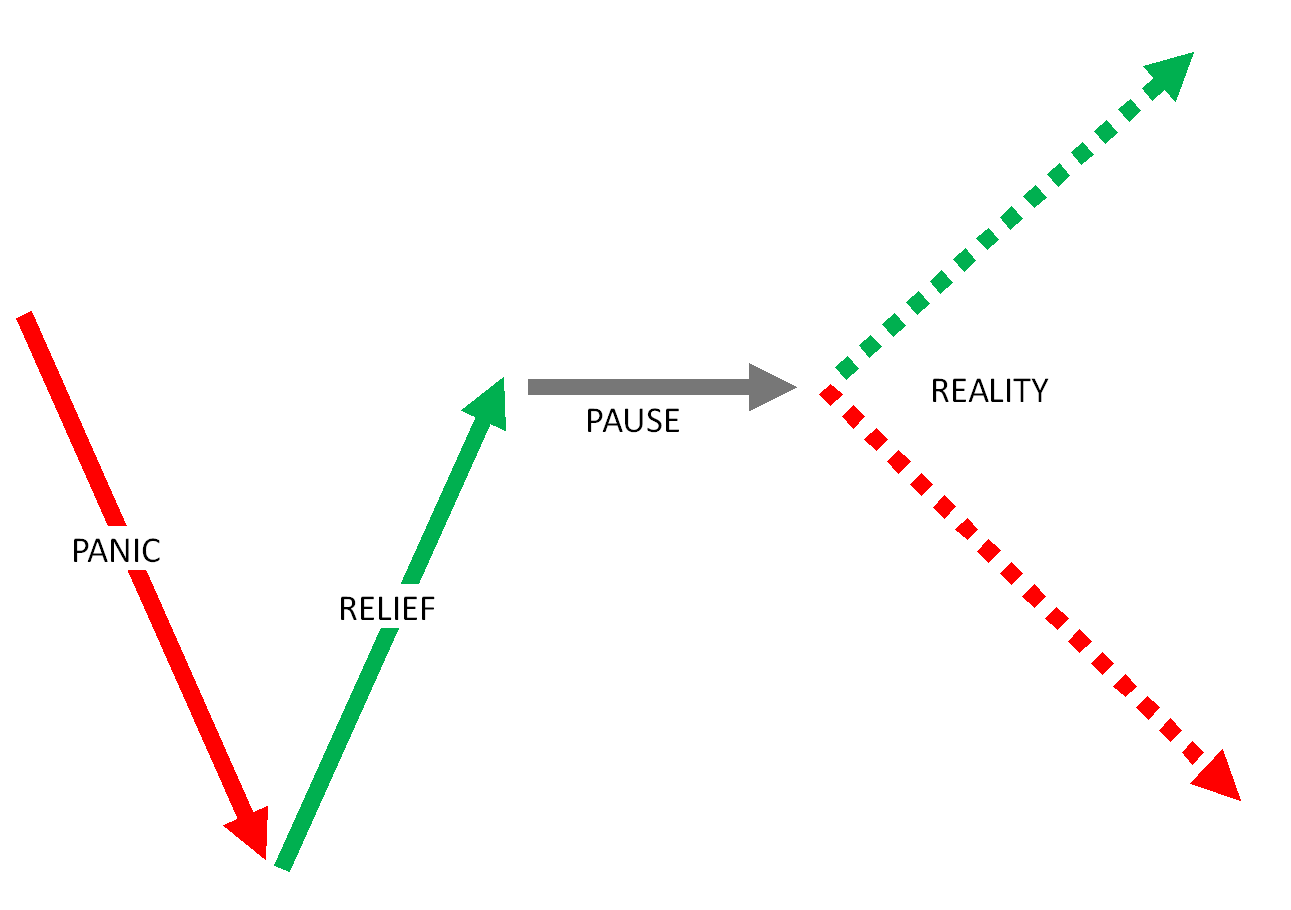
This is a very common pattern. Markets are controlled by humans and humans react in predictable patterns. When the economy was shutting down everyone feared the worst. As the Fed and Congress jumped in with astronomical stimulus that had never been seen before, the virus spread slowed, and states began reopening relief set in and we've enjoyed a steady climb back near the old highs. That momentum has waned so most have hit pause as we move into the 3rd quarter and start assessing the longer-term damage.
The next move will be based on the reality of the situation. Was there long-term damage that will be a drag on the economy and the stock market for the foreseeable future or was the Fed and Congressional stimulus enough to overcome any failed businesses, lost jobs, damaged consumers, and defaulted loans?
Time will tell. At the risk of enabling your own representativeness bias, since the outset when pushed I've said if I had to pick one market that could resemble this one it would be 2001-2002. We had an already weak economy get hit with an unexpected exogenous shock. This led to massive stimulus from the Federal Reserve and Congress. Americans came together and vowed to get the economy going again. This led to a huge snap-back in stock prices in the face of business closures, high unemployment, bankruptcies, and defaulting loans.
The recession officially ended in November 2001, but 2002 was the worst of the 3-year bear market. It took out the lows of September 2001 by June. Before the S&P 500 bottomed in October 2002, it was down 30% for the year.
So what happened? Even though the economy was technically "growing", there had been a significant STRUCTURAL shift in our economy. The stock market had assumed a return to "normal" in 2002, but that simply didn't happen. The economy grew by 2% in 2002. The problem was it had been growing at a 3-5% rate prior to the recession. It wasn't until the "new normal" was priced into stocks that we finally reached a real bottom in the market.
The market followed a similar pattern to the one I outlined above. Panic – Relief – Pause – Reality
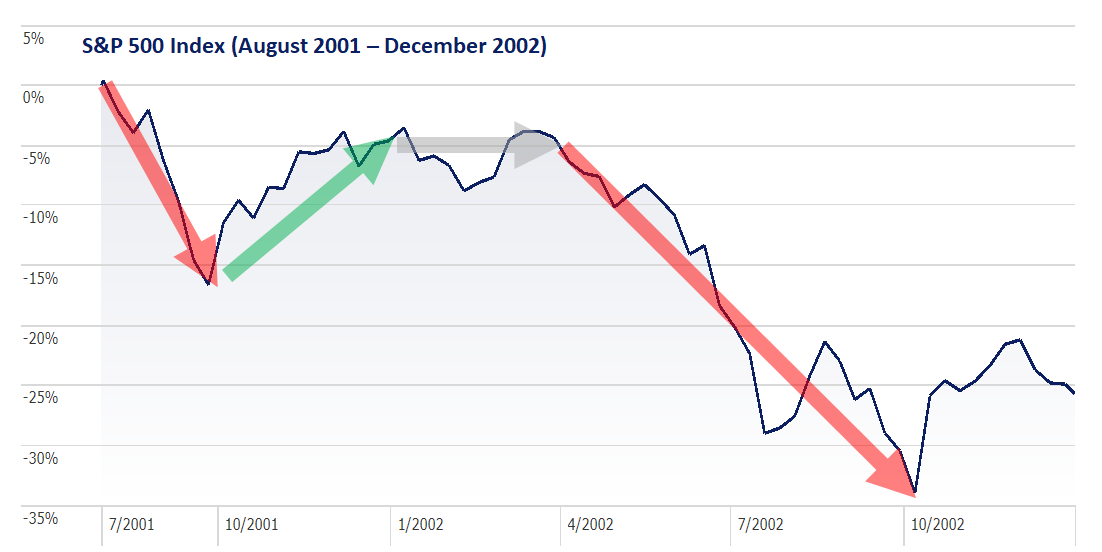
Ned Davis Research in their blog earlier this week showed a chart overlaying the 2001-2002 market with our current market. So far, the pattern is holding.
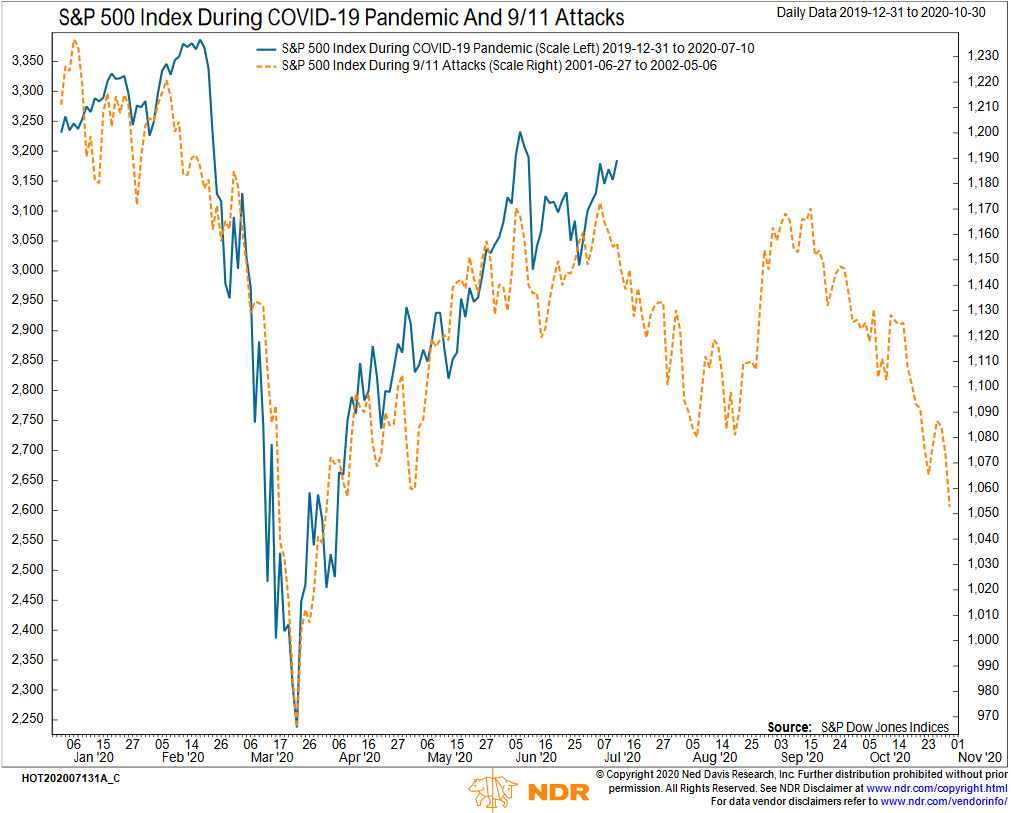
There are certainly some striking similarities between the economic environment of 2001/2002 and 2020/2021. There are also obvious differences. I have no idea how any of this will play out. That's the beauty of working with SEM – we don't have to guess. Right now we are as close to fully invested as possible. This allows those of you still banking on a "return to normal" to transition to a portfolio which is much more adaptive to the current environment. I'd love to see us return to normal, but we don't have to have that happen to be successful.
Think about it – if our "reality" is "everything is fine", we're already positioned to enjoy the returns that come with that environment. If our "reality" is "there is significant STRUCTURAL damage" and "prices need to adjust lower", we have proven time and time again our ability to move out of the highest risk assets when appropriate.


