
The first quarter generated plenty of news and market fluctuations. We saw some of the worst losses as well as the biggest gains since 2020. Long-term bond yields jumped nearly 1% and the Federal Reserve finally decided it was time to pull back their COVID stimulus. Sentiment plummeted in the middle of the quarter, but by the end of March, the market was acting as euphorically as they did to end 2021. We even saw the "meme" stocks such as GameStop and AMC triple and quadruple in price.
Is this the end of the correction or was the big rally to end the year a "spring of deception? I just survived my fifth winter in Virginia after moving from Arizona. I think this list both accurately describes the weather in Virginia, but it could also describe the stock market cycles at times.

Weekly Talking Points:
- The Russia-Ukraine conflict seems to have taken a back seat in terms of market impact, so the focus returns to inflation, economic growth, interest rates, and what the Federal Reserve will do next. Fundamentally and logically, this should be viewed as a bad thing unless you believe economic growth will be BETTER than it was in 2021 (see below for what our economic model says).
- Taking an even bigger step back, with Fed action puts the economy moving towards a place of standing on its own. The last time the economy didn't have Fed and Congressional stimulus was 2019. At that point the economy was heading towards a sharp slowdown in growth.
- The only thing that could drive stocks higher is more euphoria. Stocks can go up longer than we think is possible, but it shouldn't embolden you into believing they will never go down. The market is well overdue for a real bear market (35% drop in prices which lasts 18-24 months).
- Your investments should align with your financial plan, cash flow strategy, investment objectives, risk tolerance, and overall investment personality. If you made changes in the past year simply because you wanted to make more money, now is a very good time to shift back to where you were before that jump. If you are already in alignment with those items, SEM's models have already taken the steps to adjust to what could be a very difficult environment.
- The real wild card is interest rates. The free market has already raised rates on long-term bonds significantly (more than 1% in 3 months). The Federal Reserve has only adjusted short-term rates by 1/4.%. While recency bias has many people believing long-term yields are going to continue to rocket higher, if the Federal Reserve begins to take more aggressive action on short-term rates, we could see long-term rates fall. Be very careful making adjustments to your bond portfolios based on recent moves!
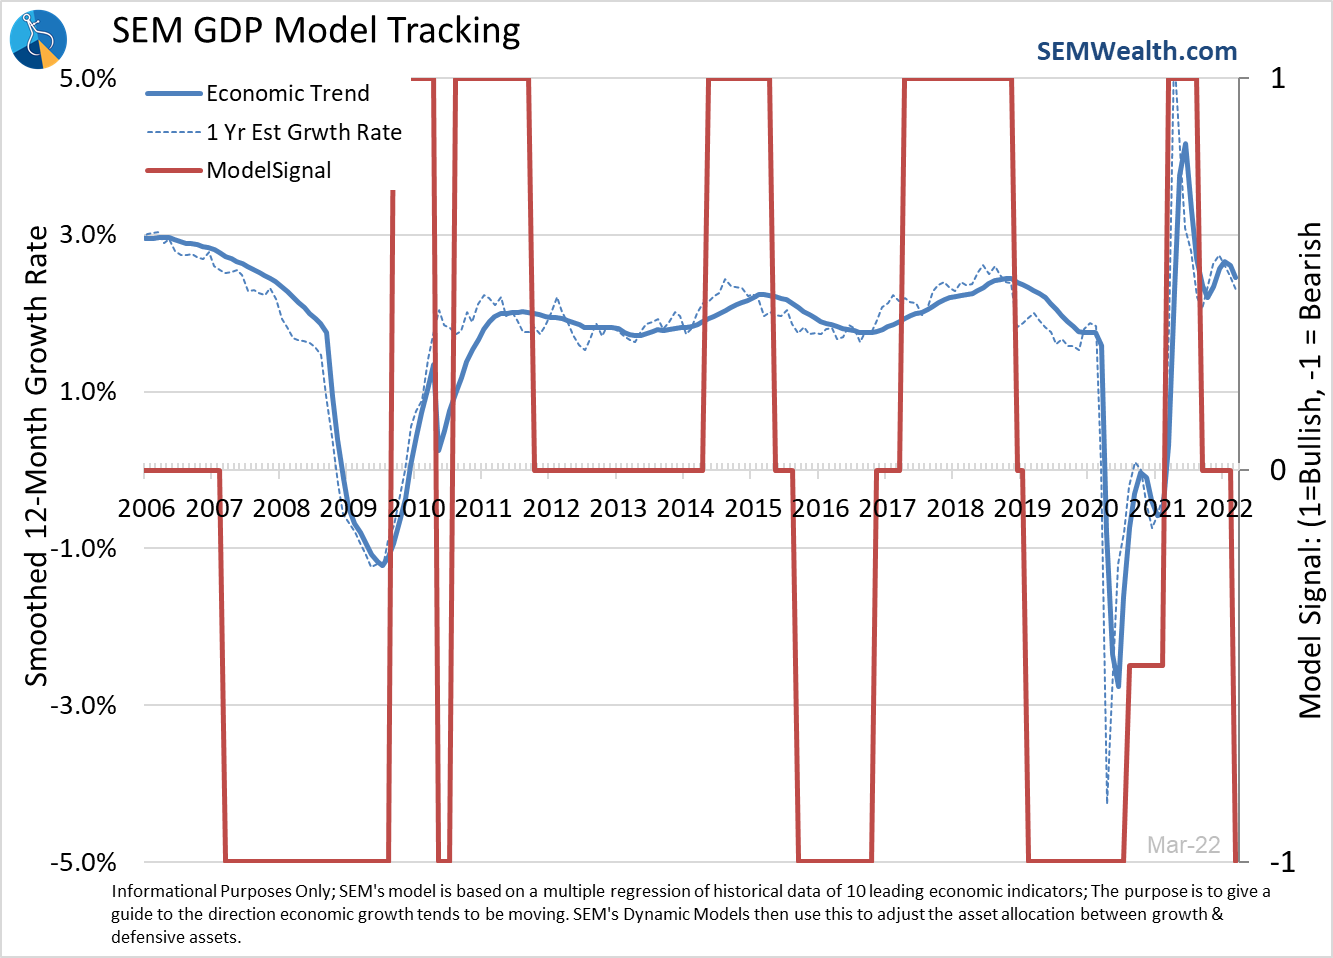
Economic Model Turns Bearish
We've been watching this model closely since October. We've warned that subjectively it was unlikely we'd see a resumption of strong economic growth, we let the model decide for itself. It has been "neutral" or in "transition" since the beginning of October. The February and March data updates were enough to shift the model to the negative. This doesn't mean a recession is likely, but it does mean the model is predicting "below average" growth. This historically is bad news for stock prices.
The model chart hides some of the inner workings as we saw unprecedented drops followed by unprecedented jumps. As we dug deeper into the actual indicators, it appears the automatic "smoothing" did as good a job as we could expect.
This table shows the trends of the various leading indicators in our model:
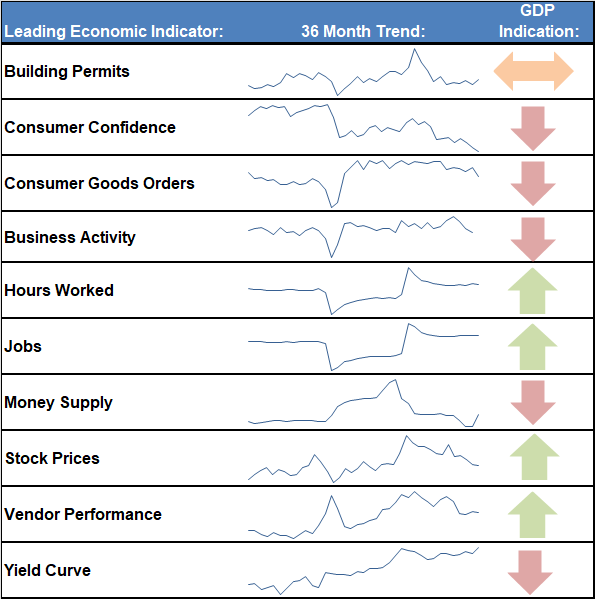
Five down, 4 up and one "flat" was enough to throw us to a "bearish" allocation. As with all of our models, if the data reverses, we will chalk up the "loss" and move back the opposite direction. This is not based on any of our opinions, but simply data and how it historically reacts based on the various economic and market cycles.
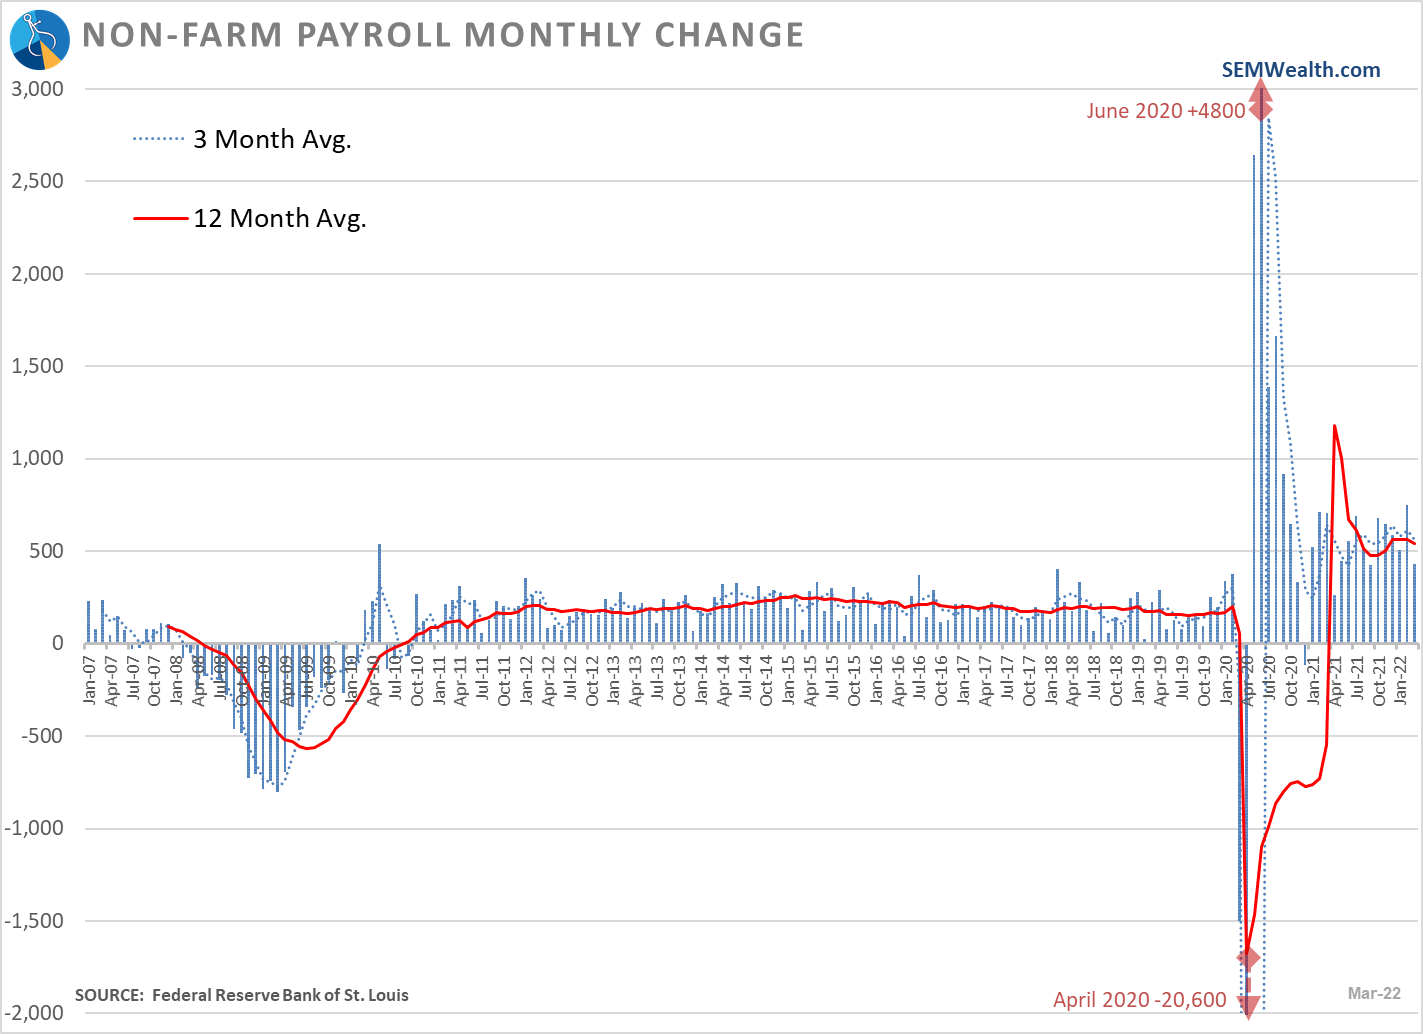
The labor market (and stock prices) continues to be the primary strength inside the model. The March Payrolls report showed another solid month (as well as upside revisions to the January & February data).
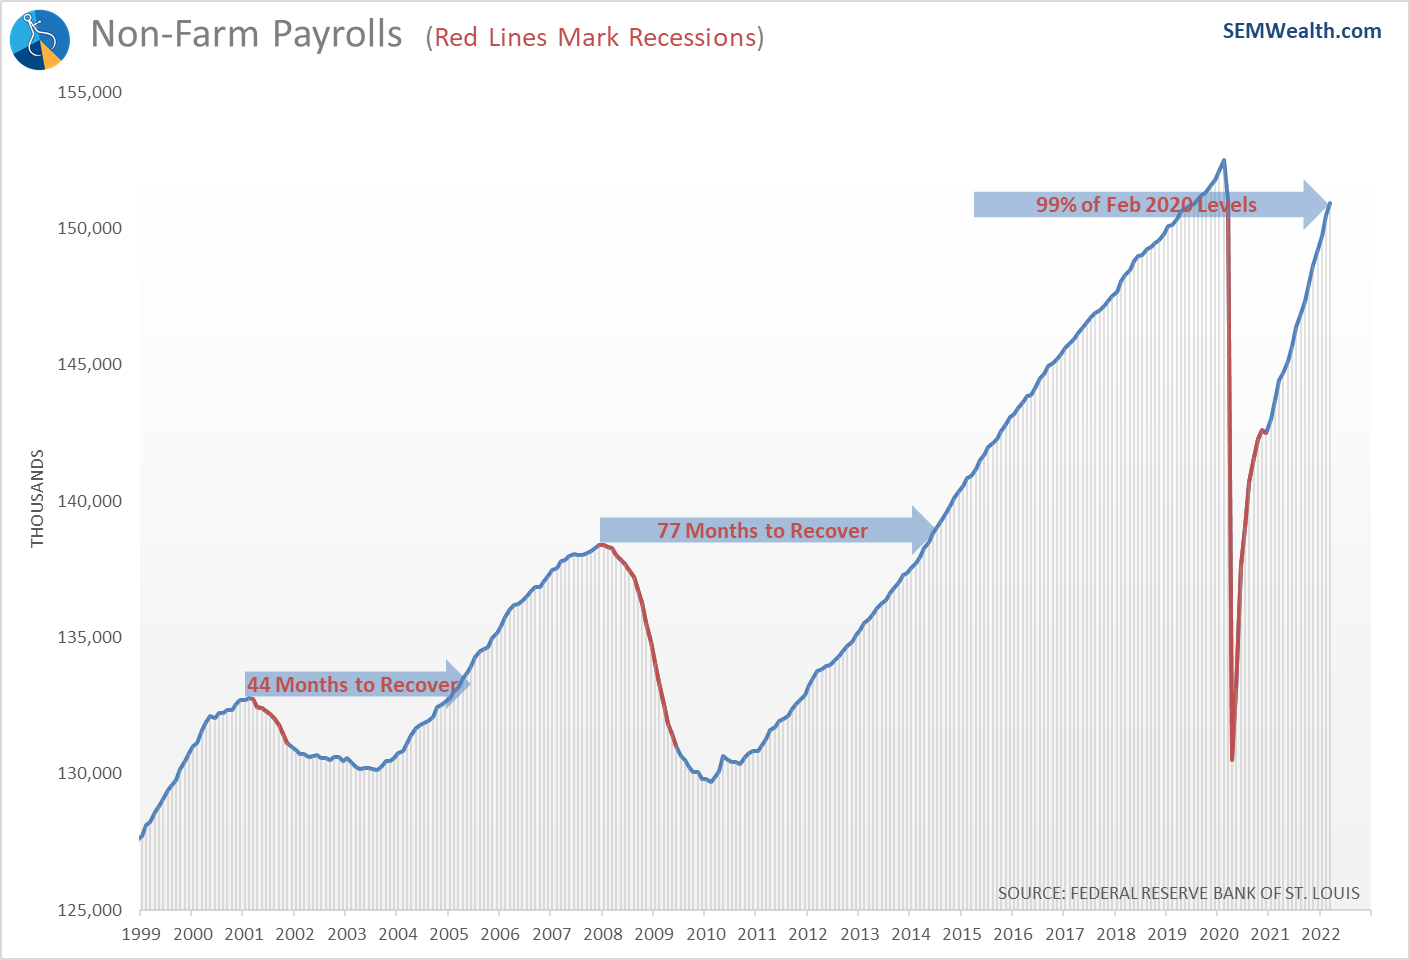
The recovery is running about double the pace of job creation from the last expansion. Of course, the number of job losses was unprecedented. We've also reached a point on the unemployment rate where we are near "full" employment, which creates upward pressures on wages (which risks creating too much inflation and/or cutting into profits).
Consumer Spending continues to be strong.
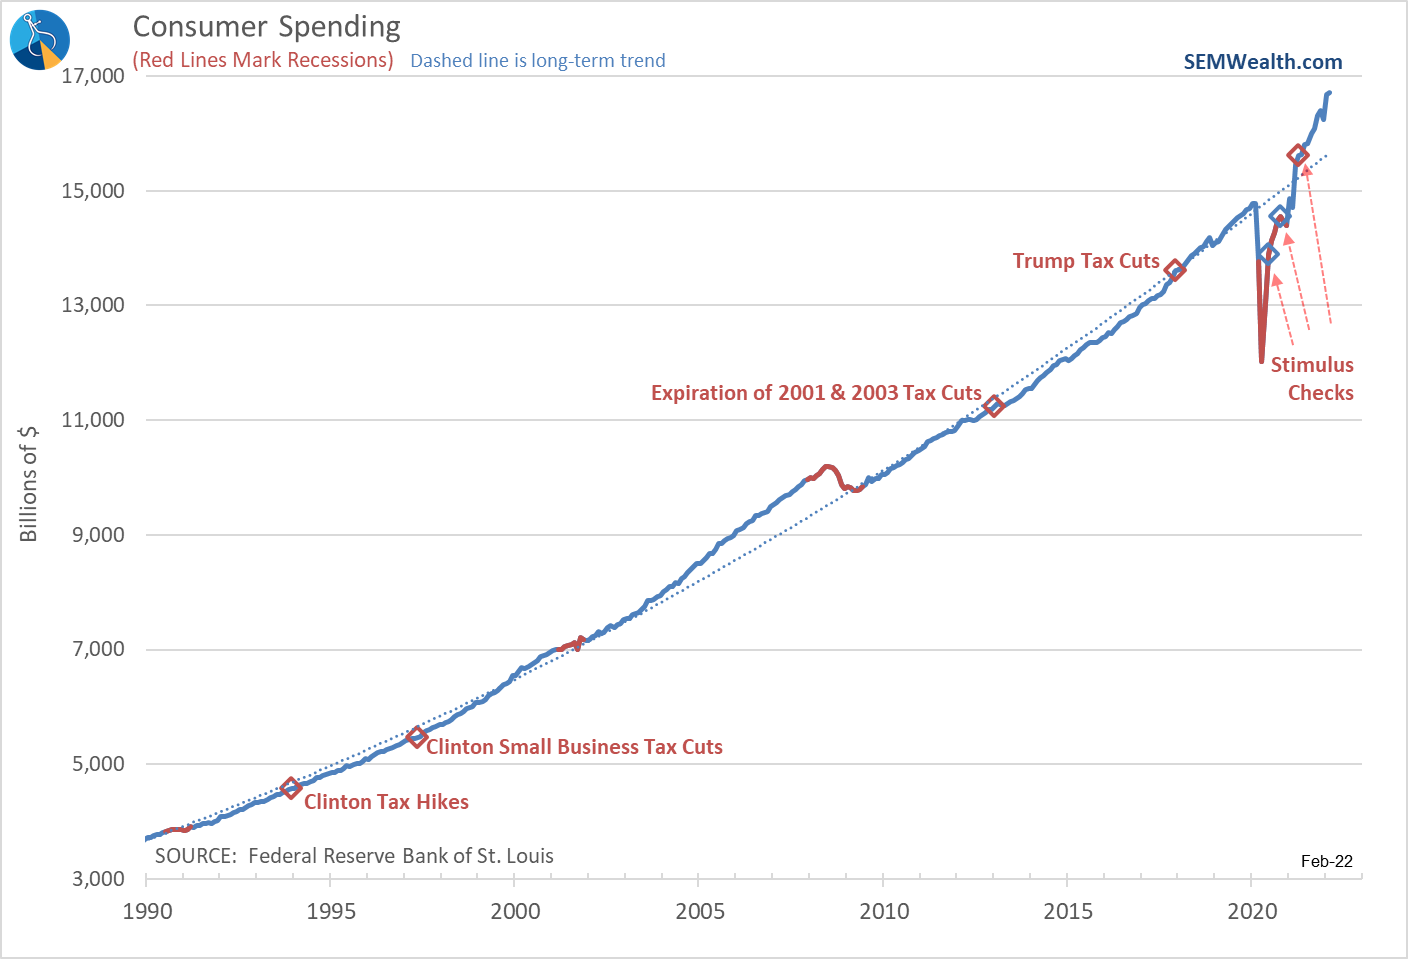
The problem is the evidence is pointing towards consumers using debt (or money in their savings account) to support their spending. Personal Income continues to decrease.
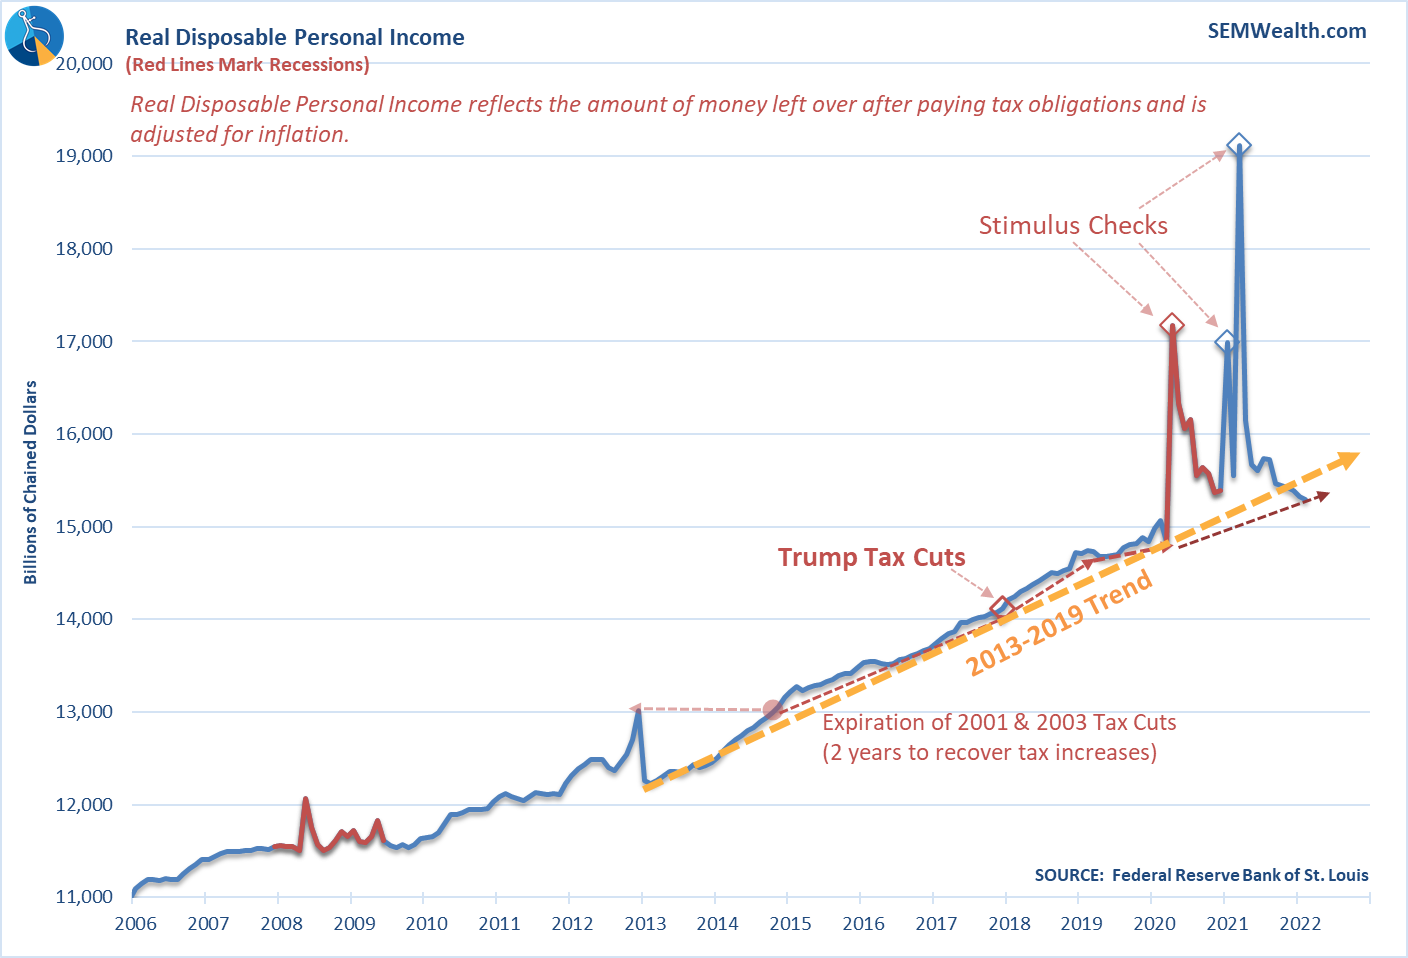
If income doesn't begin to increase, savings accounts will be depleted, and spending will slow. Subjectively and based on anecdotal evidence, 2022 is the year nearly everyone is making up for lost vacations. They will use whatever means necessary to take the trips they couldn't take in 2020 or 2021. After we get through the holiday season this year it is easy to see a very sharp slowdown in spending.
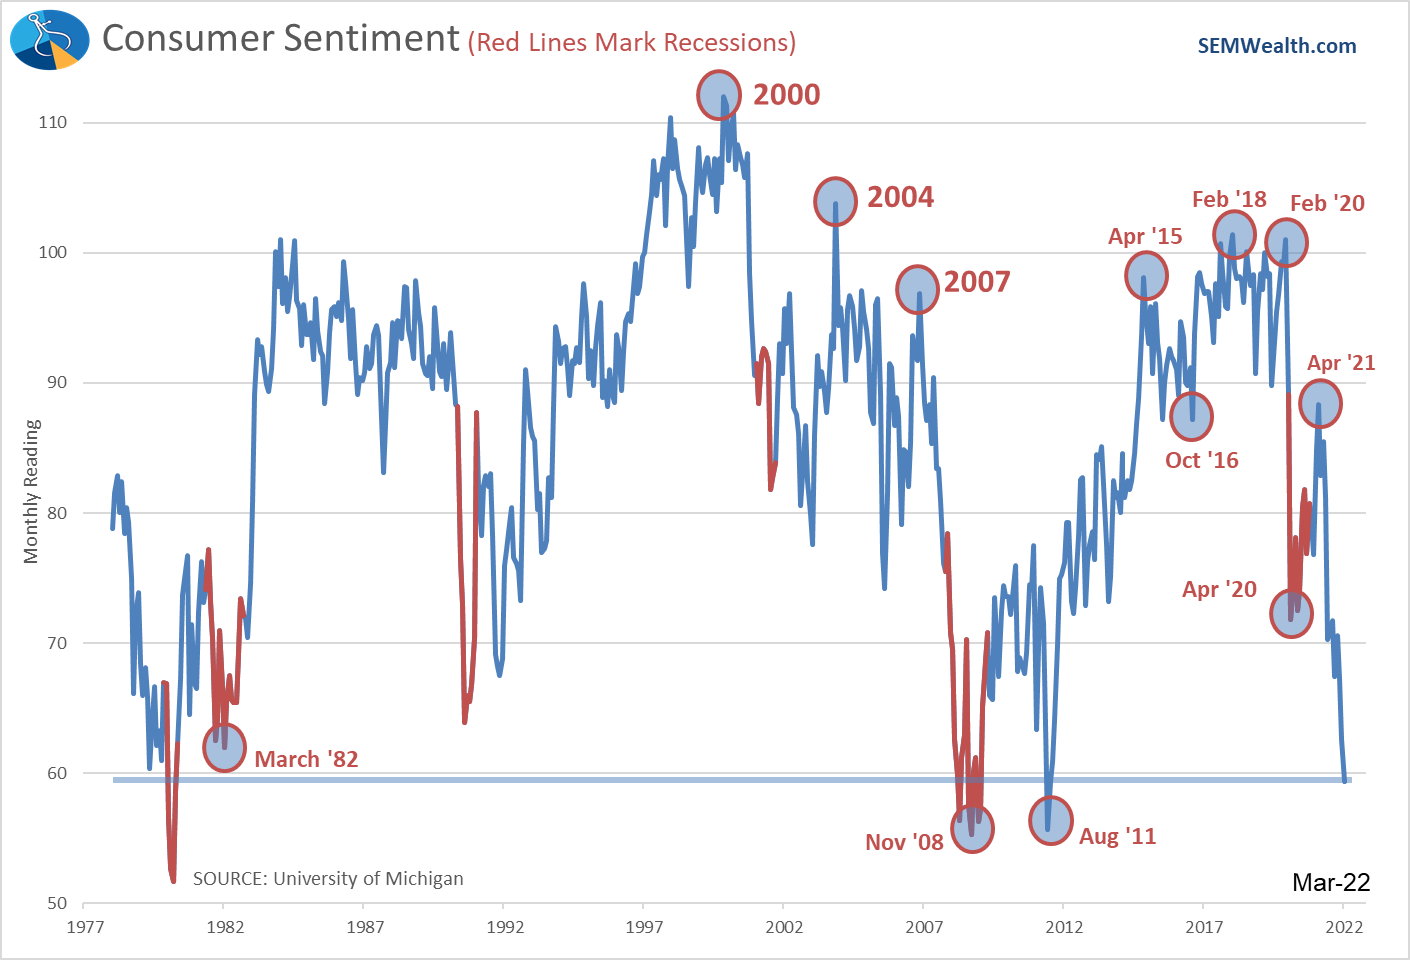
I continue to be surprised at the very low levels of Consumer Sentiment. If this continues, my prediction for the post-holiday drop in spending is likely to come true.
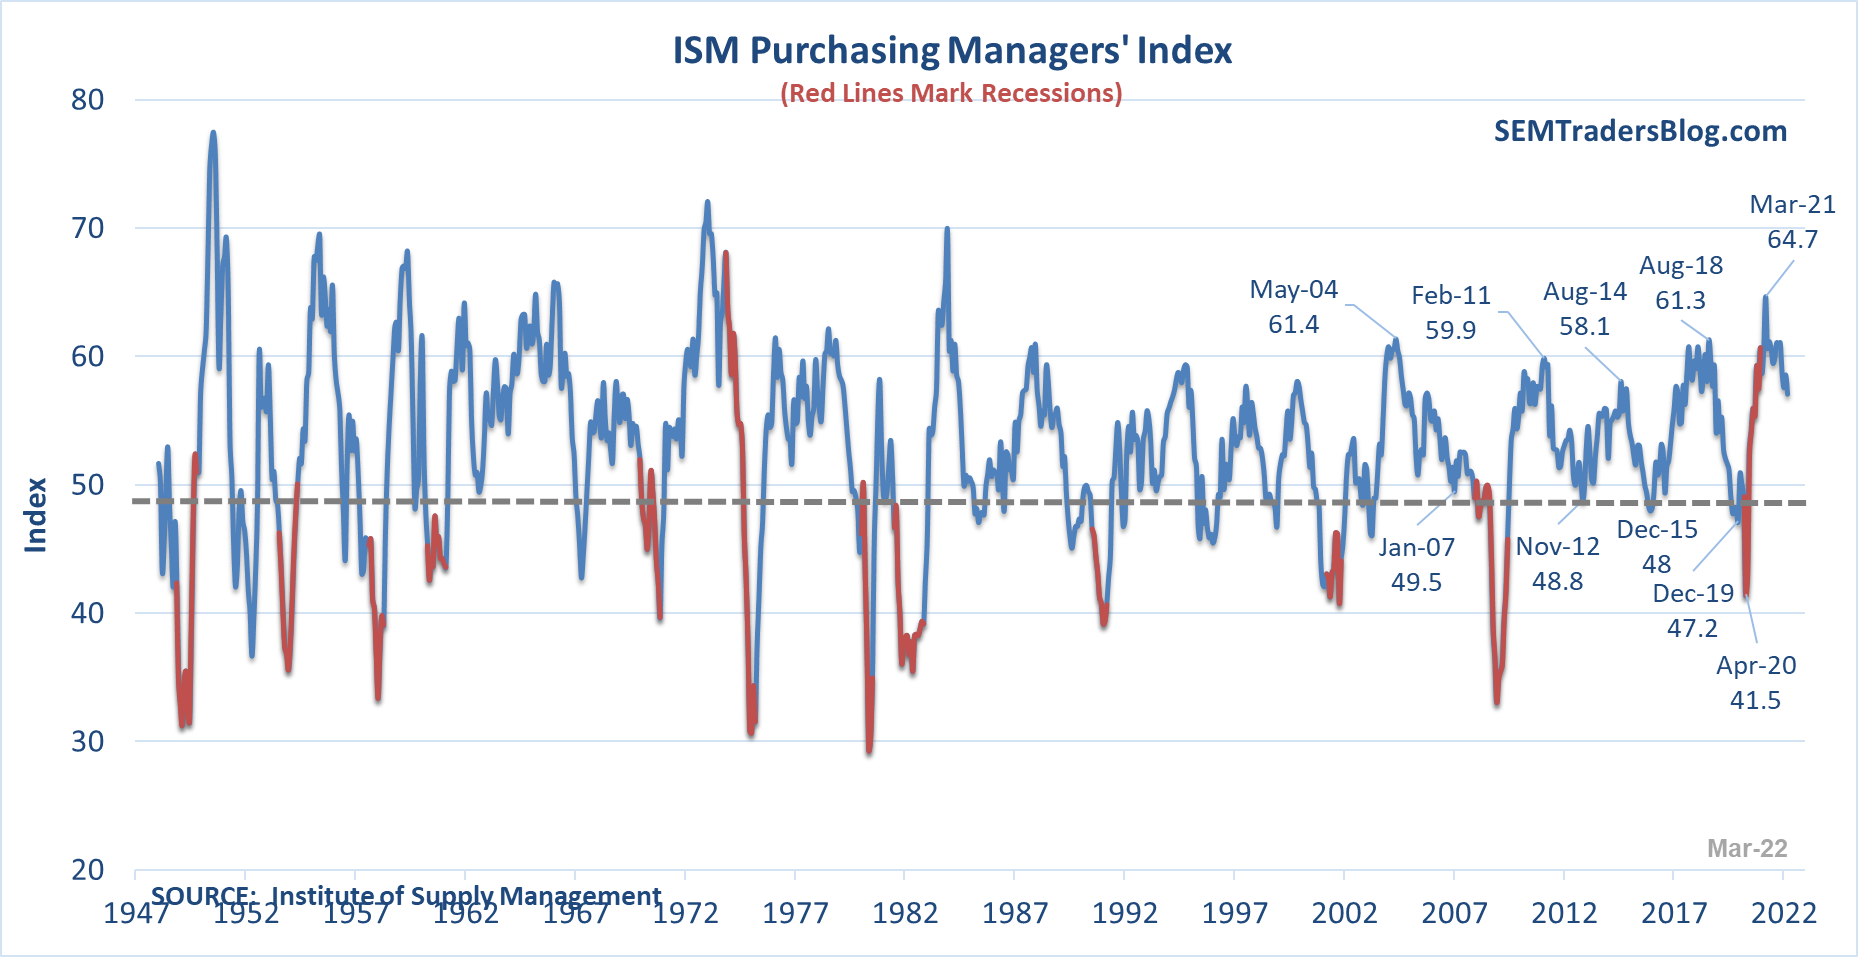
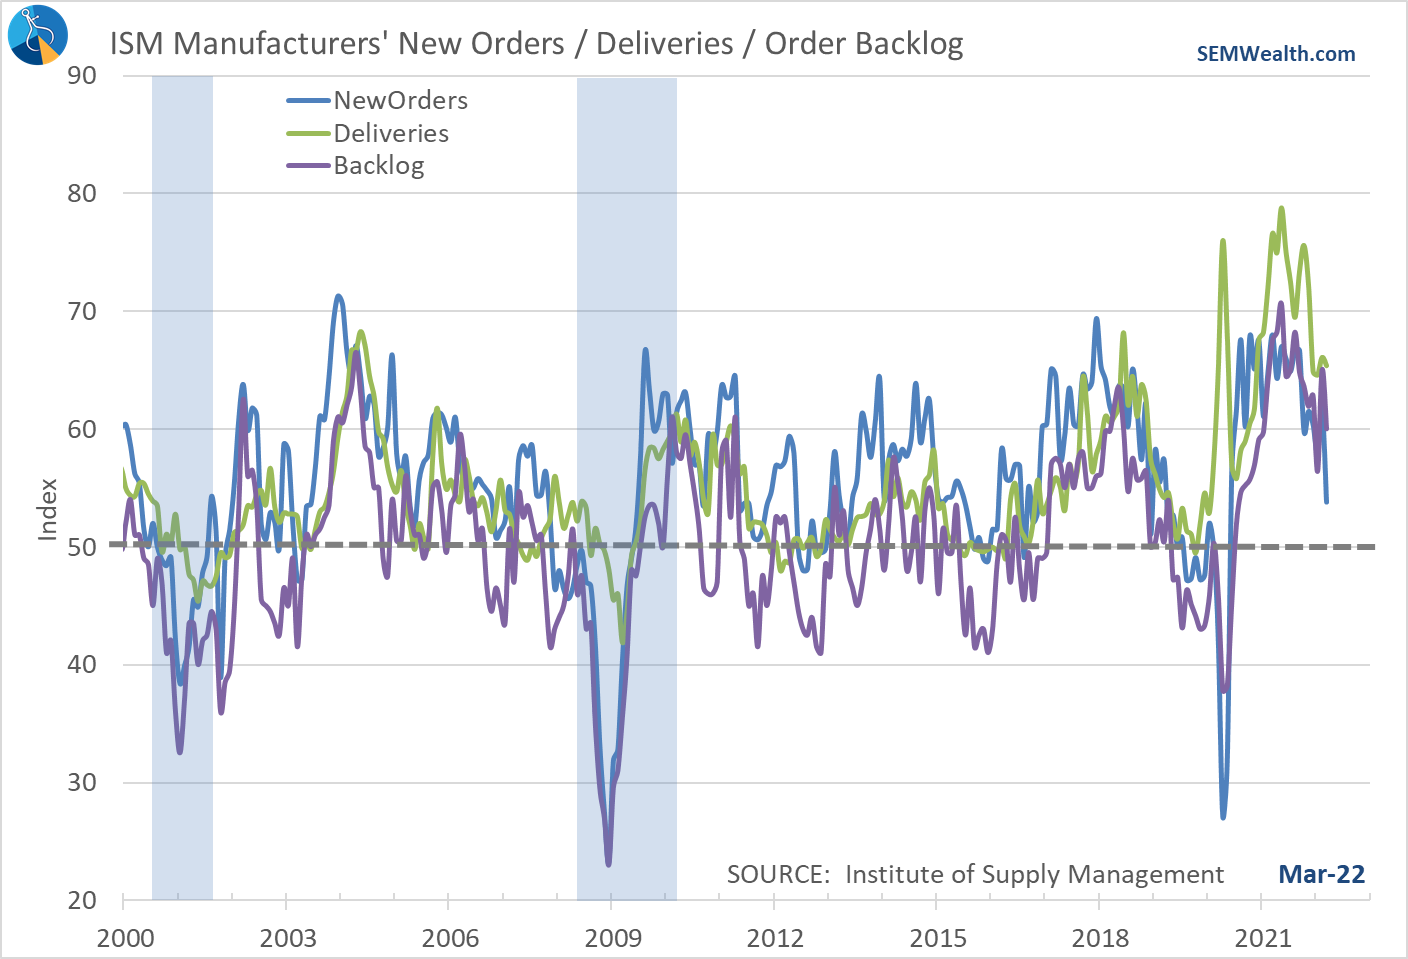
We're already starting to see this in the Manufacturing sector. Consumers shifted their spending to "stuff" when they couldn't get out and about. The decline in manufacturing activity since mid-2021 is something we will be watching closely.
The shift to "bearish" in our economic model impacts the allocations in our Dynamic models. This means completely eliminating our dividend stock exposure in Dynamic (and Cornerstone) Income and removing all small cap stock exposure in Dynamic Aggressive Growth. It also means an allocation to government bonds inside both models.
What should we do about bonds?
We cannot and will not subjectively override our bond allocations. The economic model was developed in 1995 when I was still in college. It used data going back to 1947. The only real tweaks were made in the early 2000s when the Service Sector Business Activity index was created. The model is designed to look at how different economic indicators act at various parts of the economic cycle. The investment decisions based on the model are designed to adjust allocations based on how various areas of the market react to those indicators.
Going back to 1947 when the economic indicators moved us to a "bearish" allocation, long-term interest rates would FALL. As I mentioned in the "talking points", I could easily see long-term rates fall as soon as the Fed starts to actually attack inflation. The reason long-term rates have gone up so much is the market has lost faith in the Fed's willingness and ability to fight inflation. As soon as they change course, it is likely bonds begin to act as they have throughout the past economic cycles. Adding bonds in our Dynamic models may seem risky, but as anybody who has followed SEM even for a few years knows – we follow the models regardless of our opinions on what we think will happen.
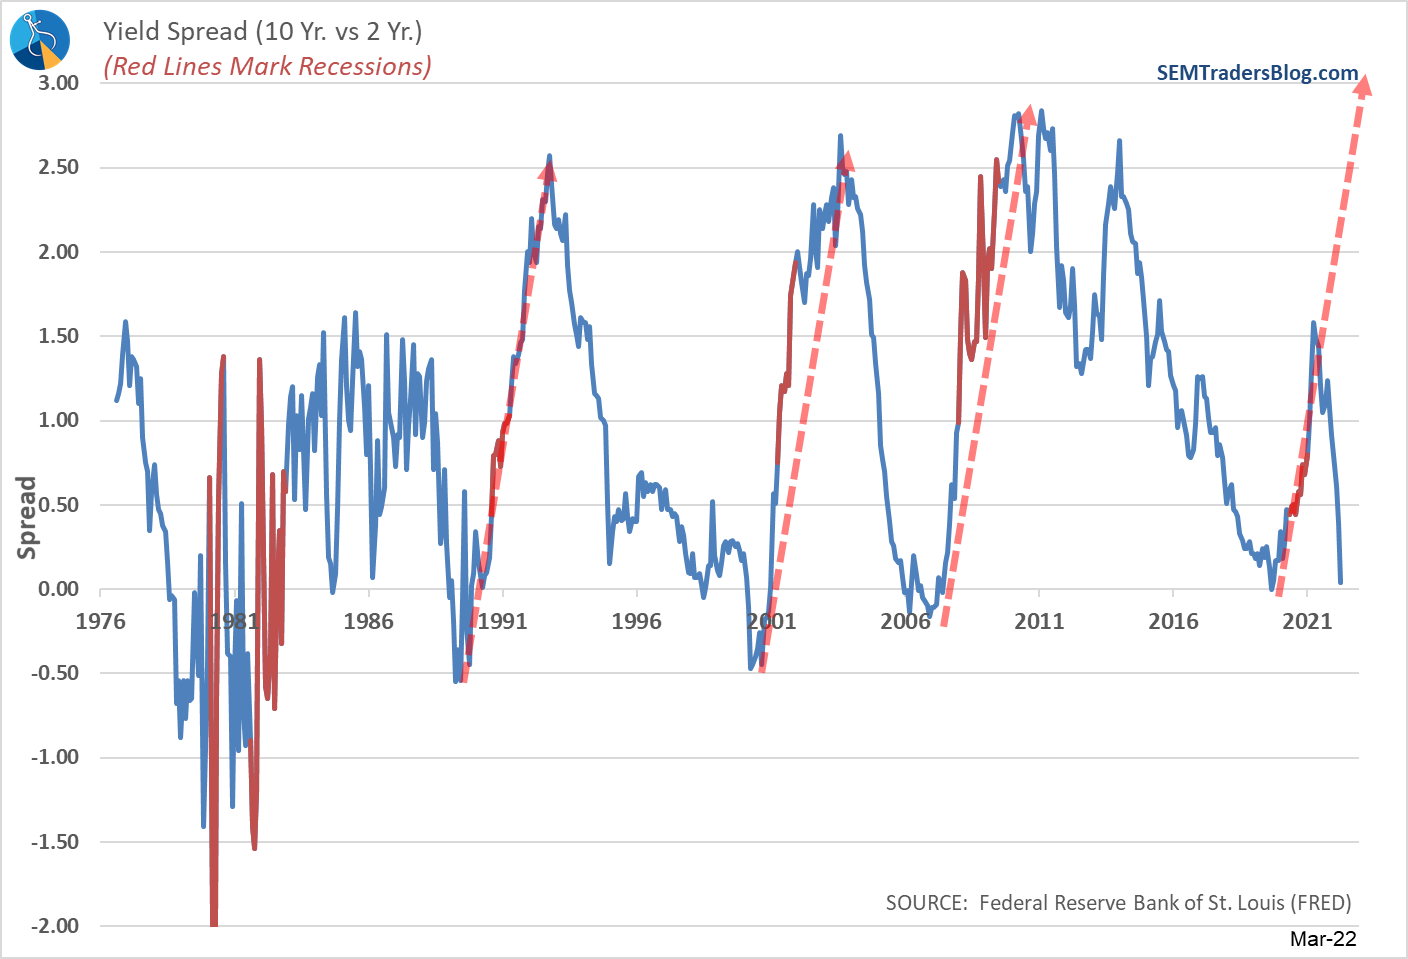
I showed this chart last week which plots the 10-year to 2-year Treasury yield spread. The red dotted line was added in mid-2021 and is a duplicate of the past cycles when we saw spreads widen. The fact they did not come anywhere close to matching the widening in spreads highlights how different this last expansion was compared to other expansions.
In terms of yields, they have stopped rising (for now).
They've also stopped below the very long-term trend line in yields.
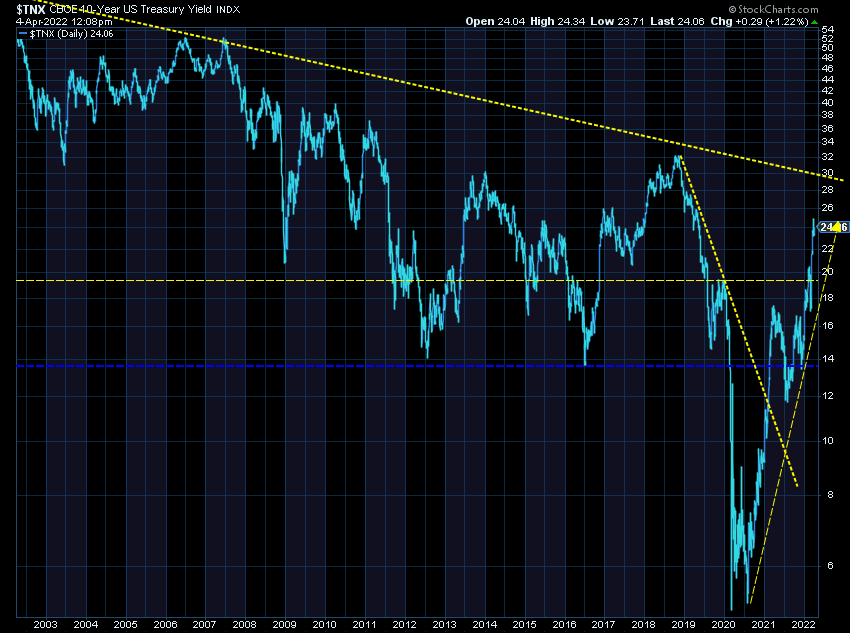
No predictions here, but I will say we need to be careful assuming rates on long-term bonds are going to continue to rocket higher. The economic cycle says they likely could fall.
As for the rest of our income investments, we rely heavily on moves in high yield bonds. Those bonds are less sensitive to interest rate changes and more focused on economic growth. While we've spent a good part of the year in "cash" and other low risk investments, high yields have not been hit as hard as the "safer" bond categories. This doesn't mean they can't be hit. It also means the opportunities for big gains are not there (yet.)
The best advice I can give people in any of our income investments is – patience, patience, patience. They are doing their primary job, which is reducing risk in the overall investment accounts. They are waiting patiently for better (and easier) opportunities.
As for everyone else with income investments outside of SEM, my primary advice is DIVIDEND STOCKS ARE NOT DESIGNED FOR 'SAFE' INCOME. I've seen too many people seeking higher yields moving to dividend stocks. Past down cycles have shown these stocks losing as much or even more than the overall stock market. How much do you really think a 1-3% dividend can actually help you in a recession?
Investing in bonds and other income products the next several years is likely to be difficult. I'd put our real-time, long-term income management track record up against just about anybody. Patience always has paid off with these investments.
Is the worst over for stocks?
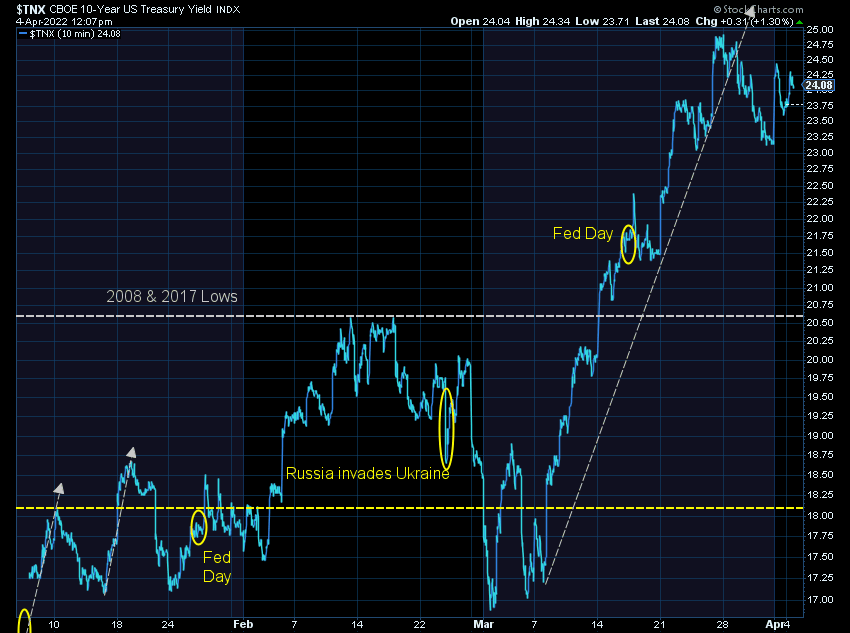
This is the key question. Based on the market action the last three weeks of the quarter, many people believe the answer is "yes". I continue to watch this chart with interest surrounding the yellow bubbles and notes:
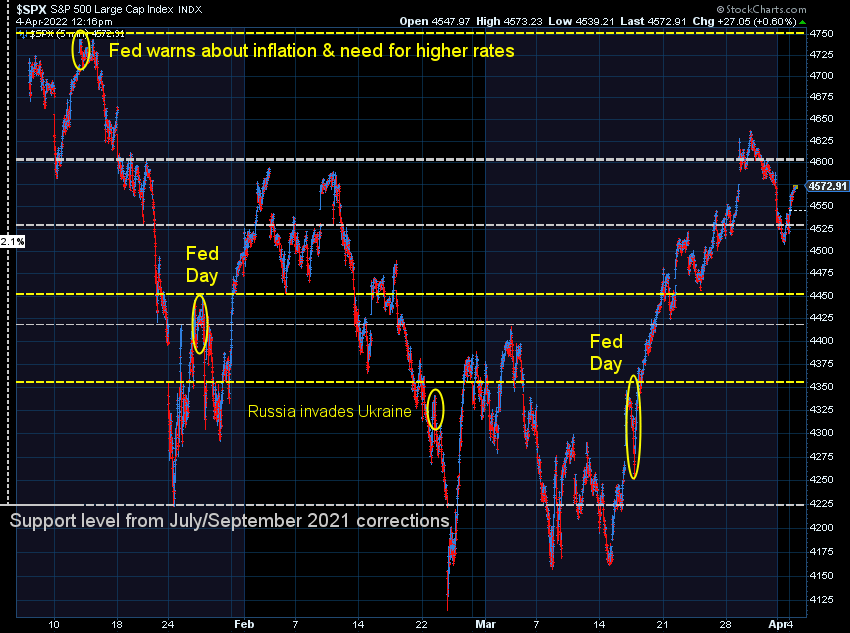
This tells me the market is not so worried about the Fed, but there is still a very real chance stocks could get hit hard when the Fed finally gets around to attacking inflation. If they move back to those strong words, we can see how quickly stocks could reverse.
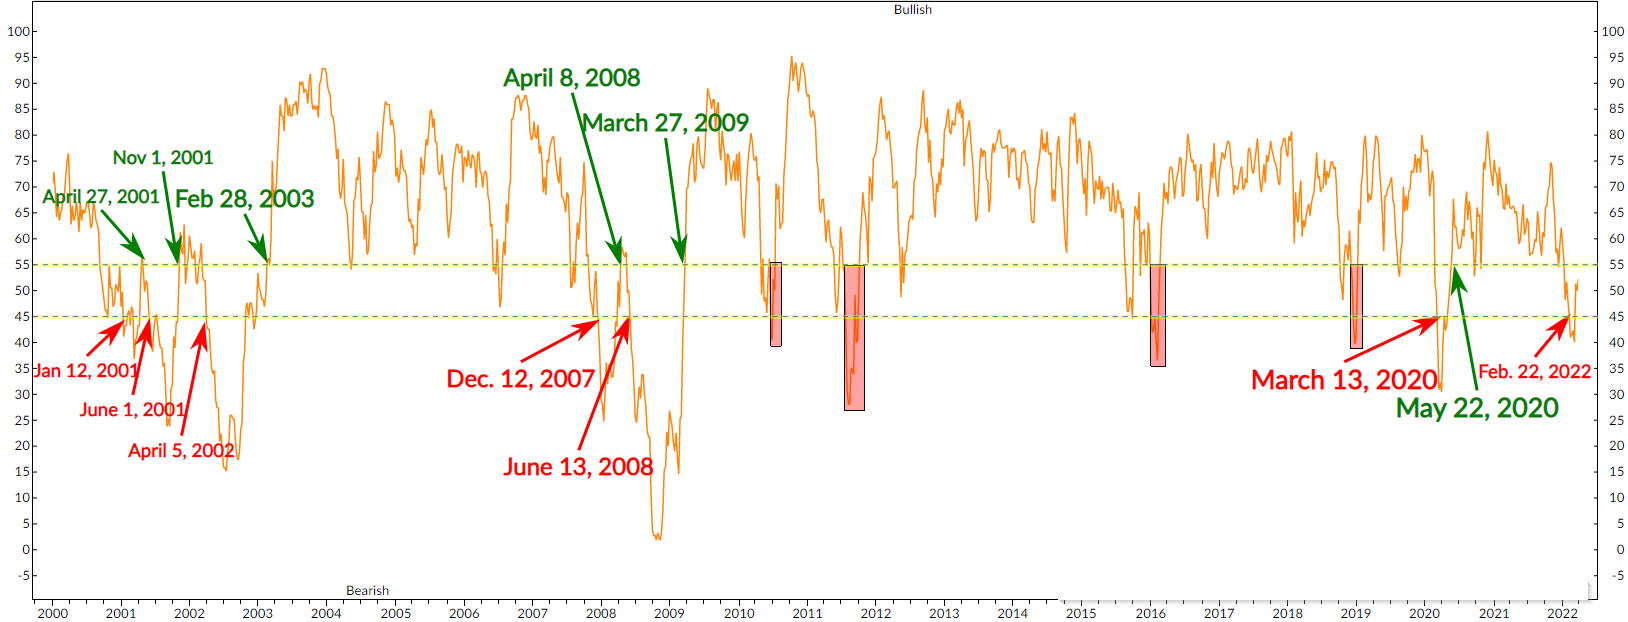
That's just my opinion. We of course rely on data. The trend indicator inside AmeriGuard and Cornerstone, which triggered back on February 22 has reversed back to a "buy" signal. This signal is not always right. In fact, it has a 60% winning percentage. The key is the "opportunity" cost of those "false signals" (the red boxes) has been far smaller than the losses saved by the correct signals.
More importantly, though for this quarter in AmeriGuard and Cornerstone will be the asset allocation. The core rotation model is shifting to be overweight "value" and reducing "growth". Even though we'll have a bit more stock exposure in the models than we have the past 6 weeks, the "beta" (volatility) of the investments should be lower.
Stay tuned for additional updates.


