
[CONTAINS UPDATES FOR TUESDAY, WEDNESDAY, & THURSDAY]
Last week I said "corrections are inevitable". We see 5% corrections in the market about 3 times a year. Each on averages lasts about a month, with the recovery taking up another month. The S&P 500 lost nearly 6% last week (and it was only a 4-day trading week). The NASDAQ lost 7.5% and small caps, as measured by the Russell 2000 lost 8%. After dropping the first few days, the bond market rallied the last two days to make a break-even week.
I ended the week with multiple emails from people who a couple of months ago said they wanted to take more risk (because they wanted higher returns) suddenly reversing course and asking to go to more conservative allocations. The question is whether or not this is the time to panic or if this is simply a normal correction that will quickly be reversed.
Weekly Talking Points
- 10% corrections happen on average about once a year, which means this drop is quite normal (see chart below).
- The primary concern is whether or not the Fed is going to aggressively pull back their stimulus (the Fed meets on Tuesday & Wednesday this week). Investors really haven't had to deal with the prospects of "Fighting the Fed" this century. This is a new environment for most investors.
- Nobody knows what the real "fair value" is for interest rates. The Fed has been the primary purchaser of all Treasury Debt the past 22 months. So far this year, bonds have been dropping with stocks. This is a new environment for most investors. Long-term bond yields may still go lower even with Fed rate hikes if the market believes they will create a recession.
- Price/Earnings ratios were near historic highs. Those can be supported by low interest rates and strong earnings growth. The earnings news thus far has been more negative than any point in the last 15 years. This is a new environment for most investors.
- Markets move in cycles. The real question of whether or not it's time to panic comes down to your overall financial plan, your cash flow strategy, and your investment personality. Unless any of those have changed, this is a normal part of the process. If you found yourself chasing returns last year or you were uncomfortable with what happened last week, you need to talk to an experienced advisor (or if you're an advisor talk to me). It could get A LOT worse.
- This is not a new environment for SEM. Our tactical systems took more risk off the table last week. Our Dynamics already did that in October (because they are concerned about slowing growth). Even our strategic models are close to hitting some sell points if things get worse. The key is we have unemotional, quantitative models designed to take our behavioral biases out of the equation.
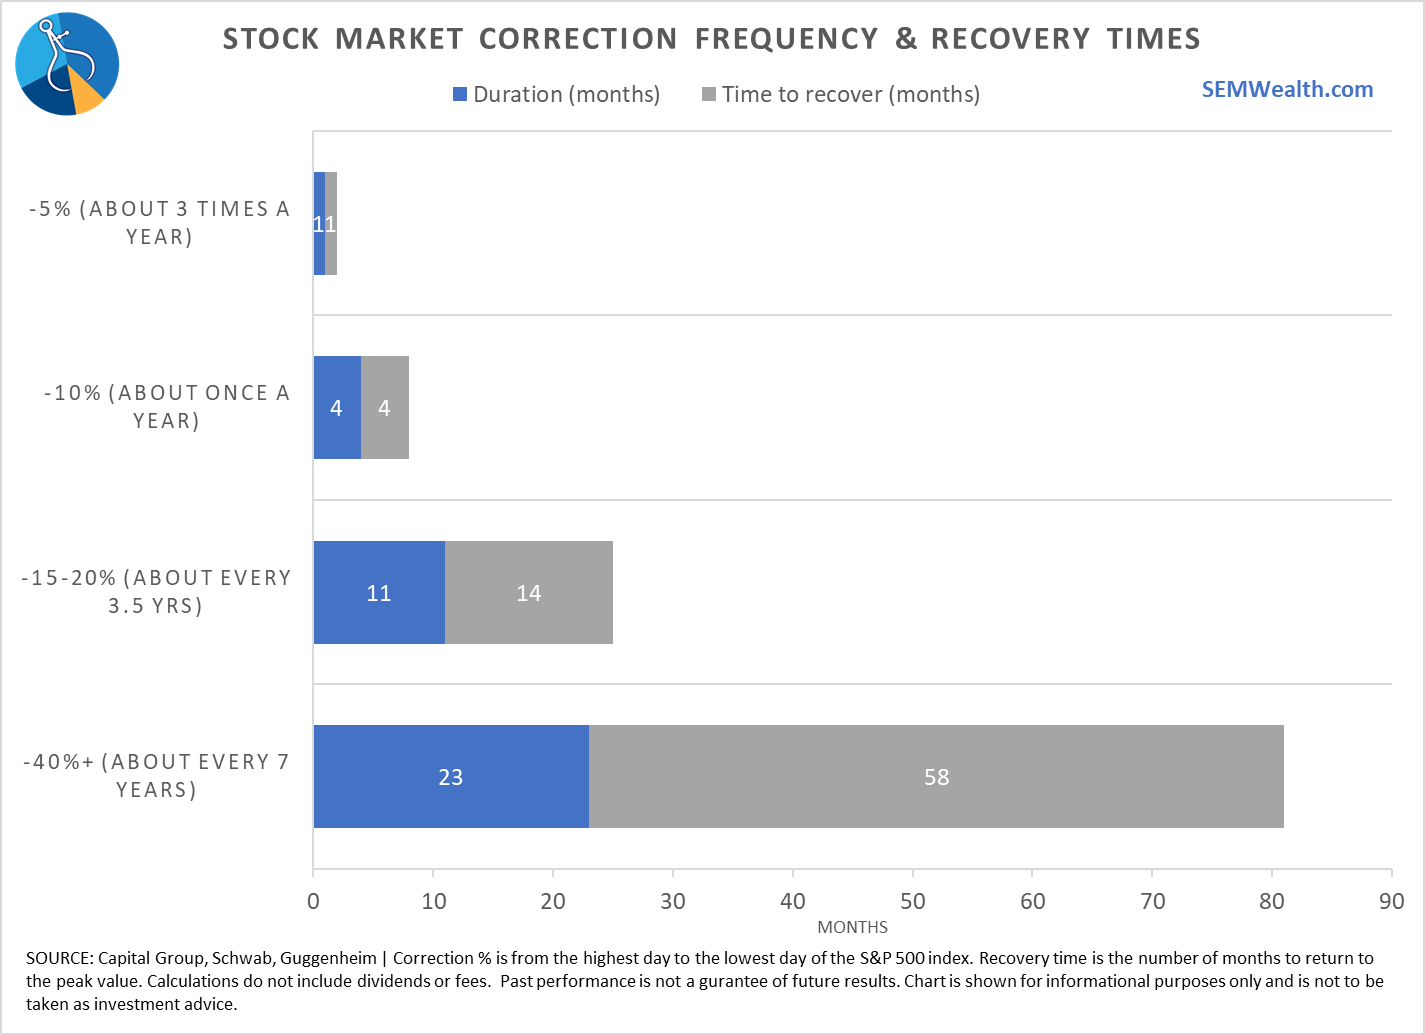
Remember Corrections are Inevitable
Here's the updated "drawdown" chart from Morningstar.
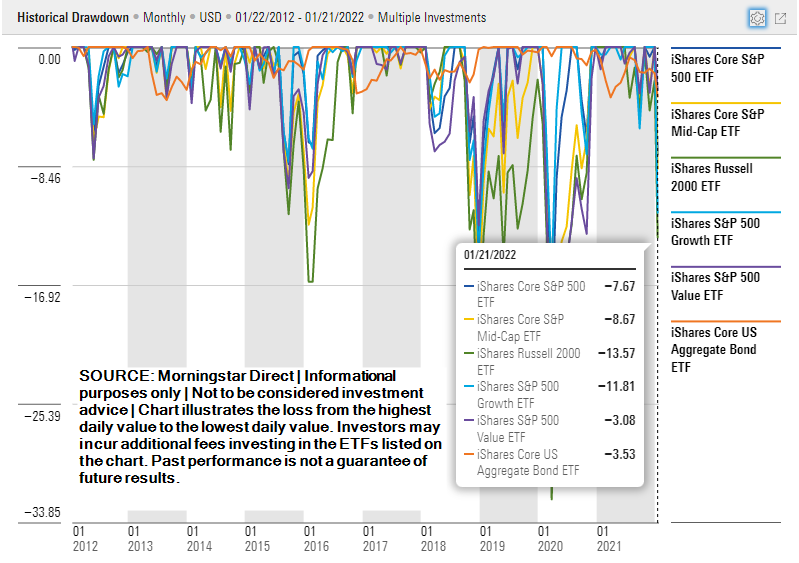
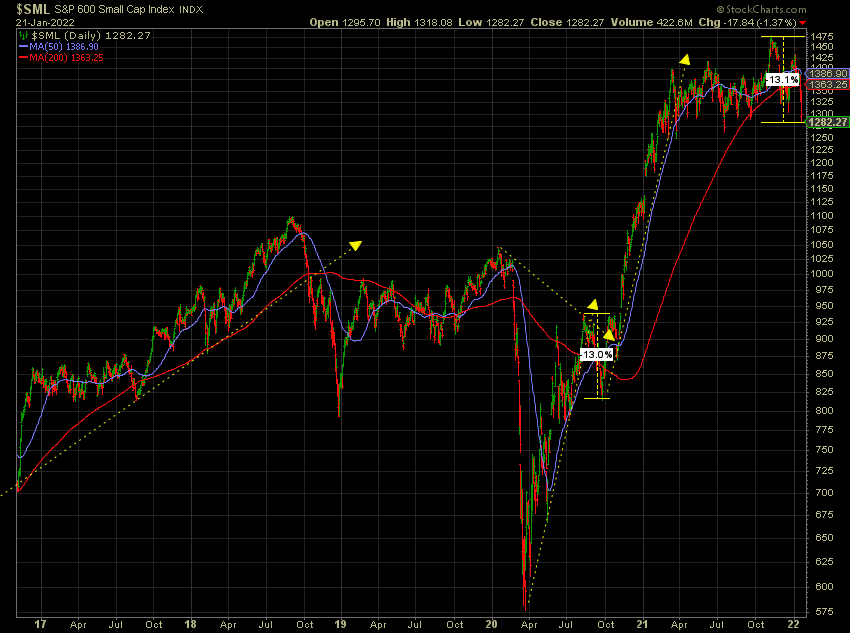
Value Stocks have held up the best. Small cap stocks have gotten hit the most, with growth stocks right behind them. We're overdue for a 10-15% correction. The last one was in March 2020 (when it fell 35% before it bottomed.) Prior to that we saw this type of correction at the end of 2018 and the beginning of 2016. In both of those events the market was concerned about an economic slowdown. When that didn't happen, stocks rallied back. It's way too early to tell whether or not the current bump is temporary or the beginning of the end of this economic expansion.
One thing I haven't liked is the selloffs the last 2 hours over the past 5 trading days. Typically, the opening of the market is driven by retail investors (who put in their trades before and after work). The last part of the day is when you see large intuitional trades executing their block trades. Institutions take a long-time to make model allocation changes, which can continue to drag on the market. It will be a good sign if we see multiple days of buying occurring during the last two hours.
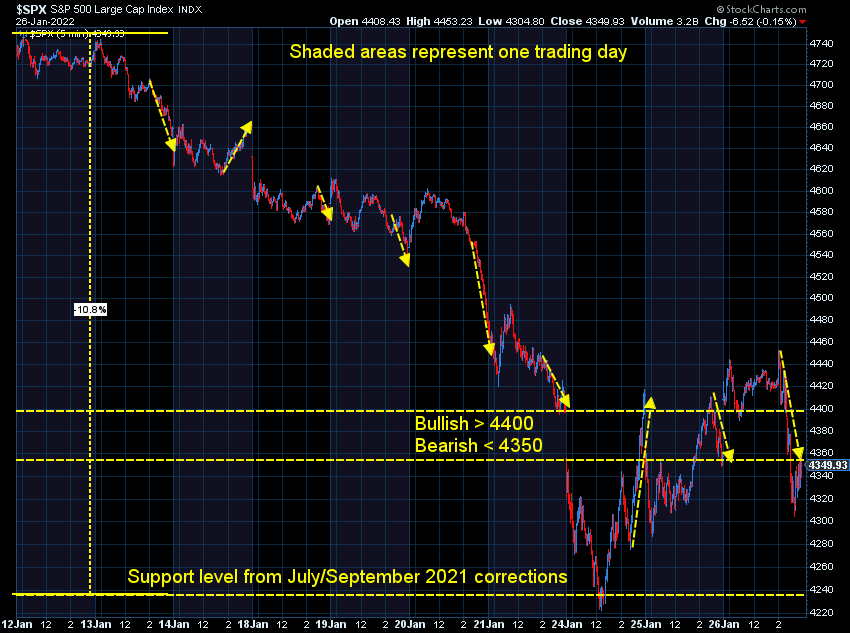
Update 1/24/22 5:00 PM ET: The rally the last two hours was encouraging. The market came all the way down to the levels it hit during the 4-5% corrections of July & September 2021. However, the market simply just filled the "gap" between Friday's close and Monday's open, which happens frequently. How the market acts the following few days will be key.
Update 1/25/22 4:25 PM ET: The market fell and then staged an impressive rally off the lows. Everyone was making a big deal about it, but the updated 5-minute chart shows it was much ado about nothing. The last two days the market has been filling in the "gap" between Friday's close and Monday's open. This is normal as the market decides on the next direction. I added key levels to watch on the chart above.
Update 1/26/22 4:05 PM ET: The market surprisingly was strong going into the end of the Fed meeting. It traded all day above the "gap". It rallied even stronger when no rate hike was announced. That ended shortly after Chair Powell's press conference began. The S&P 500 fell all the way down below the "gap" but managed to rally in the 30 minutes after the presser ended and will start the day on Thursday back in that gap. The negative yesterday was the comment that the pace of rate hikes would be faster than in 2015-16, which puts the possibility of both a 0.50% hike in March as well as monthly hikes. The positive was Powell saying (for now) the plan is to use rate hikes first and delay the Balance Sheet "unwind". The fear going into the meeting was the Fed would start both in March. Regardless, the Fed remains serious about fighting inflation, which could hurt stocks with the highest P/E ratios (Large & Small Cap "Growth" stocks).
From a bigger picture standpoint, the S&P 500 dropped below a key long-term indicator (the 200-day moving average) on Friday. This is the first time since the COVID drop. Up until now, the 100-day moving average has been the point the S&P 500 found support during this huge rally.
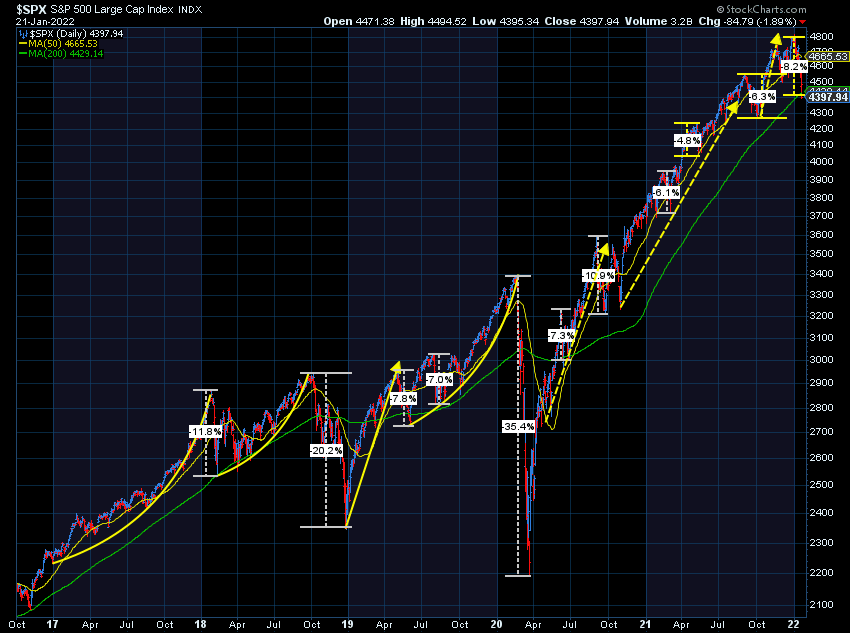
The bigger concern is small cap stocks. Institutions accumulate those if they believe economic growth will be strong. Those stocks have been hit the hardest. Other than a brief rally in the 4th quarter, small cap stocks seem to have topped out in the Spring of last year.
What about the Fed?
The bond market has panicked about the prospects of the Fed raising interest rates up to 4 times in 2022 at the same time they not only "taper" their asset purchases, but also start selling their assets in order to fight inflation. Here's a look at the 10-year Treasury yield. The top trendline goes back to 1985 when yields hit their ultimate peak.
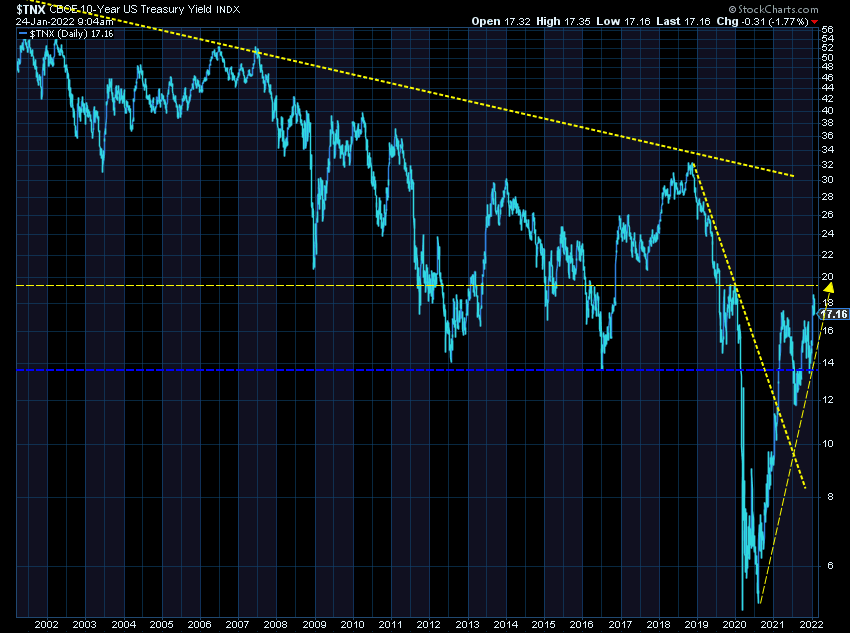
It's getting ugly and probably will get uglier if yields cross above 2%. It could be argued the bond market has done the job for the Fed and they may not need to be as aggressive.
For more see:
 Jeff Hybiak, CFA
Stocks are still expensive
We've been programmed to believe every drop is a buying opportunity. This has been because pretty much any drop was met with the Fed coming out and either adding stimulus or slowing down their "exit" from past stimulus. This has been despite P/E ratios which were at the highest level other than the tech and housing bubbles. The justification for this was a.) earnings growth was strong and b.) low interest rates allow for higher valuations.
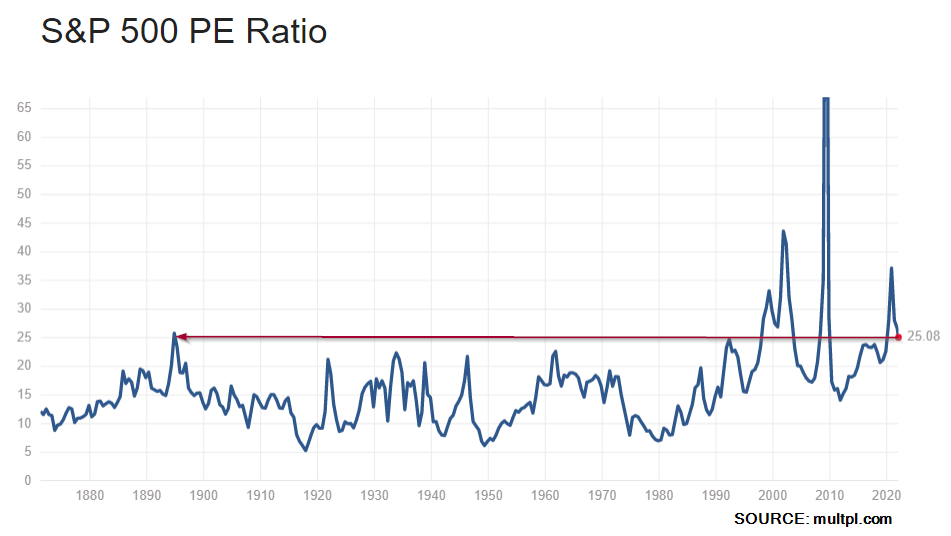
Now we may be facing a period of both of those things being incorrect. The reason NASDAQ and Small Cap stocks have been hit the most is they have the highest P/E ratios (because they had the highest expected growth rates). The chart above makes it hard to argue this is a long-term buying opportunity.
What really matters
- Financial Plan
- Cash Flow Strategy
- Investment Personality
When we create customized investment portfolios, those are the three inputs. We don't care about interest rates, valuation metrics, or how much the stock market dropped the last week. If you're an SEM client, unless any of those three things have changed, there is no reason to make a change.
If you want a personalized portfolio check-up, simply click this link and one of our portfolio managers will take a look.
If you're not an SEM client or you have assets outside of SEM where you found yourself chasing returns, we REALLY need to talk. Things can certainly get worse whether over the next few weeks, months, or years. Much larger corrections are inevitable. To start the process, simply click this link.
SEM Model Update
Our tactical models (Income Allocator, Tactical Bond, and Cornerstone-Bond), which are our lowest risk models had already taken some money out of risky assets. They trimmed positions again last week and went fully "risk-off" on Monday. The strategies behind these models have been used in real-time for over 30 years and are the core for most of our clients, especially those retired or within 5-10 years of retirement.
Our dynamic models have been in "neutral" or "transition" mode since the beginning of October. They will get their next update at the end of the month. This positioning has led to losses about half of their benchmarks thus far.
Our longer-term strategic models have obviously been hit the most. They are designed to whether normal corrections without flinching as they are designed for the longest-term portion of the portfolio. They did dump all small cap positions at the start of the year and picked-up some large cap value, but not as much as we would have liked (with hindsight). The more important aspect of these models is the "trend" indicators. Both are inching closer to a sell signal, which would take some money off the table should things get worse.
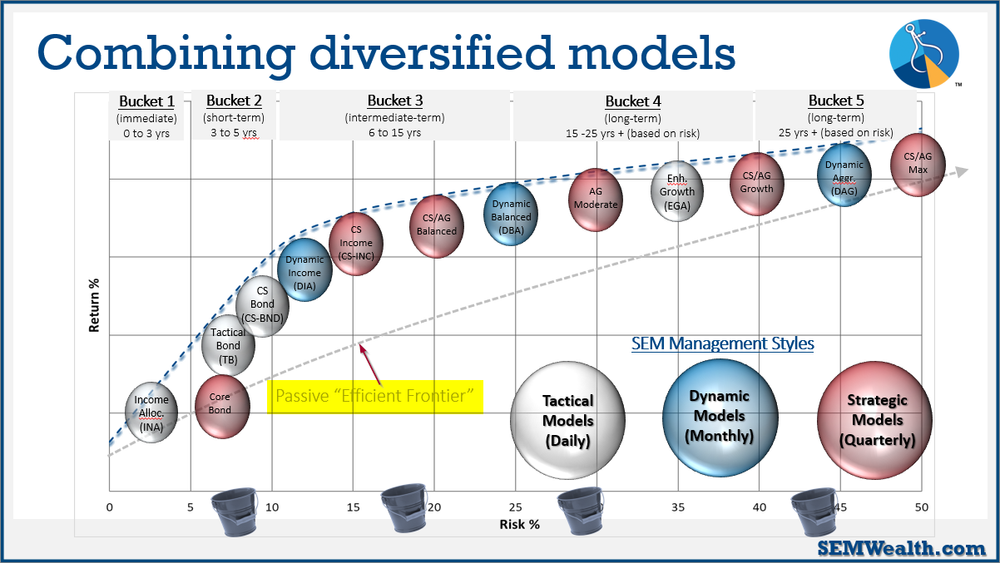
Most clients have an allocation to all three management styles, which means they have three distinct ways to negotiate the unknown. I've yet to find an investment manager with such a diverse line-up where no opinions are necessary to make investment decisions. By design, the lowest risk models on the left side of the chart have the least exposure (and are likely to reduce exposure even more as things get worse). The models on the right have the most exposure.
Where should you be invested? That's where our Risk Questionnaire comes in.
The biggest takeaway is if you're an SEM client or advisor, there is no reason to panic. We have a plan no matter what happens. Having been here for 24 of our 30 years, I'm always amazed at the sense of calm in our offices when there is a large drop in the market. There's no lost sleep. There's no angst. There's no speculation. We simply do what we always do – let the models determine when it's time to sell (and ultimately buy again).
If you're an advisor and do not have portfolios designed to whether the storm with zero emotions, we should talk.


