
In June we issued 3 bear market tips – stay calm, ignore the media, and be patient. In September we followed that with some reminders on navigating the bear market including the primary things to remember – inflation is the problem, the Fed has barely begun their fight against inflation, both of these will cause the economy to suffer, corporate earnings will be hurt, and stocks are still overvalued even after a 20%+ drop.
We've had numerous requests to give an update for clients and advisors. In case you missed it, you can sign-up here.
Last week we saw a reminder of how important it is to follow our tips as reality hit the markets. Despite a huge bounce following a hotter than expected CPI reading on Thursday (fueled by option activity and short-covering after the market hit new lows for the year), the fact remains we are in a bear market until the data says otherwise. I have my opinions when it will end, but we won't change our allocations unless the data tells us it's time.
One thing I think people forget is the biggest rallies occur INSIDE a bear market. In fact, 47 of the 50 best single days for stocks have occurred with the market below the 200-day moving average (which is typically a longer-term indicator of being in a bear market). Those rallies occur because there was a little too much pessimism and the market needed to wipe some of it out. Just as bull markets do not go straight-up, bear markets do not go straight down.
One thing I'm worried about is what this bear market will do to our highly leveraged, stimulus and low interest rate dependent financial system. We've already are seeing significant strains in the United Kingdom over a sophisticated pension strategy that assumed interest rates and exchange rates would remain in "normal" ranges. While US pension systems were not all pushed into using the "new" sophisticated interest rate strategies, it's hard to believe we won't see additional problems emerge outside the UK.
Each year I get an update from the CFA institute on the changes to the curriculum. I try to study the new information where it applies to my role and peruse the rest to look for new ideas in our industry. For each of the past four years the fixed income and portfolio management sections have discussed "liability matching" strategies for investment funds designed to pay out fixed income (think pensions and annuities). These models make assumptions on where short and long-term interest rates will be to determine the amount of money that needs invested across the yield curve. Funds have discovered it is far easier to match these liabilities using derivatives rather than buying all the various bonds. These models also include an inflation expectation.
Remember, no Wall Street bank was forecasting interest rates to be this high or inflation to still be above 8% at this point in the year. I have a hard time believing we aren't going to see some things break in our financial system.
I've also seen too many people say things such as, "well the financial system isn't as leveraged as it was before the financial crisis", or "stocks were not as overvalued as they were before the dot-com crash." They may be right, but it doesn't mean we won't have another financial crisis. Before it happened, few people were warning about a financial collapse. Things were "stable" and all was well........until it wasn't.
Many people forget back in the fall of 2019 I discussed how cracks were emerging in the financial system. The Fed had been "unwinding" its balance sheet (Quantitative Tightening) from 2015 until early in 2019. They had to stop and actually start easing again in the summer of 2019 because the financial system was running into liquidity problems. This showed up in the "reverse repo" market, which is the system which banks use to cover their cash demands each day. Usage of the repo market surged in 2019 as banks struggled to meet liquidity demands.
What is fascinating to me when you look at the reverse repo usage chart is you can barely see the "surge" due to the astronomical usage of the facility since COVID.
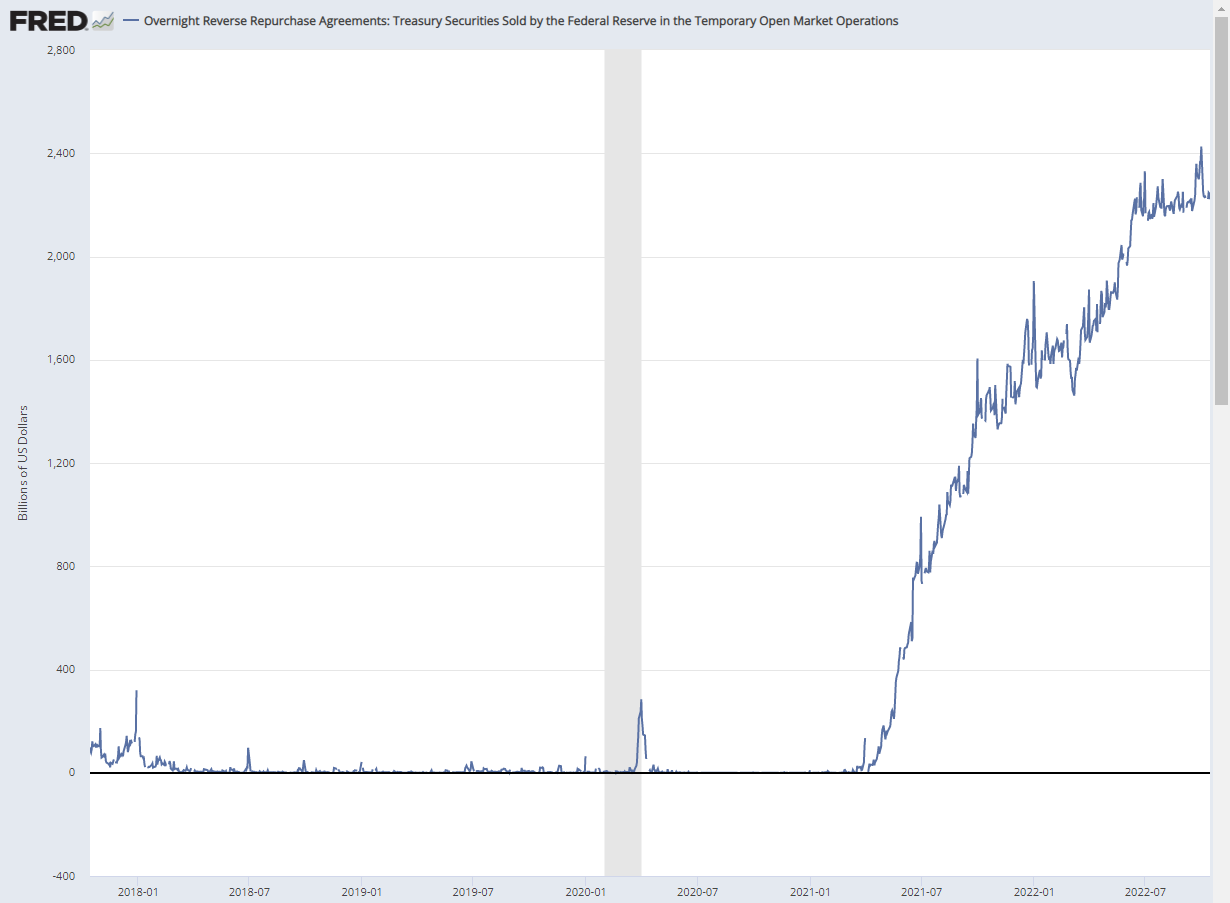
Banks have been heavily relying on the Fed to provide liquidity to meet cash demands. I'm adding this data point as well as the overnight rate to my charts I'll be watching. The Fed's Balance Sheet has barely been reduced (so far). As they sell assets (at a loss given the huge spike in rates) not only will they be sucking money out of the system, but they will also be putting Treasury Bonds into a market that is already struggling to find buyers of these bonds.
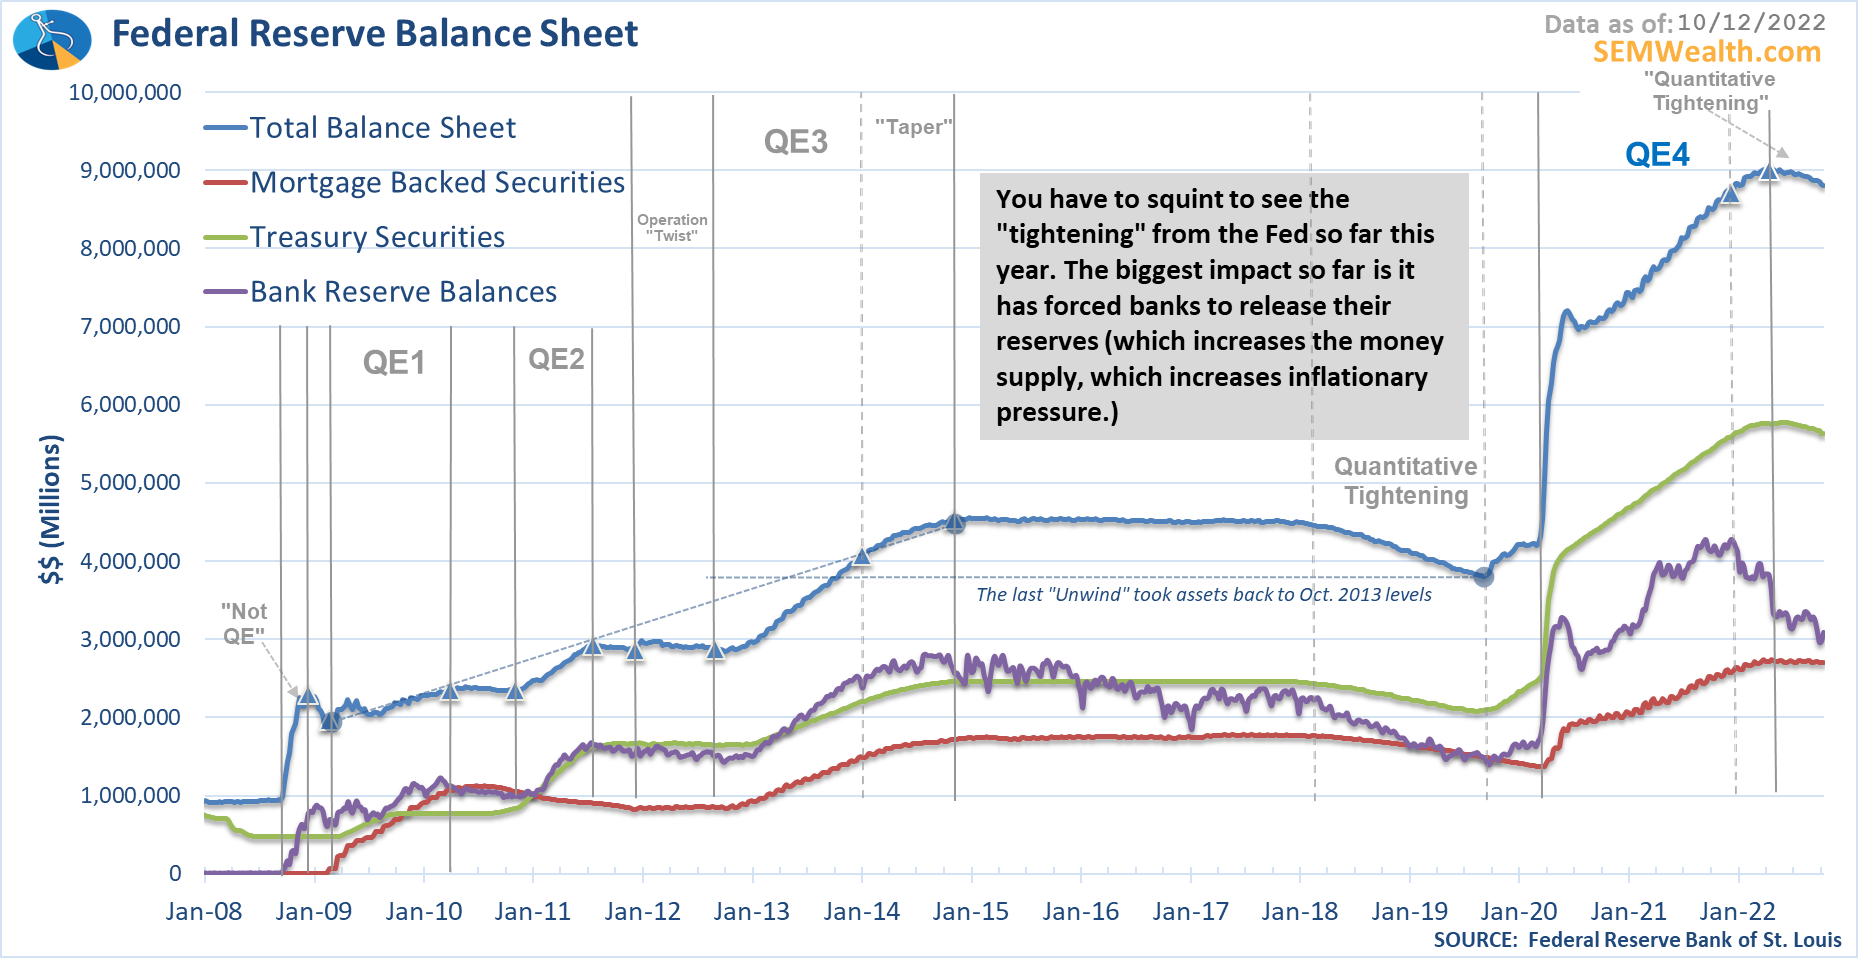
Things are going to break. Our financial system was too reliant on the Fed to provide liquidity, low interest rates to allow low-cost refinancing of debt along with additional borrowing, and under the false assumption the Fed would always be there to bail them out. The question is when will things break, how widespread will it be, and more importantly, will it force the Fed to reverse course as they had to in 2019. The issue is inflation wasn't a problem in 2019 like it is now.
I hope I'm wrong, but if I'm not, you better hope you have an unemotional, data driven plan to navigate yet another financial crisis.
Market Chart Update
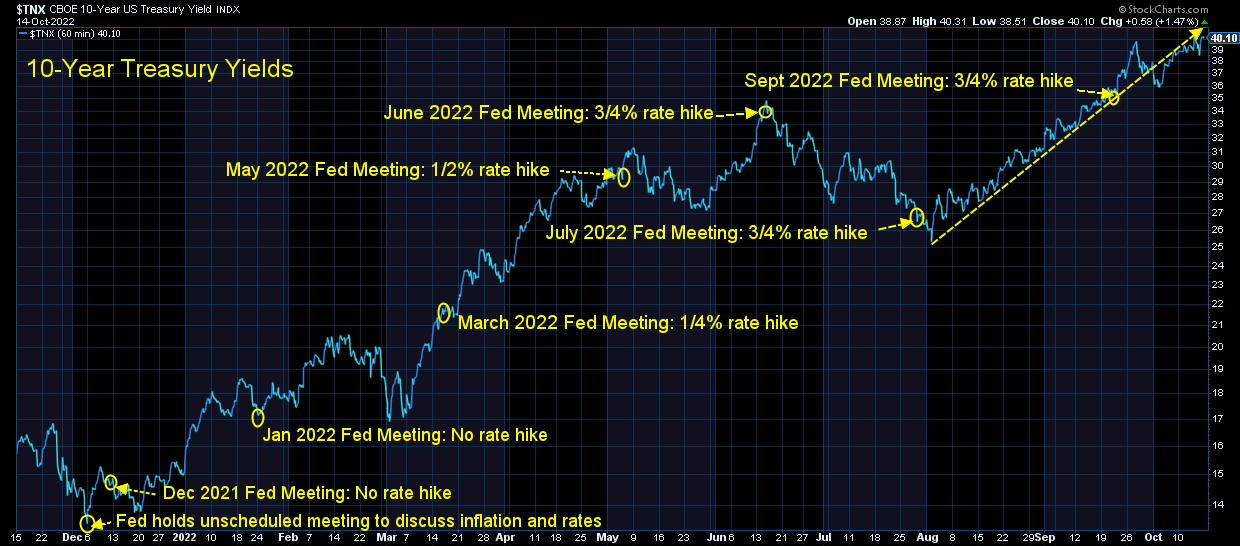
Since we're talking about bonds we'll start there. The steep uptrend was broken last week, but interest rates have resumed their upward climb. Think about this – we started the year with 10-year rates at 1.5%. They are now above 4%. You think any bank, pension plan, or insurance company planned for this and had the proper hedges in place? I don't.
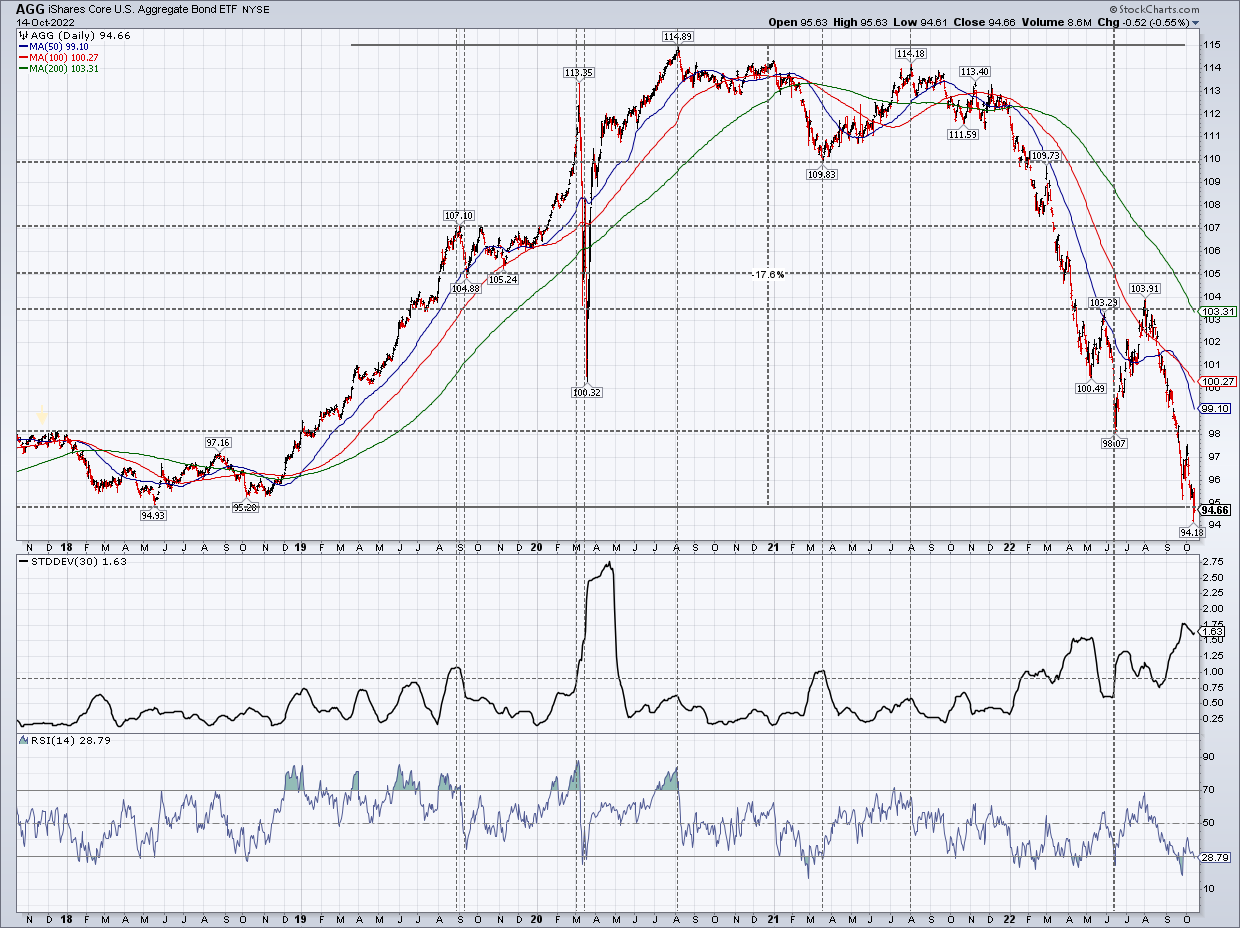
Looking at bonds in general, the Aggregate Bond Index is down over 15% this year. Investors in this asset class which used to be considered "safe" and a "hedge" from losses in stocks have given up four years' of returns. You think any bank, pension plan, or insurance company planned for this and had the proper hedges in place? I don't.
On Friday, the last remaining bit of Aggregate Bond exposure in AmeriGuard and Cornerstone was sold and replaced by 1 year Treasury bond ETFs. This joins 3-month T-Bills and Money Market funds with the "defensive" investments in those models. Right now you are getting 4.4% in 1-year Treasury notes and 3.7% in 3-month T-Bills. The Aggregate Bond index with signficantly more price risk is only yielding 4.0%.
Turning to stocks, the market broke down to new lows following the higher than expected CPI number. The "whoosh" lower was then met with a spectacular turnaround. Reports are there were a large number of S&P 500 put options at the 3600 level. Those were going to expire this week. A month ago the S&P 500 was 15% higher, so what was at the time some very cheap "insurance" became a huge winner for those funds who purchased the protection. They booked those profits, which led the people who issued the option to buy back all the positions they used to hedge their put exposure.
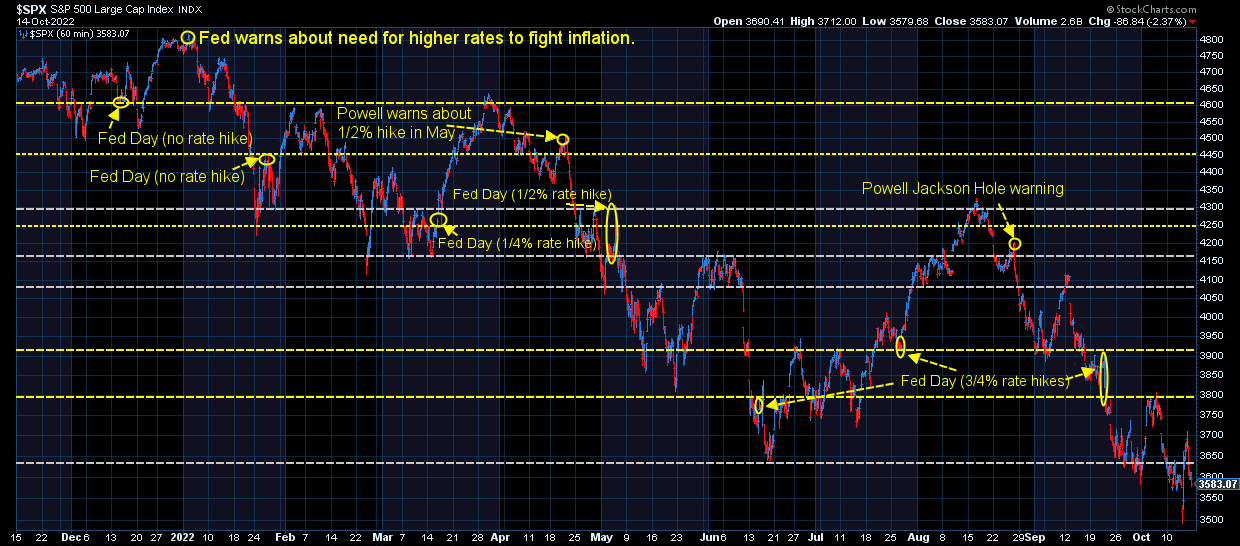
At the same time, 3500 on the S&P 500 is the 50% "retracement" level for the rally off the COVID lows. Many technicians believe when an up-move consolidates and retraces half of the prior move, the excesses were removed and we will see the resumption of a bull market.
It should be noted, we do not use this in any of our systems because we haven't found that it consistently works long-term. 50% retracements can turn into 67% or even 100% retracements. We do have a seldom used "oversold" indicator in one of our AmeriGuard and Cornerstone trend models. It is not quite there, but is getting close. If the market becomes "oversold" and then the indicator moves higher, we would put back to work half of the money we took off the table back in March.
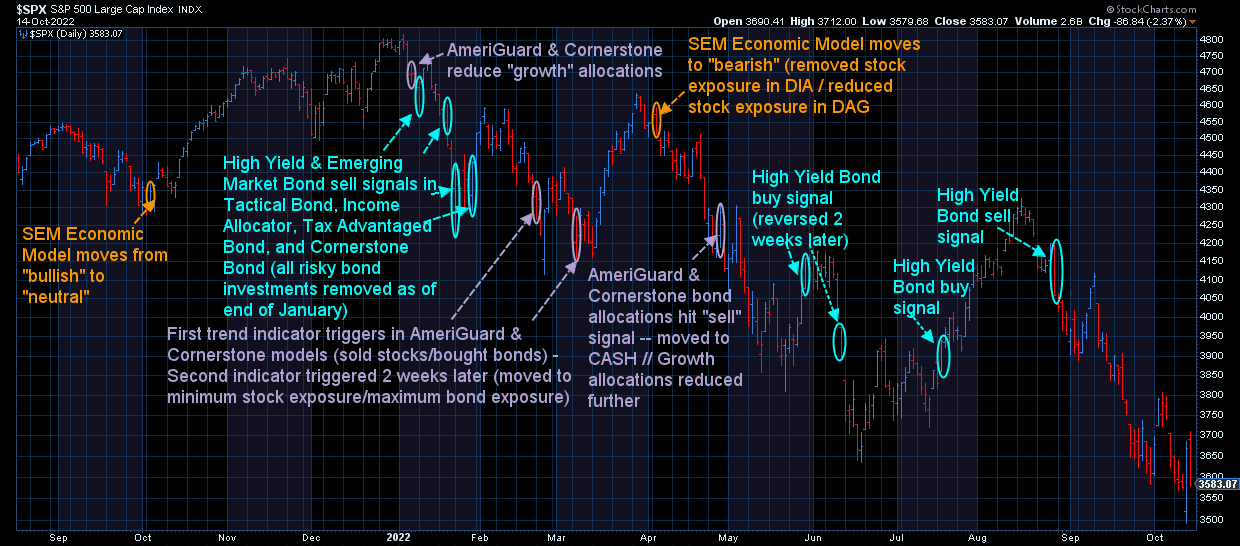
This chart serves as a reminder of how beneficial our quantitative, diversified approach has been for our clients. We've stepped out of the market as each indicator told us trouble was ahead and are ready to step back in as the market (eventually) reverses. No model or indicator is perfect and we will see "bad" signals such as the last two high yield bond buy signals. When that happens, we keep our losses small and retreat to wait for a better opportunity.
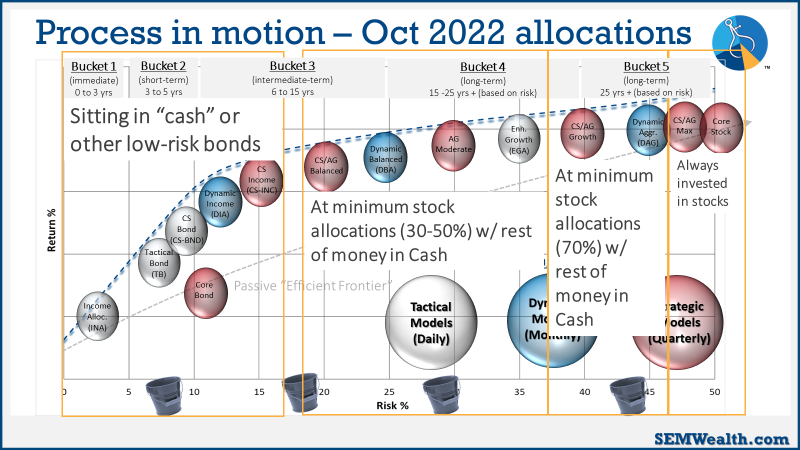
Each model has a predefined "mandate" for how much stock exposure it will have. The models with a "growth" objective are designed for longer-term money. Those with shorter-term horizons have much quicker "triggers. This graphic illustrates how we are positioned.
Follow us on Social Media
While the blog will continue to be the source for deeper dives into everything that is happening, we post a lot more short-form content to our social media channels. Some are funny, some are quick takes on that day's news, and some are answers to questions we've received. Regardless, if you're looking for some different financial content, make sure you are following us. Here's one of the several videos we posted last week:
@finance_nerd Replying to @user0083837392901 we’re not in a recession yet but are heading there. #retirement #economy #recession #financialliteracy #Inverted ♬ original sound - finance_nerd


