
2023 started with forecasts of such a sharp economic slowdown the Federal Reserve would not only stop raising rates but would cut them before the end of the year. As consumers continue to spend money despite high inflation and high interest rates the forecasts have now shifted to no recession in 2023 so long as the Federal Reserve stops raising interest rates. Looking at the (recent) data, you could argue it doesn't matter if the Fed keeps raising rates. Consumers will keep spending money and the economy will keep chugging along.
I truly HOPE that is the case, but my 25+ years' of experience, study of history, and the underlying data says it is not the most likely case. Hope is also not a strategy.
Last week the market had its worse day in nearly a month on GOOD economic data. The concern is if the economy is "too strong" the Fed will revert back to more aggressive rate hikes. What nobody seems to care about is the fact we are going to be running into some massive economic headwinds the back half of the year as the impact of last year's rate hikes fully begin to hit.
I think of our economy as a giant cargo ship. It takes time to get going and it takes time to turn. By the time it gets going in one direction it will take a massive force (and time) to change that direction. When the captain decides to slow things down a bit, the ship doesn't quickly slow. (I picture a ship with no radios and the captain sending a courier down to the bowels of the ship yelling "slow it down by 5%") The captain then sees the ship still moving towards danger so sends his courier again to "slow things down 10%".
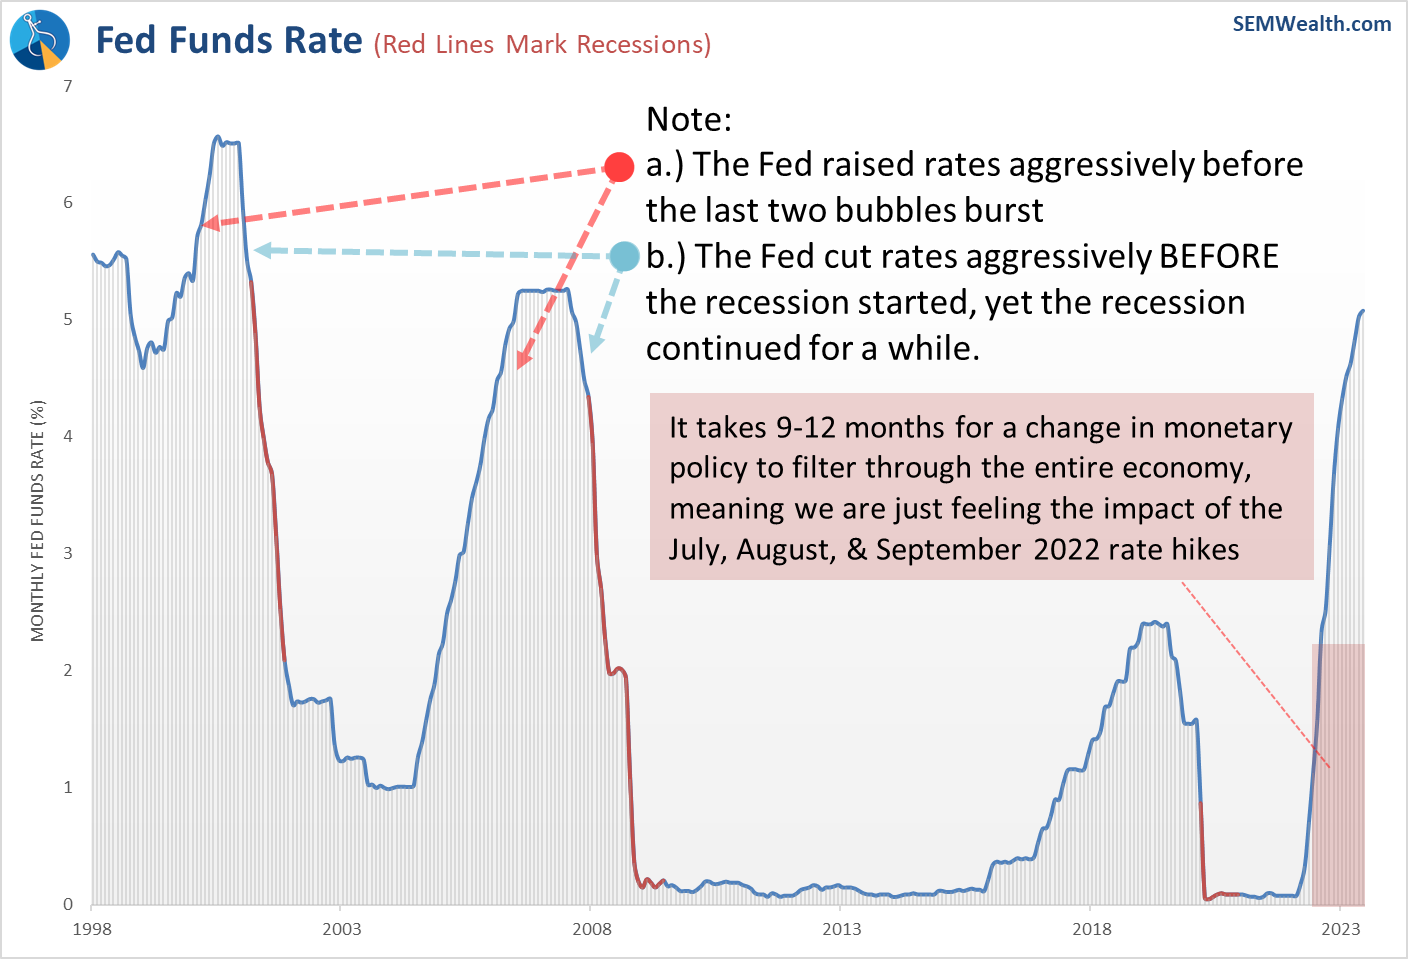
The Fed began to slow the ship down 15 months ago. It takes 9-12 months for one change to run through the economy, which means we are just starting to feel the impact of the rate hikes in June-September of 2022. It was good news the Fed decided to 'pause' last month, but it won't be good news if they resume their hikes. If the economy slows too much (changing the direction of the ship) it will take a massive effort to accelerate again.
This chart serves as a duel reminder about the inability of the Fed to stop a recession by cutting interest rates (because it takes time to turn the 'ship' around) and how many rate hikes we still have to cycle through. A year ago the Fed Funds rate was 1.6%. Today it is 5.1%.
There has been improvement in some of the underlying data. Last year market pundits were talking about a "soft" vs. "hard" landing. They were talking about the Fed's ability to bring inflation down and the impact that will have on the economy. A 'soft' landing would be lower inflation and only a mild economic slowdown. A 'hard' landing is what usually happens – inflation comes down because the Fed slammed us into a recession.
Lately there has been talk of 'no landing' – meaning inflation comes down WITHOUT an economic slowdown. This has never happened in the history of the Fed, but that doesn't mean we cannot see it happen (temporarily) this time around. We've dealt with unprecedented Fed (and Congressional) policies the past 15 years so it would make sense if we had an unprecedented ending to the Fed's inflation fight.
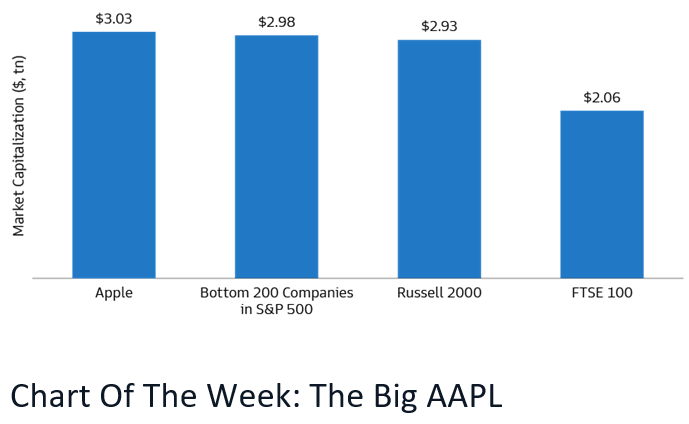
We've learned to not let our opinions about what SHOULD happen influence our decisions. Our brains get excited about "unprecedented" outcomes and then trick us into believing we have a "new era". Mathematically it is impossible for the Fed (or Congress) to engineer a way to never have a recession again. Likewise, not all companies can be winners. It's a zero sum game. Somebody has to pay for all of the debt used to generate this "unprecedented" economy and when one company (Apple) becomes bigger than both the smallest 40% of the S&P 500 combined and the 2000 smallest public companies the overall economy is hurt. We need recessions and we need competition or our economy doesn't function.
Speaking of Apple, Goldman sent me this over the weekend:
This means sticking to our models and letting the "animal spirits" and euphoria run. This is the point of maximum risk and trashing models which have led to our 30+ years of success would be a mistake. Our economic model was developed in 1995 with only one addition since then – the Service Sector Business Activity index, which wasn't created until the early 2000s. This means we've gone through past "new eras" in the late 90s. It also uses data going back to 1947 & 1960, which means we've seen all kinds of "new eras" in our data.
For more check out our latest quarterly newsletter, which included some 'bonus content' discussing performance of our models:
For now, the economic data remains suspect, which means there is still a higher chance of a recession than not. This means the optimistic earnings forecasts are likely too high. Higher than normal valuation levels are ok if growth is stronger than expected. If growth ends up weaker it is the highest valued stocks which get hit the most.
Given all of that, here is where our economic model stands as we start the second half of the year:
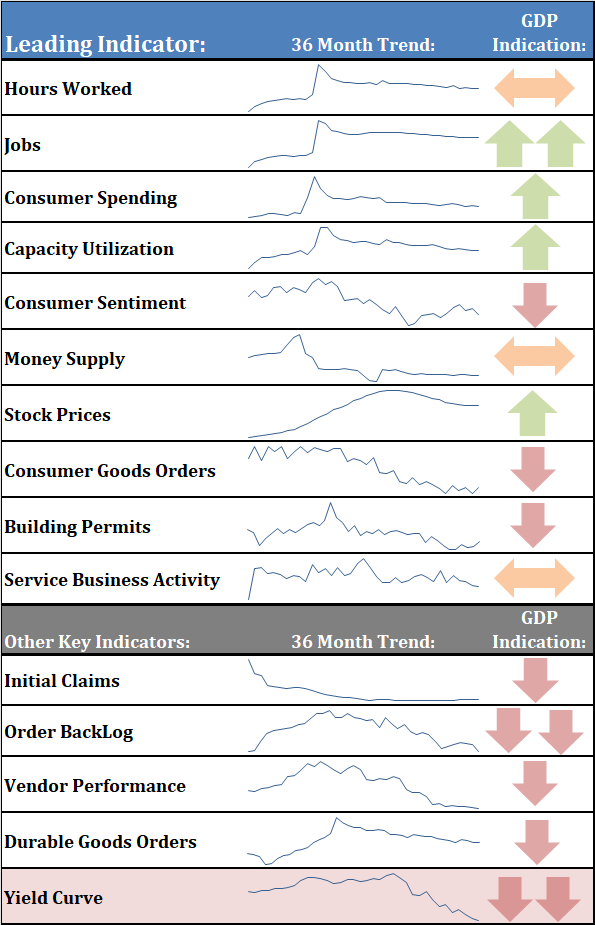
Note: our dashboard is sorted by the highest to lowest "R-squared" readings. If you'll recall from your statistics classes, this is a reading of how well the data "fits" the model, in this case economic growth over the next year. All of our indicators have an R-Squared above 50%, which in statistical terms is a "strong" predictor.
This month, we'll take a look at the top 5 indicators since they are the ones (mostly) still pointing to a 'no landing' scenario.
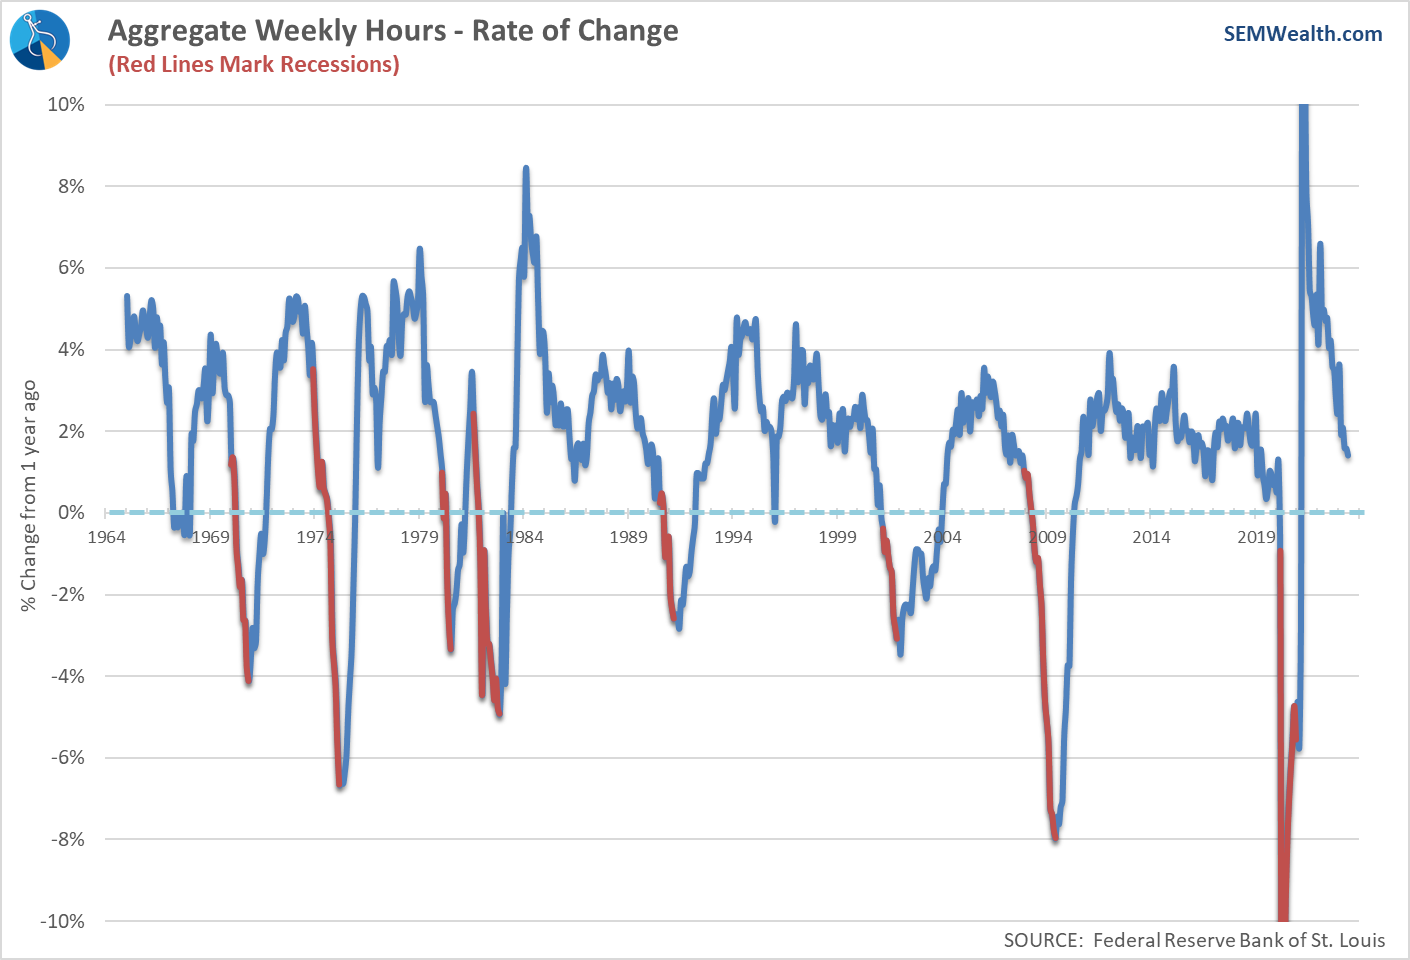
Hours Worked sending a warning
This is the top indicator on our dashboard for a reason. Employers will add hours before they hire and cut hours before they layoff. Over the last few months, this indicator has started flashing a warning.
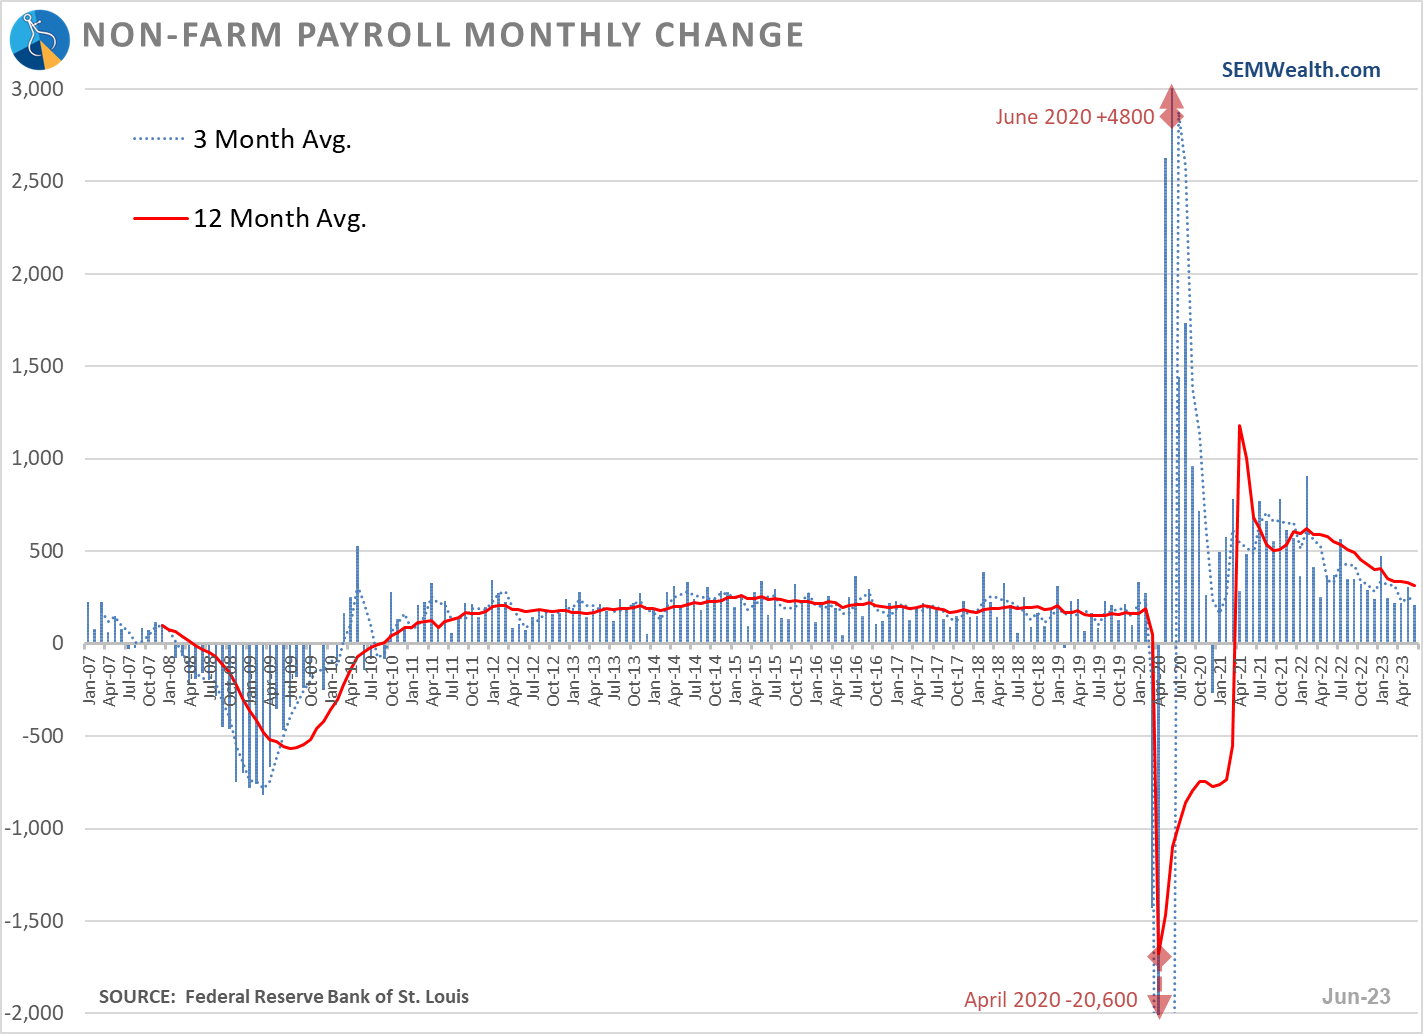
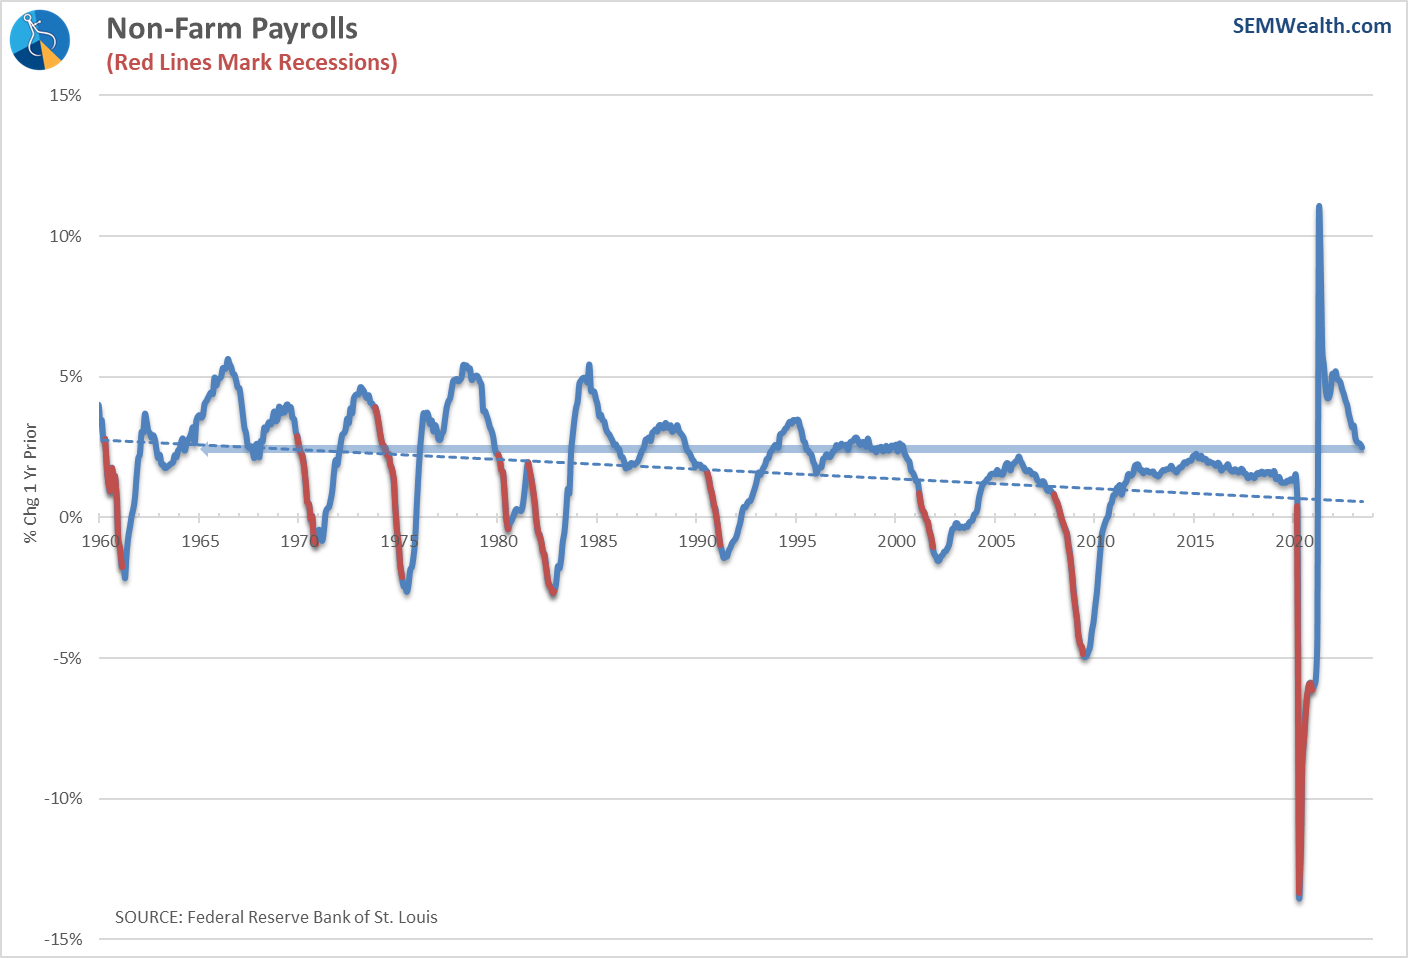
Jobs strong on the surface, but.......
I won't go into the details of the issues we have with the payrolls numbers. There are no conspiracies, it's just hard to measure how many people are working. The 'official' numbers show continued strength (as expected the May numbers were revised lower last week). We still have a strong labor market overall as our economy adjusts to the post-COVID environment.
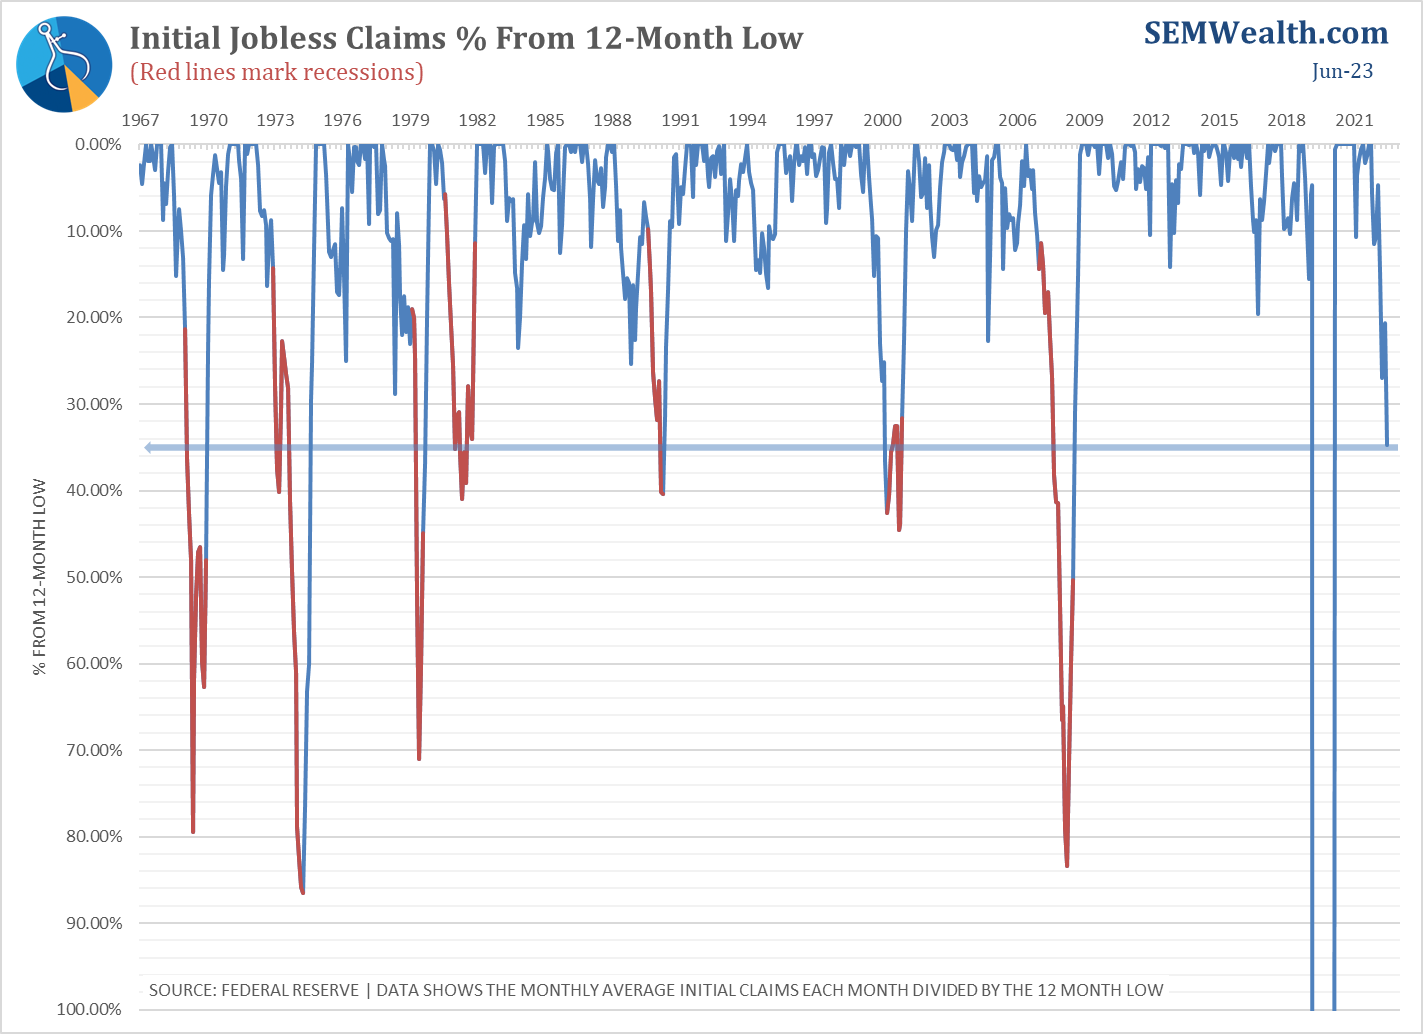
However, the initial jobless claims numbers which tend to be both more accurate as well as more timely are saying the labor market is at risk:
Consumers still spending like crazy (but using debt to finance it)
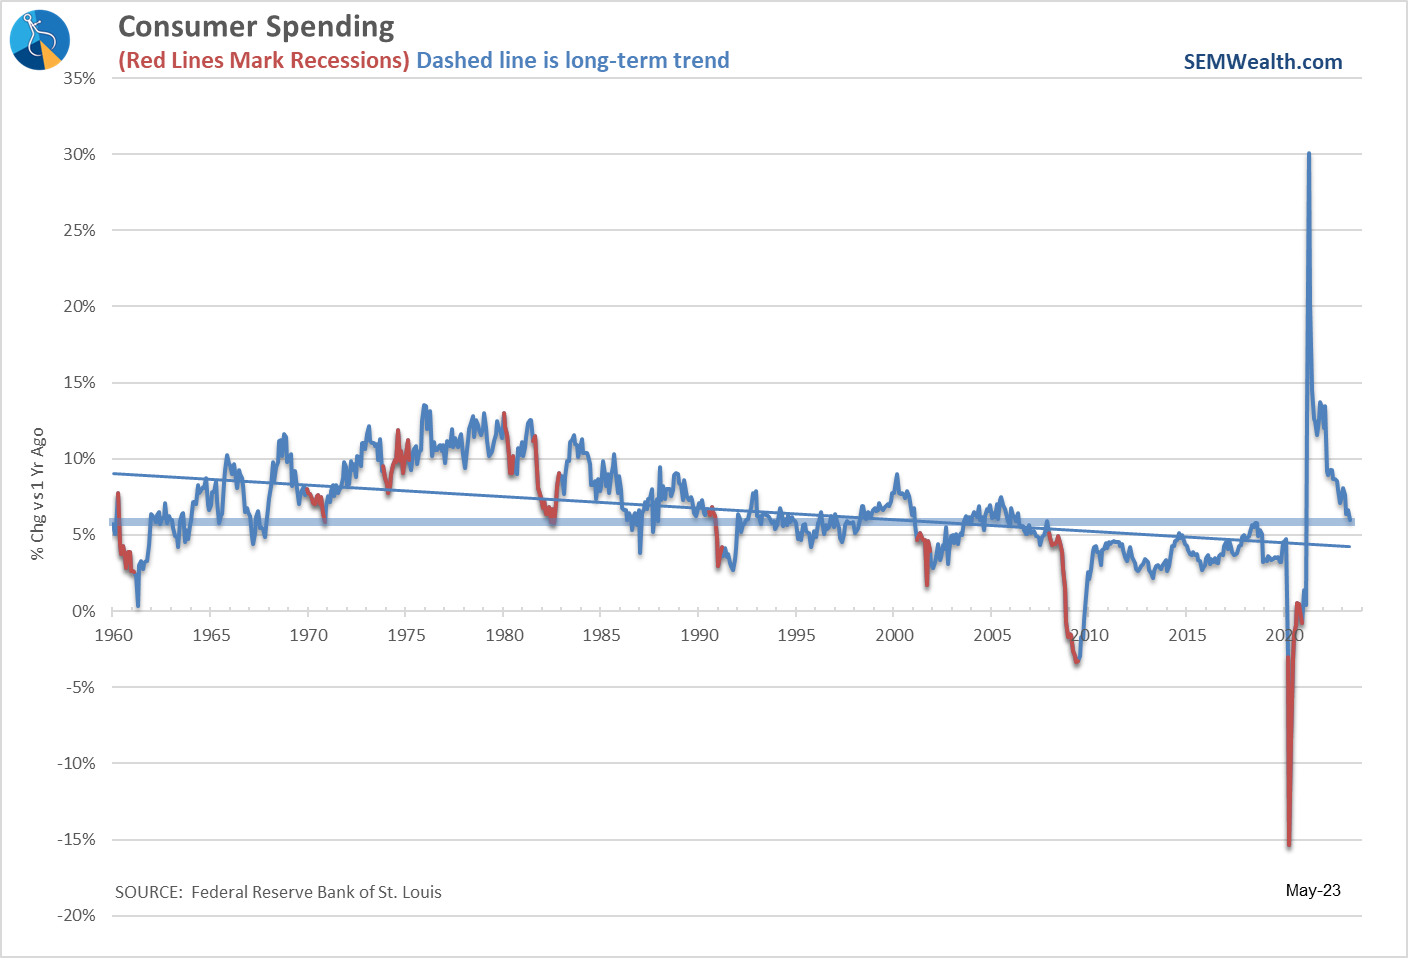
I like to use this chart for perspective. I wish the Fed had done the same thing. It is easy to see by the time the 3rd stimulus check hit consumers were back 'on trend' which should have led the Fed to stop stimulating the economy (and Wall Street). Instead they waited another year before deciding to slow things down.
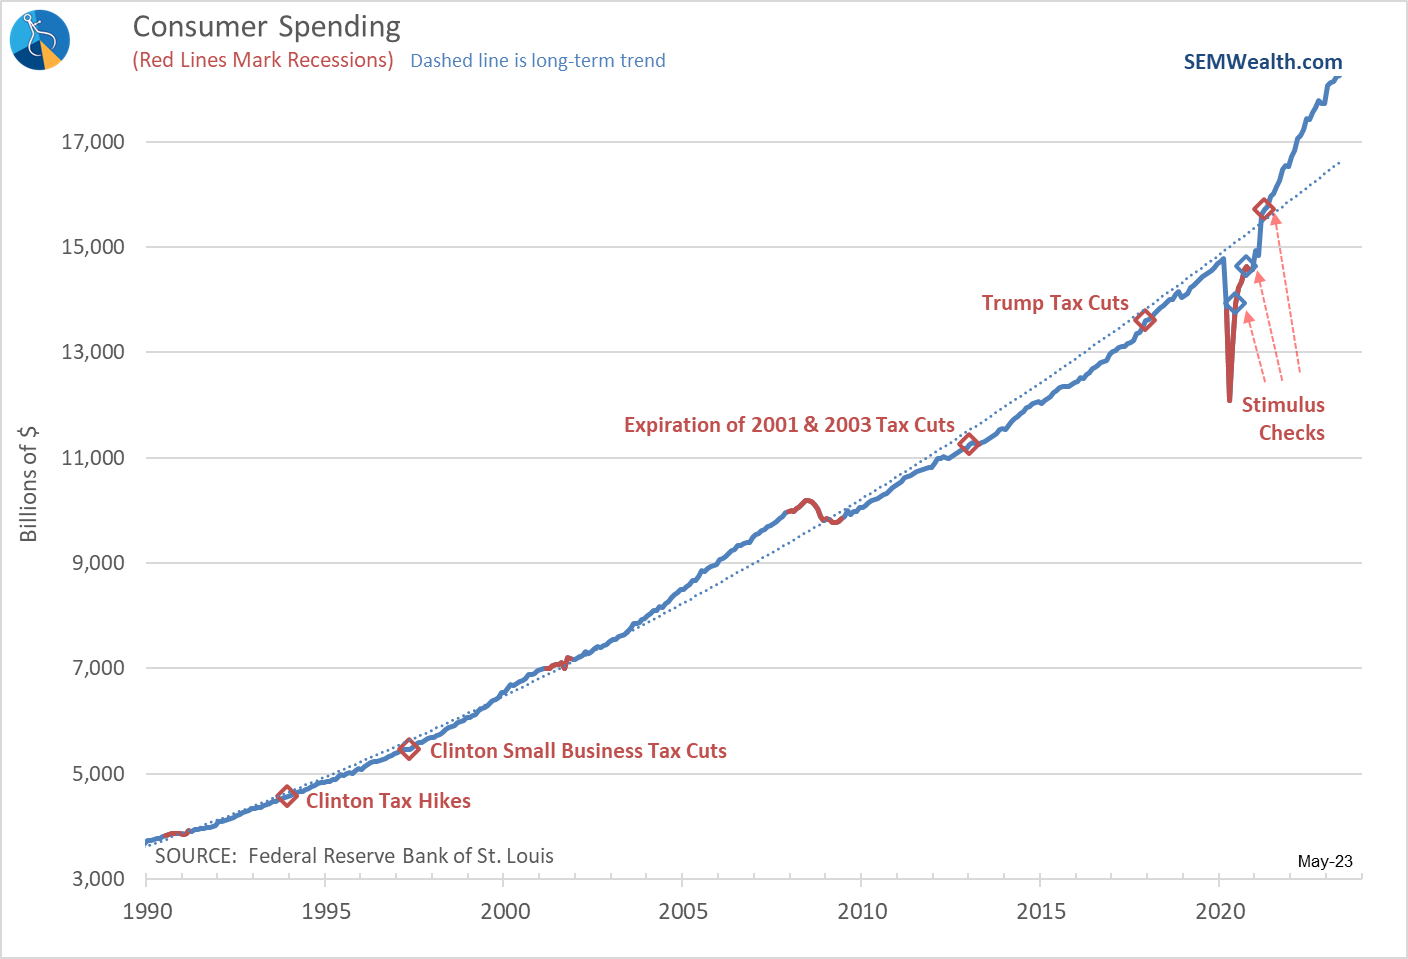
The trend in spending has slowed. Given interest rate hike impacts this could be a problem soon.
One of the 'benefits' I mentioned during the pandemic was the use of stimulus money to pay down credit card and other debt. We also couldn't go out and spend money on a lot of things so didn't use our credit cards as much. That 'benefit' is apparently over and Americans now have more credit card debt than before the pandemic. Remember, interest rates were about 3% LOWER before the pandemic than they are today.
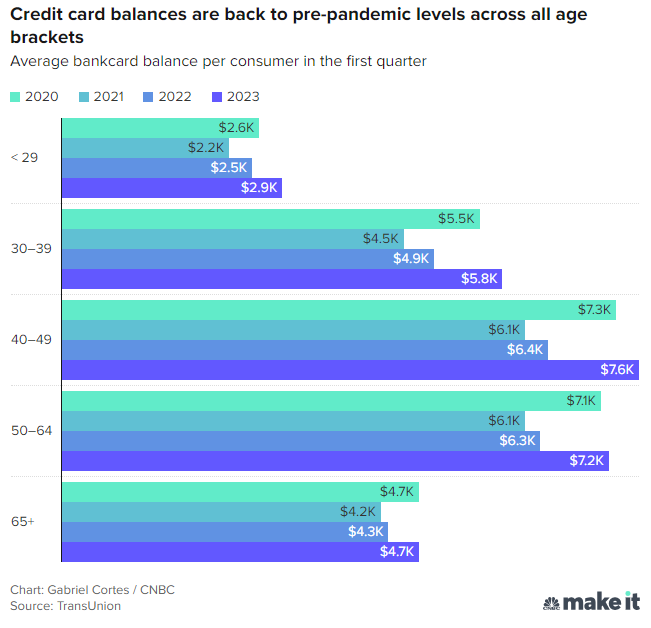
As I said at the outset, somebody has to pay for all the debt used to generate this "unprecedented" growth.
Capacity Utilization – a pleasant surprise
Everyone who has been reading this blog should know I don't like talking politics. It is a necessary part of the job and I try to use my Independent position to look at the pros and cons of both sides. For whatever reason, our readers, clients, and advisors tend to lean more conservative so throughout the last three years I've had the uncomfortable position of defending (some) of the spending bills coming out of the Biden administration.
I hated the name "Inflation Reduction Act", but I did remind our advisors and readers at the time that there were some parts of the act I liked – namely the focus on bringing back jobs and manufacturing to the US. Various other spending bills included money for infrastructure, high speed internet, microchip plants, and other things that if done right could help our economy enough to offset the debt. (Other provisions were just downright wasteful in my opinion, which is what many people focused their attention on.)
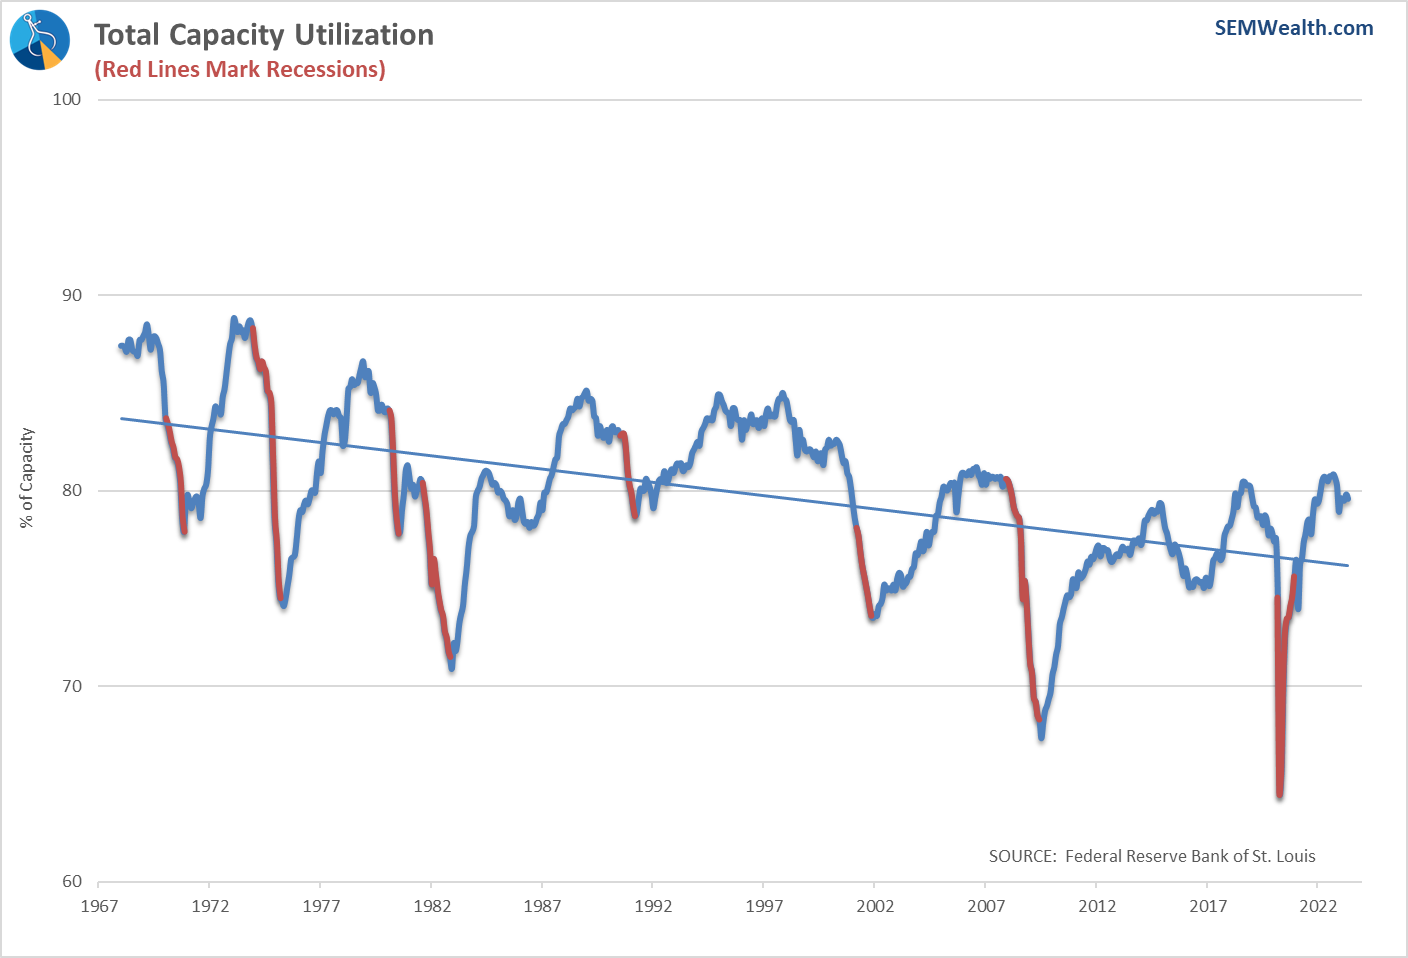
From a fundamental point of view the only way to grow our economy long-term is to put more people to work or make them more productive. This is how I look at any spending bill from Congress (or within my own state). If it doesn't do those things, it is wasting money. While it is early, we are starting to see the benefit of the "good" parts of these acts, starting with one of our better leading indicators Capacity Utilization.
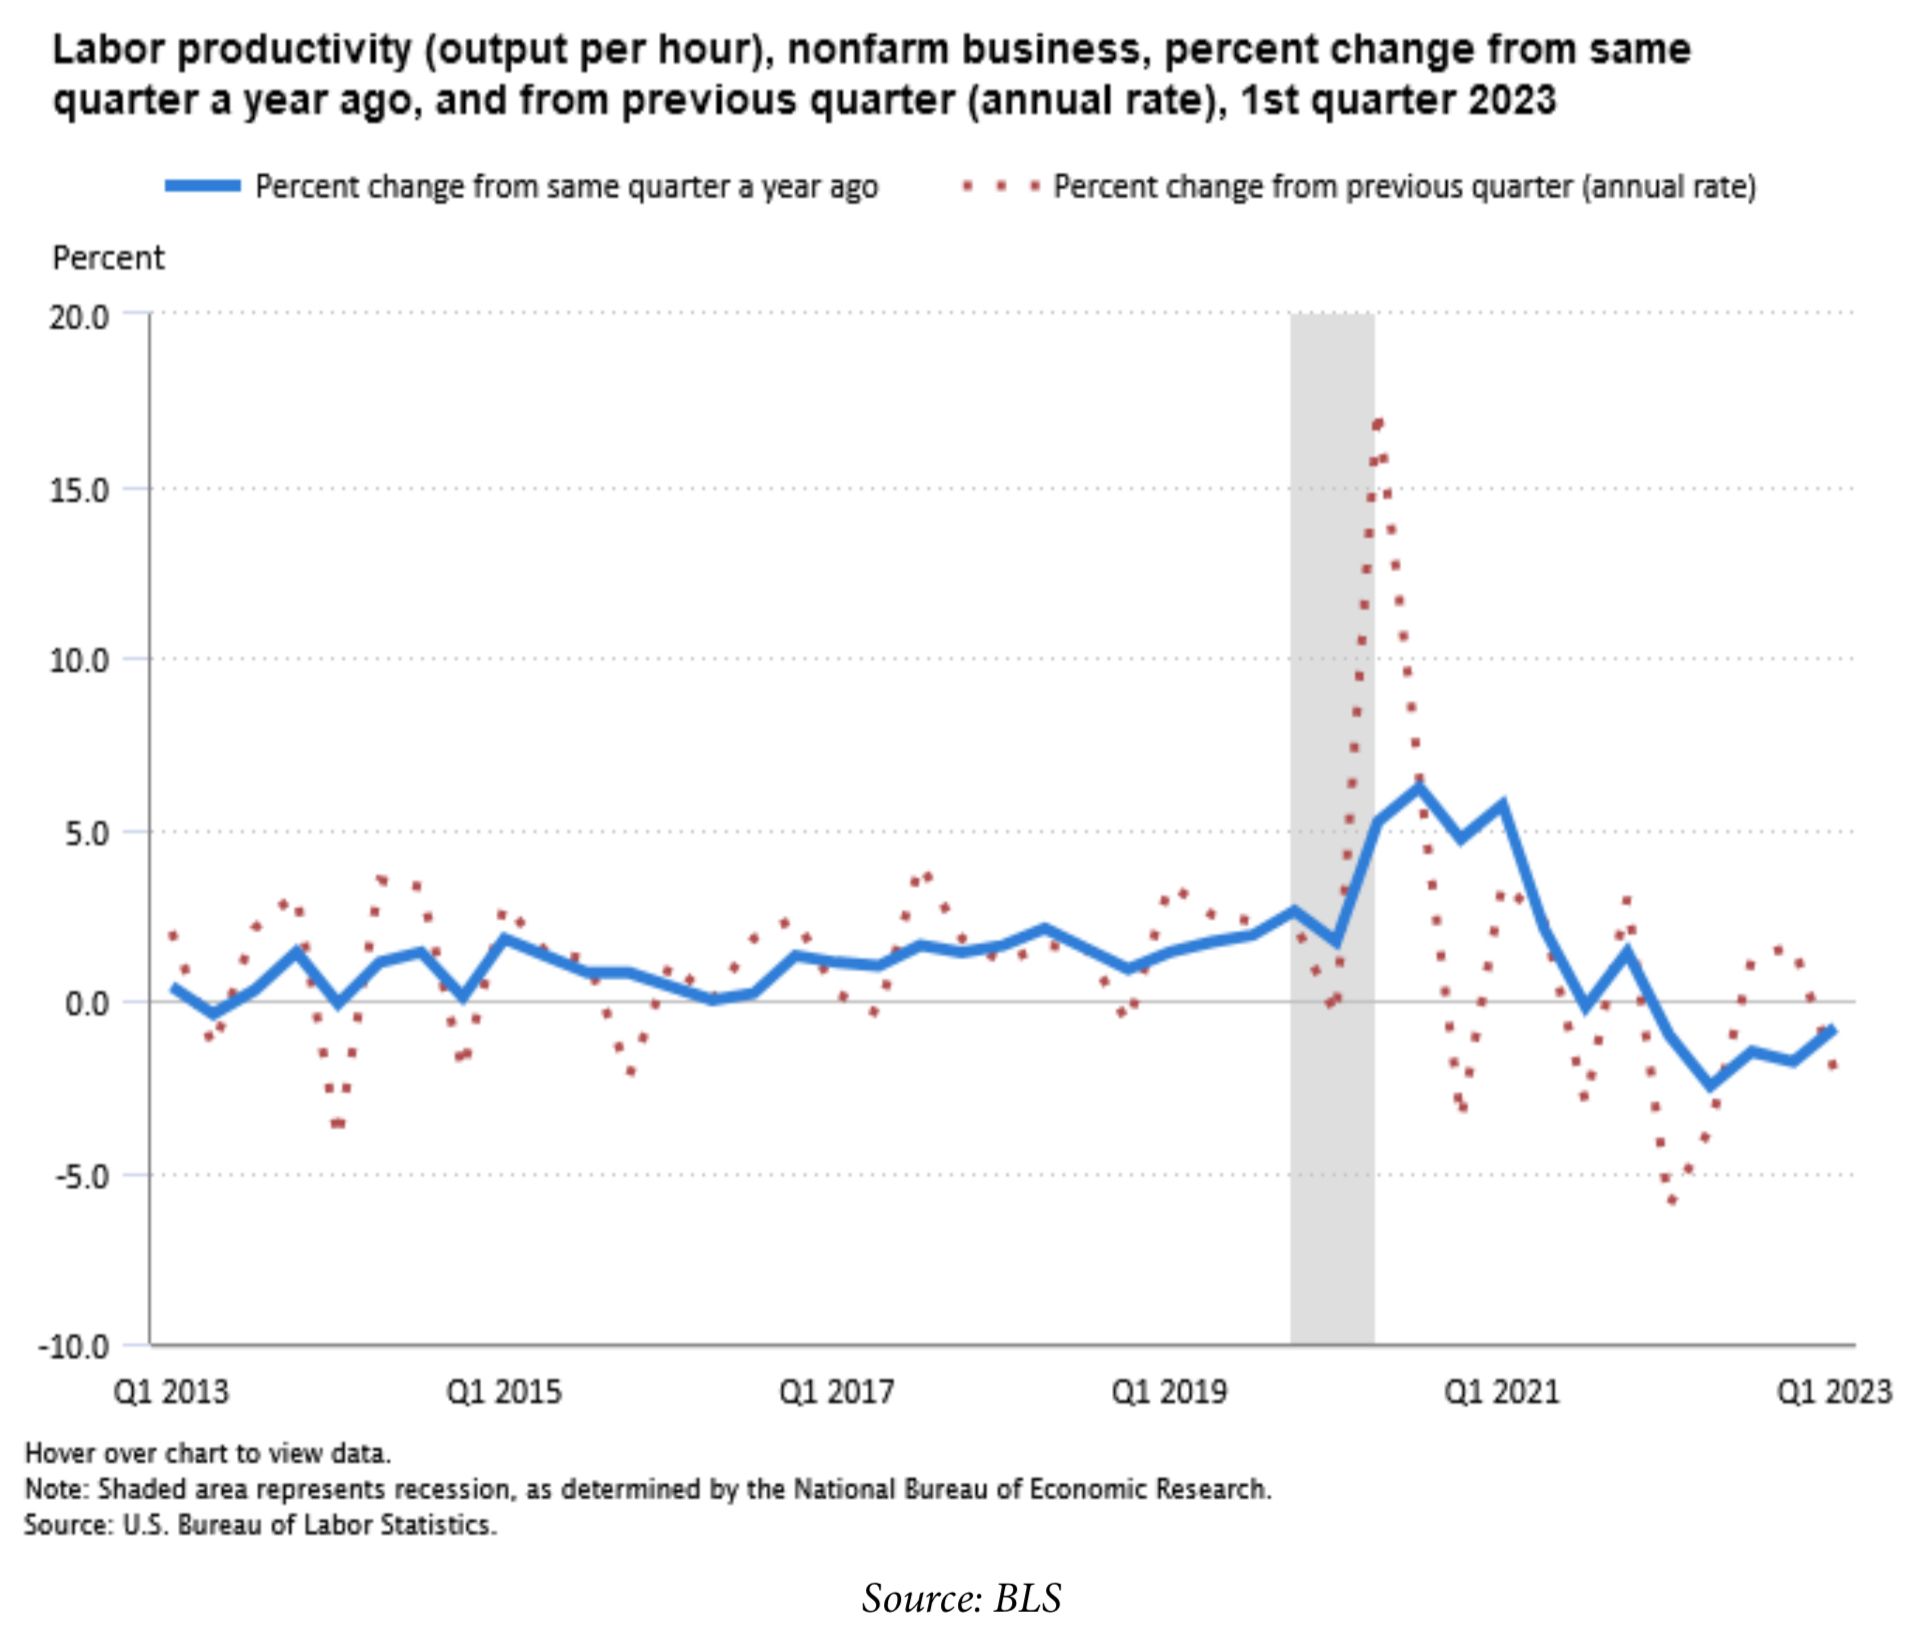
In addition, over the last 3 months, labor productivity has been improving. It takes time to train workers in new jobs at new factories, which short-term is a drain on productivity. This is one of the first charts I look at each month when it is released.
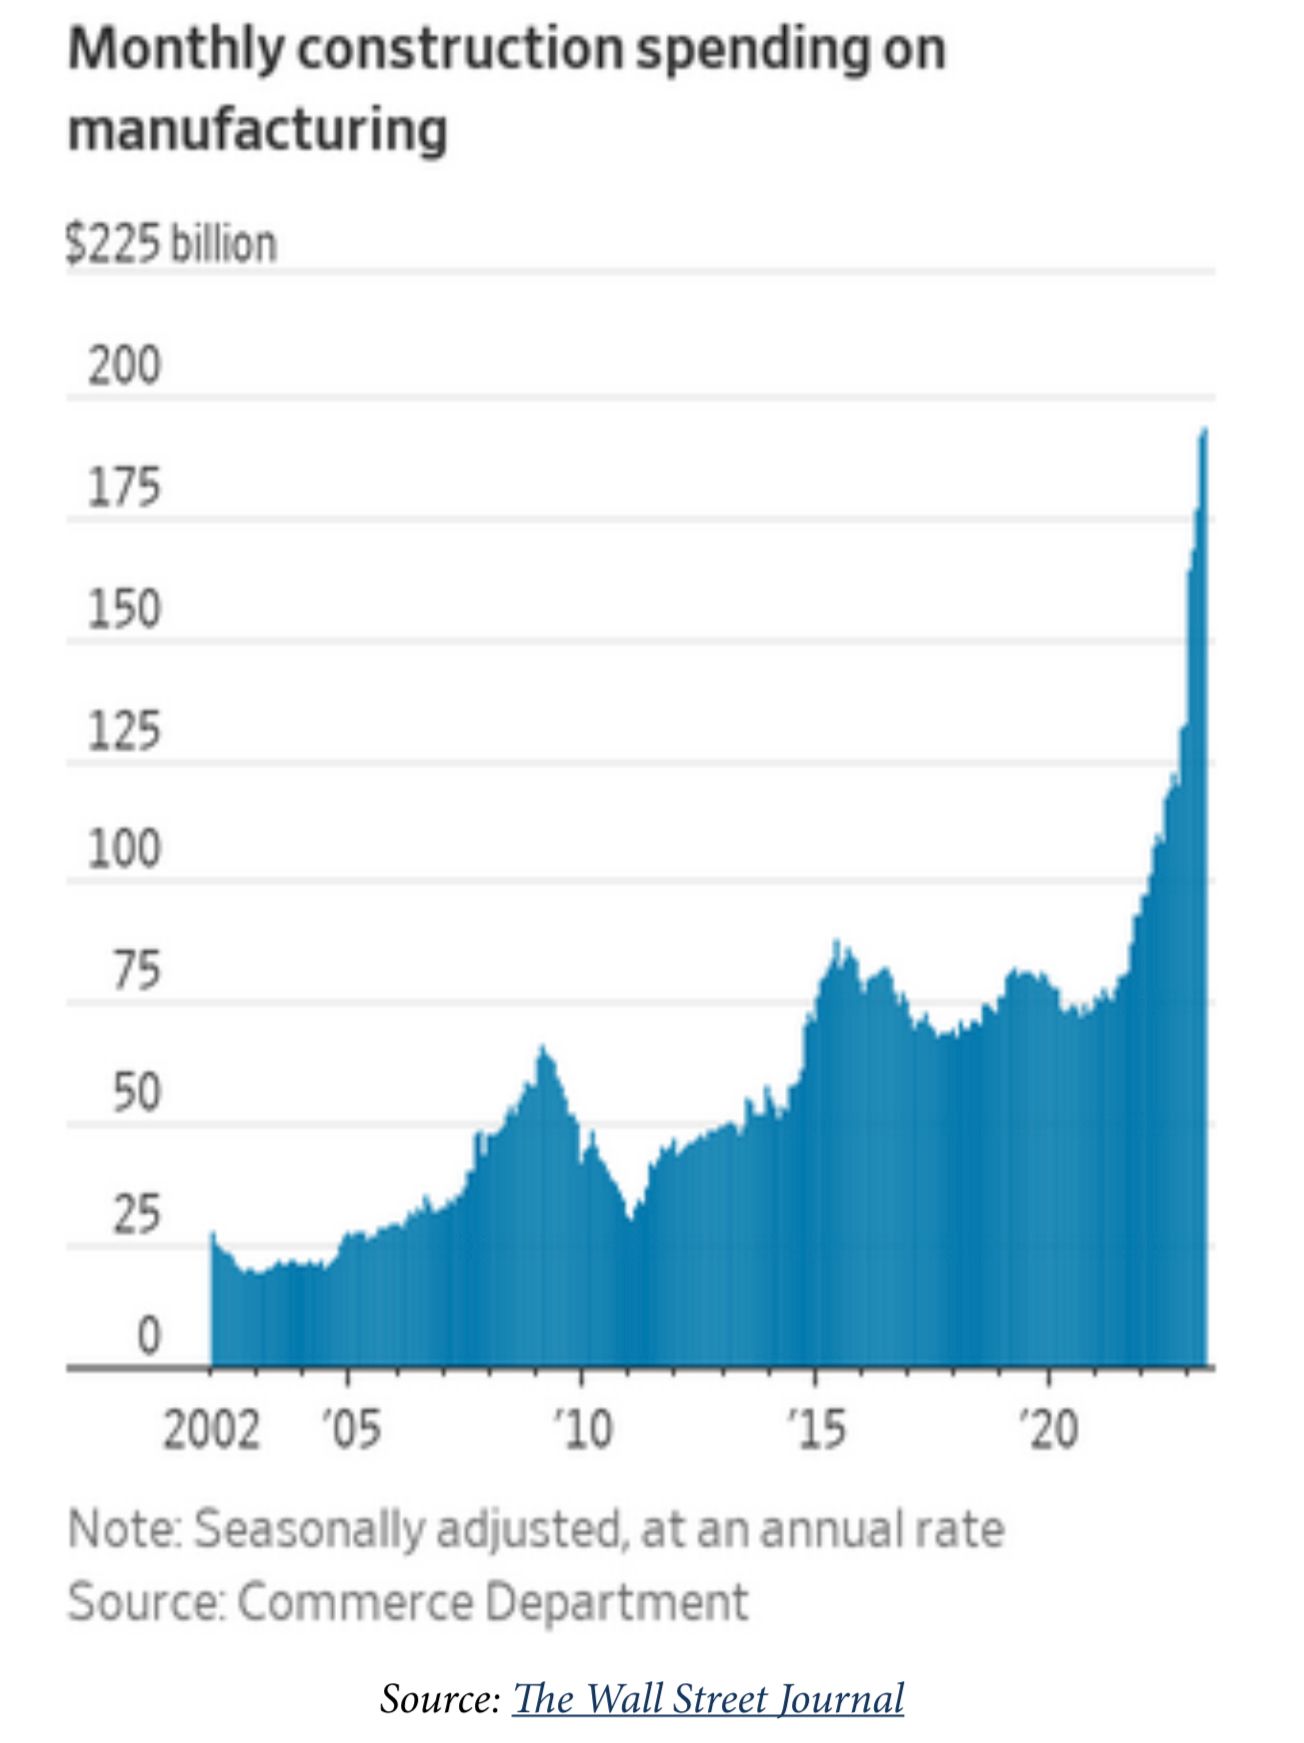
More importantly, we are seeing a huge surge in Construction Spending, which should lead to more STABLE, LONG-TERM growth.
Good economic policies which put more people to work, make them more productive, or preferably both should not be political. Both sides should do more to focus on this goal.
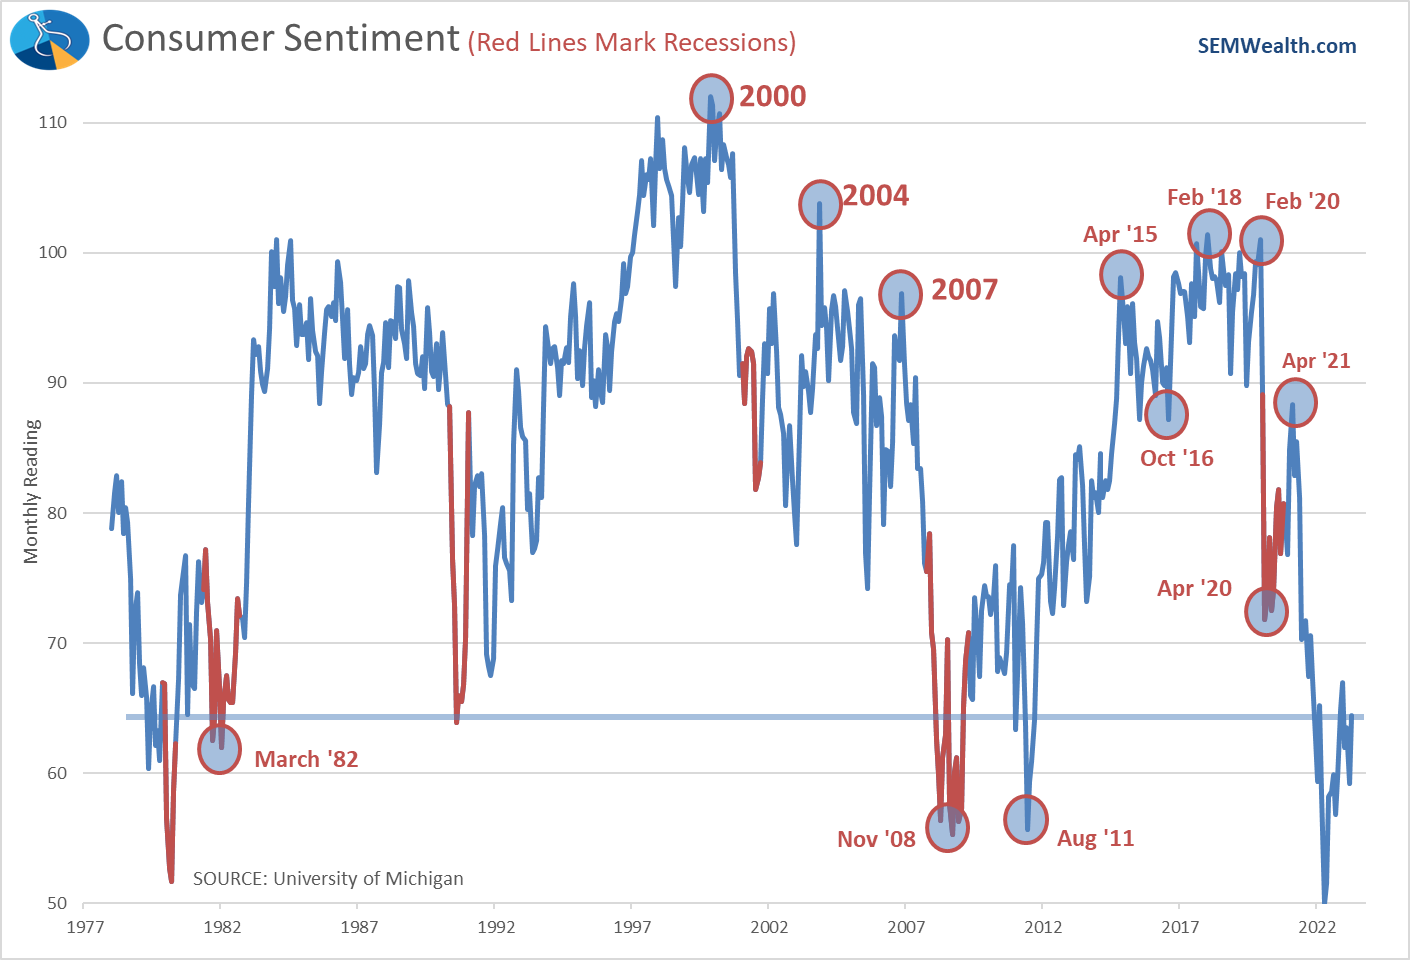
Consumer Sentiment doesn't match Spending
I've watched the consumer sentiment readings, which is basically a question to Americans about how they "feel" about the current and future economic environment. Spending data shows everything is great. Sentiment, however shows much less optimism.
A lot of this may be the skew in spending levels. The "sentiment" is the measure of the average American. It isn't influenced by how much they have available to spend. The spending data is based on the AMOUNT spent. Obviously those with more money are able to spend more and throw the data higher. This chart shows the divide in spending since the beginning of 2020 between the top 20% (red) and the bottom 20% (green). The average is in blue.
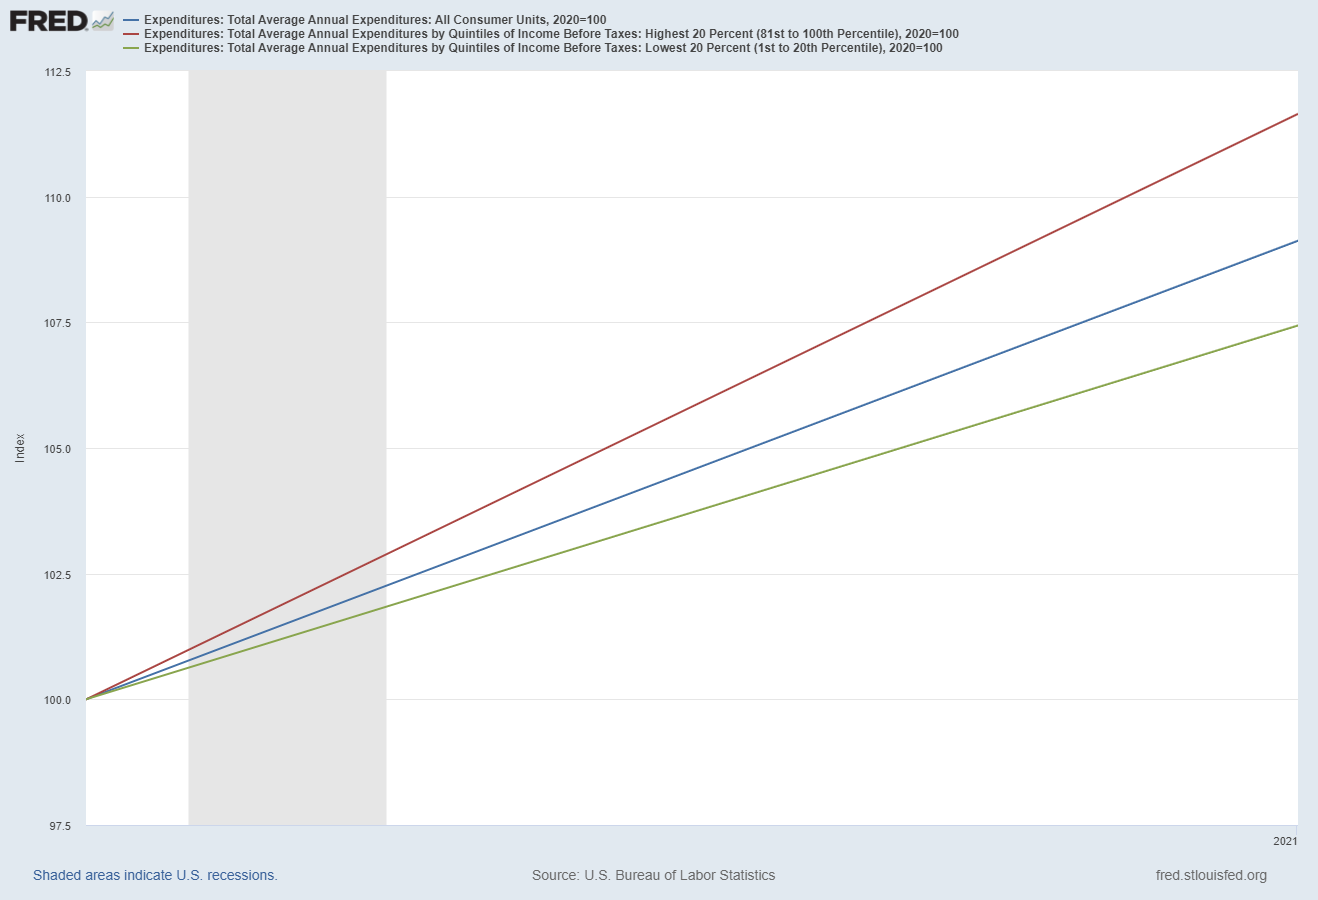
The top 20% has increased spending by 12% since the beginning of 2020, while the lower 20% has increased it just 7%. When you look at the dollars spent, you see the big gap.
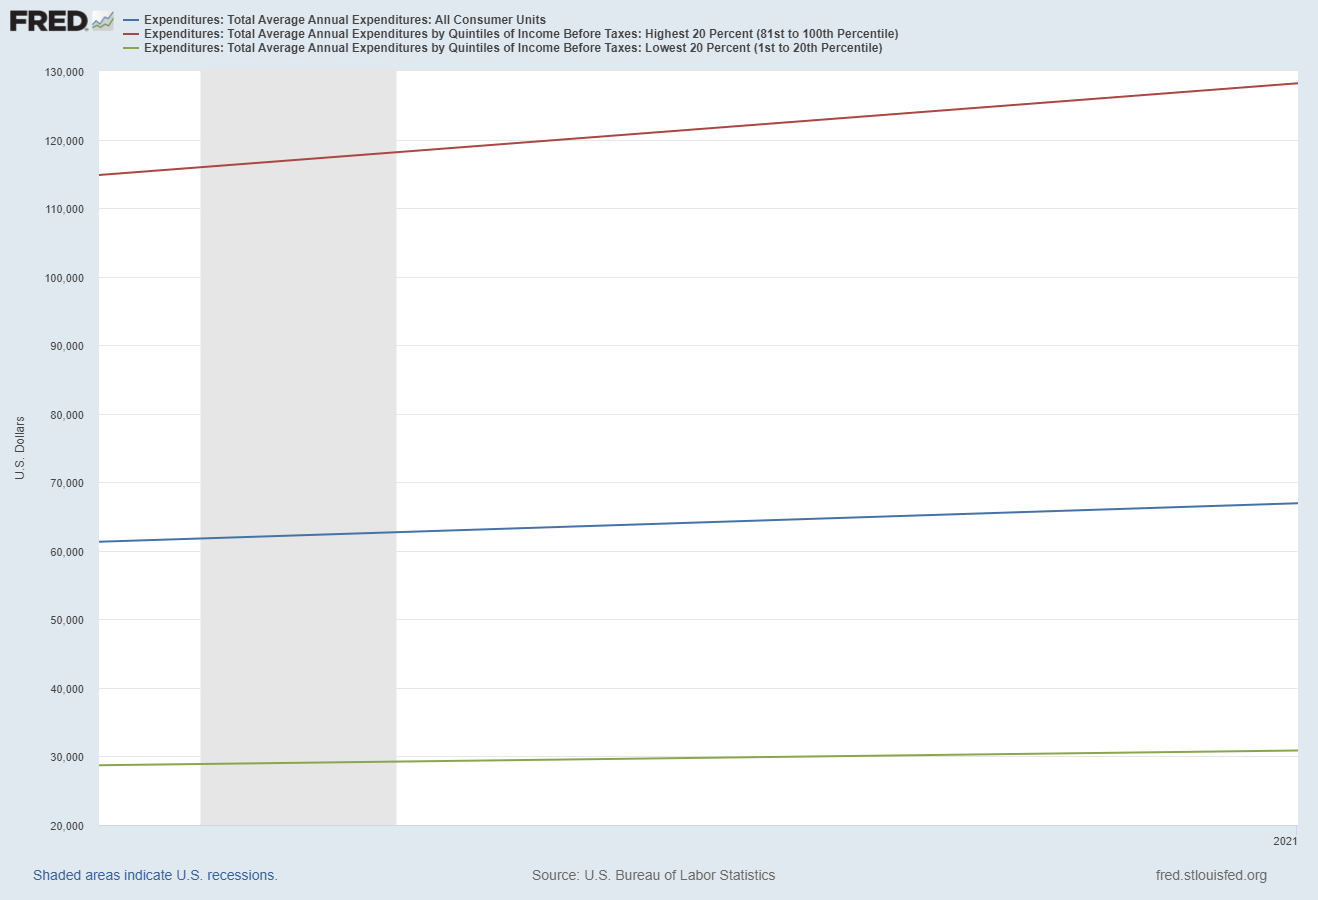
From an economic perspective you need to have a thriving middle class to grow your economy long-term. The sentiment data says the average American is not optimistic which will likely be a drag on overall spending soon.
Model Still Pointing to a Slowdown
Overall, if you look at our model (which factors in the above indicators at different weights) the trend is still down. The short-term term estimate does show the improvement in some of the indicators, but not enough to change the course of the economy.
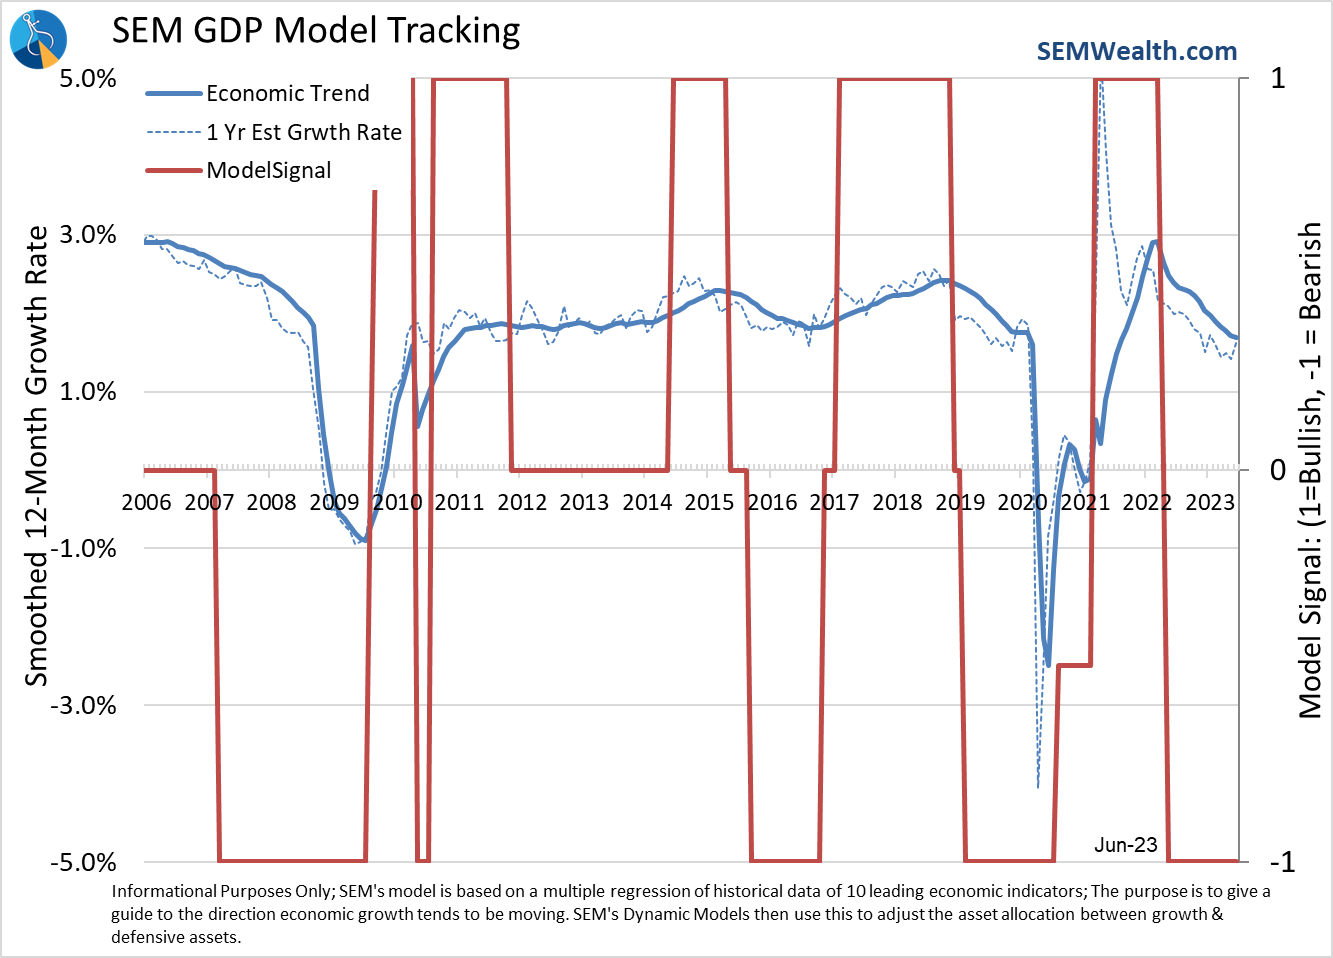
This means our "dynamic" models remain defensively positioned (for now).
Market Update
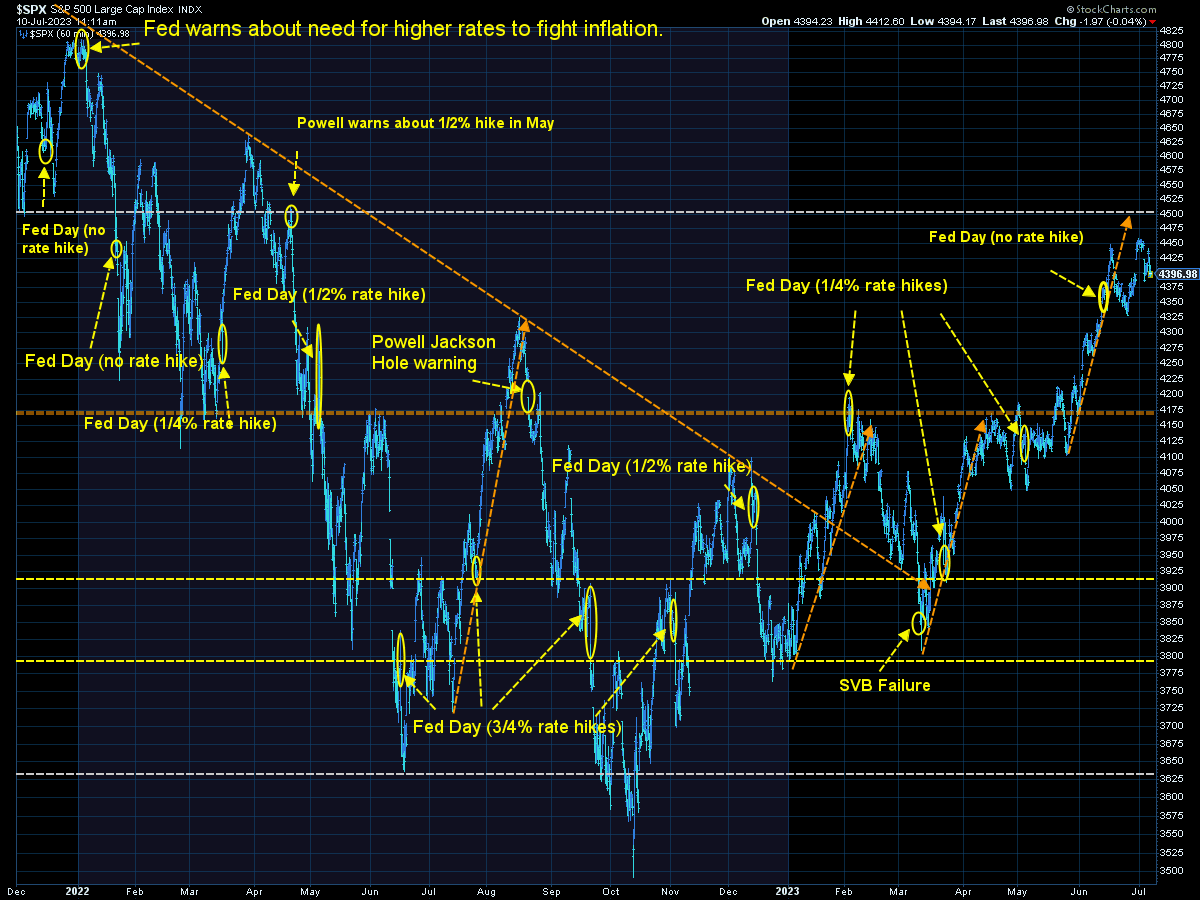
Despite the big drop on Thursday, stocks were only modestly down for the week. It's too early to tell if the latest stampede higher is ending with another 5-10% correction of if stocks regain their footing and resume the party.
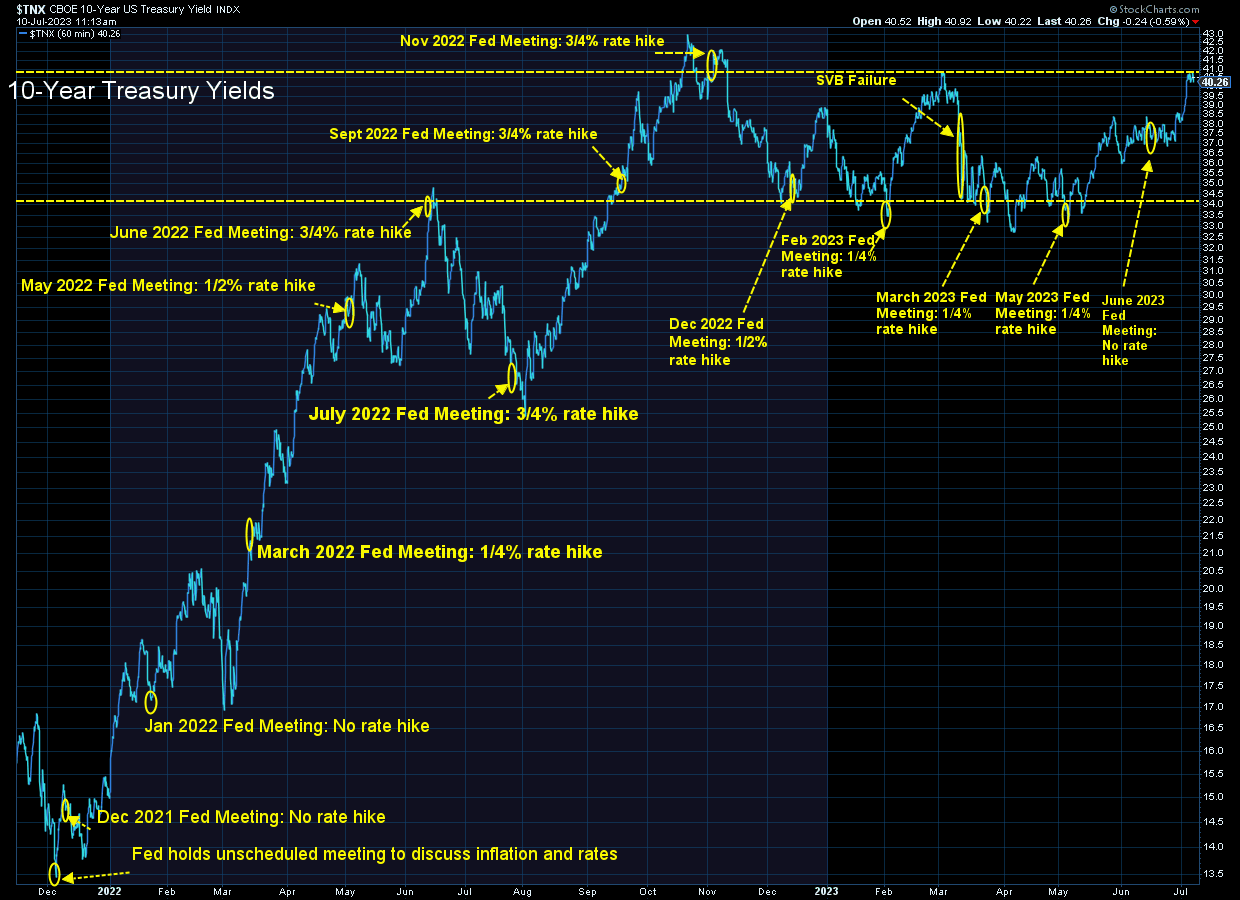
Bonds on the otherhand had a terrible week, with rates on 10-year Treasuries blasting above 4% once again, the highest levels since early March. As I've said throughout the last 18 months, when the bond market fears the Fed has lost control of inflation rates go higher. When they are confident inflation is in check, rates go lower. Right now it is apparent the bond market does not have as much faith in the Fed as the stock market.
SEM Market Positioning
While all of the things above are certainly on our radar, we remain heavily invested. The key difference between our advice to readers and our own investments is we have a quantitatively based plan to leave the party when things start to look shaky.
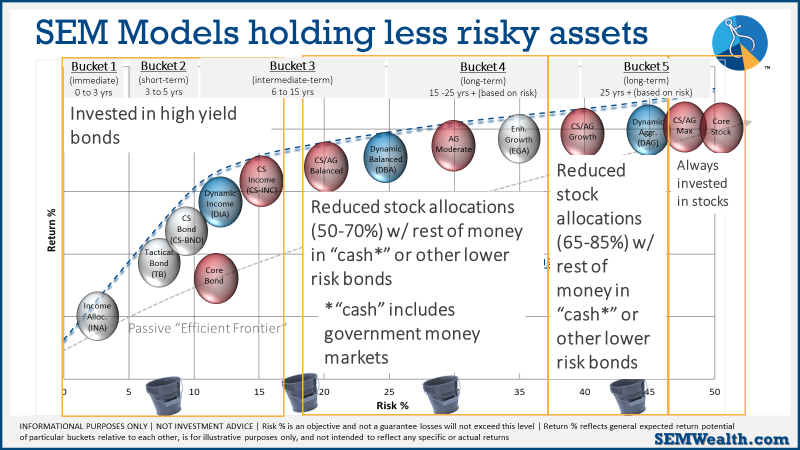
There were no changes (again) last week in any of our models. We remain mostly invested in high yield bonds in Tactical Bond, Income Allocator, and Cornerstone Bond. We remain "bearish" in the Dynamic models (reduced risk exposure based on our economic model), and right in between minimum and maximum exposure in our 'strategic' models.
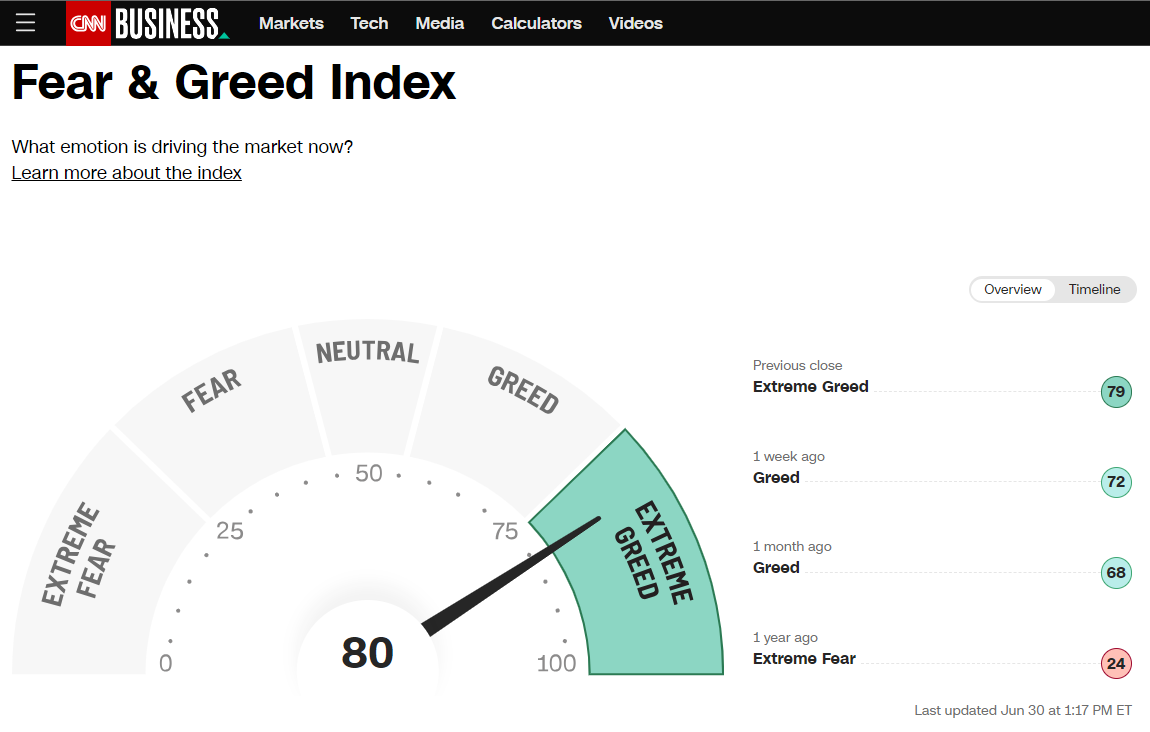
Our high yield model, is once again close to a "sell" signal. The other "trend" indicator which determines the overall asset allocation in our AmeriGuard and Cornerstone models needs to see either the 'breadth' of the rally to broaden out or a pull back to ease the current overbought "greedy" environment.
This chart summarizes where we are as we enter the week:
As always, our models will change if the environment changes. For now, calculated, short-term risks are acceptable with the knowledge things could change quickly.
No matter what happens, our models are designed to monitor the overall TRENDS. If Wall Street gets concerned, they will tell their largest clients and we will see trends change in the market. Regardless of the reason, we only care about where the money is flowing (both in and out).
We are already in the heat of the election and it's only going to get more heated. With that I will continue to close with my primary piece of advice during times like this: