
This week feels like one of those moments where the headlines are pulling your attention in five different directions at once. From a potential frenzy around SpaceX, talk of (again/finally) “ending the war” creeping back into markets, and a steady drumbeat of capital raising that quietly tells a different story about where we are in the cycle. It is easy to get caught up in the excitement or the noise, but underneath it all the drivers that matter most have not changed. Interest rates and inflation continue to set the tone, even if they are not getting the same attention. So instead of chasing each headline on its own, it is worth stepping back, connecting the dots, and asking a simpler question: what is really changing, and what is just the same-old story being repackaged? Here is how we are thinking about it, and how SEM is positioning portfolios in the middle of it.
A Quick Word on the SpaceX Frenzy
We’ve had a few questions come in about clients wanting to go all-in... specifically using 100% of an IRA to purchase SpaceX the day of the IPO. More than a "few" have asked about taking a 5-10% stake in SpaceX.
I get the excitement. This has all the makings of a “next Google” type story. But stepping back, this is a good example of where discipline matters more than hype.
While we don’t do individual stock recommendations and it's been since the last tech bubble that I spent my days doing fundamental stock analysis, we’ve seen enough work from analysts we trust to be cautious here. Not because SpaceX is a bad company, but because the setup introduces a level of risk that just doesn’t fit inside our typical, risk-averse clients.
So whether 5-10% or 100% of an account is being considered, here are a few things worth thinking about:
1) Valuation is already pricing in perfection
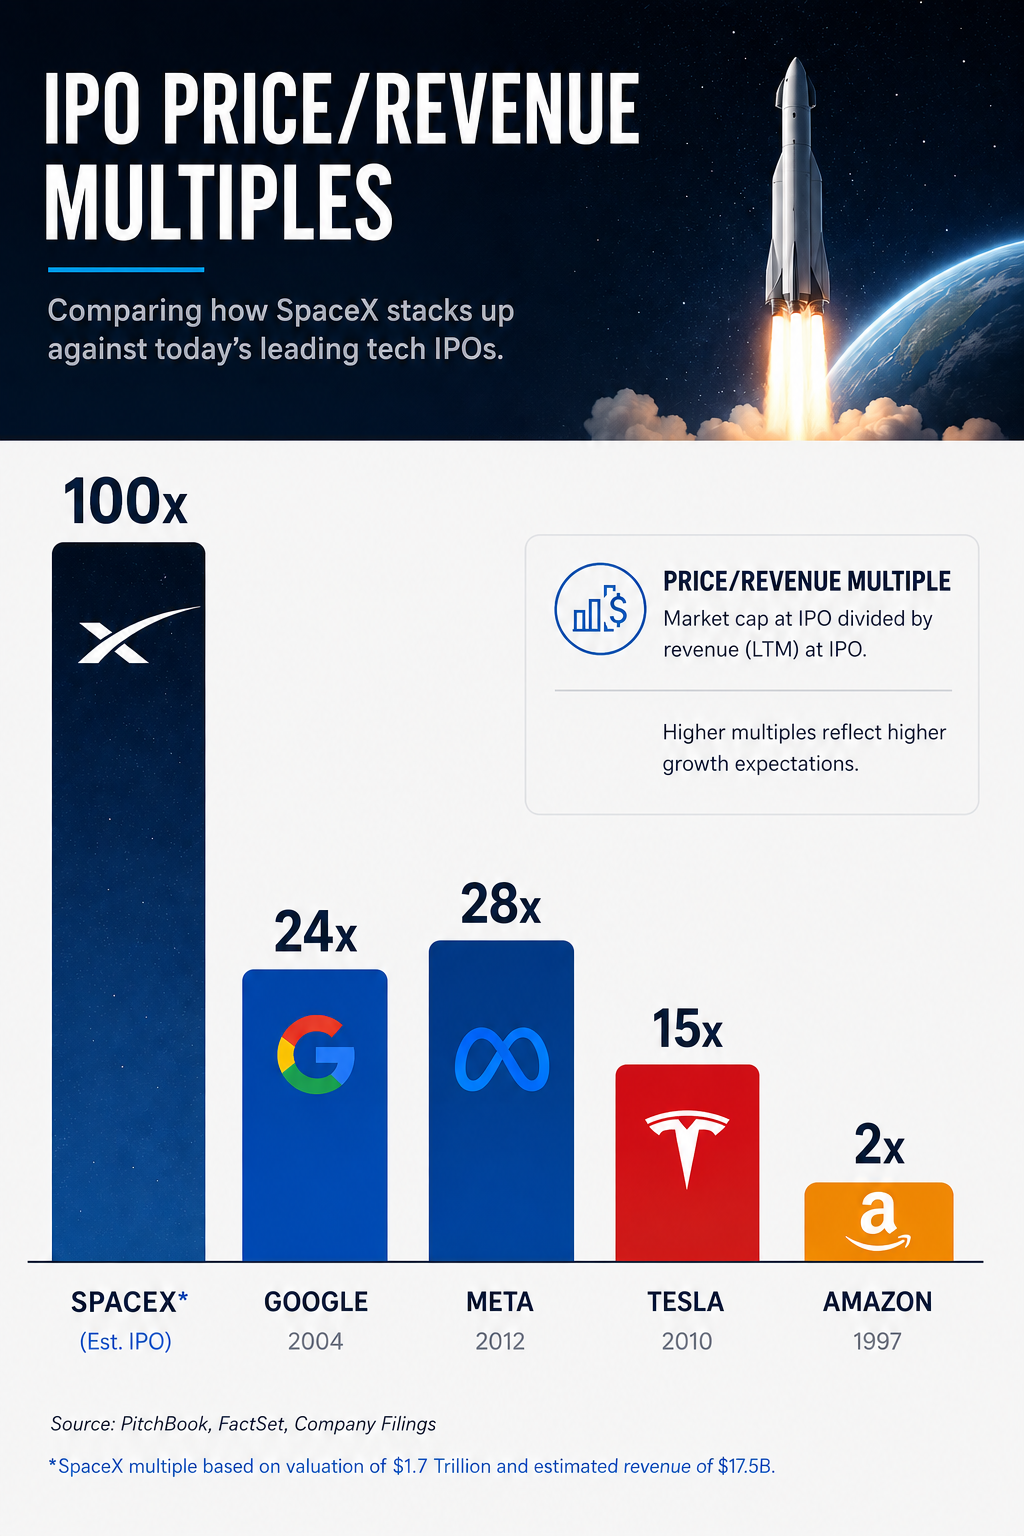
With the valuation of SpaceX coming in around $1.5 trillion on roughly $18 billion in revenue, you’re looking at a 100x revenue multiple. For comparison, Google came public closer to 24x, Meta around 28x, and Tesla around 15x. Those were incredible companies, with high growth expectations, and even they didn’t start anywhere near these levels.
2) Execution risk is real... and the timeline is long
Much of the upside narrative depends on projects that are likely years away. Reusable launch systems at scale, space-based infrastructure, data networks – these are not 12-month stories. Best case, you’re looking at execution in the late 2020s or early 2030s. A lot can go wrong between now and then, and at this valuation, the market won’t be very forgiving if timelines slip.
3) Governance matters more than people think
Investors won’t have meaningful voting control, and the corporate structure gives Elon Musk significant freedom in decision-making. That can be a strength, but it can also introduce risk. Elon already bailed out his terrible investment and far less profitable purchase of X/Twitter, effectively shifting value between entities in ways outside minority shareholders’ control. There is speculation he may push SpaceX to "acquire" Tesla to merge all his companies into one.
4) Profitability is not even a consideration
The long-term vision requires massive upfront capital. Even if everything goes right, it may take years before those investments translate into consistent profitability. That’s a tough combination when paired with a premium valuation.
5) Liquidity cuts both ways
With only a small portion of shares expected to trade publicly, price movements could be extreme. That volatility might create opportunity... but it also increases the risk of sharp drawdowns, especially if sentiment shifts.
This is a classic case where a great story meets a challenging investment setup. Could it work? Absolutely. But concentrating an entire IRA (or even 10% of one) into a single, high-valuation, early-stage public opportunity is not a risk we would be comfortable recommending to most clients. In my opinion, this belongs in the "top of the pyramid" of a portfolio – that section of the overall allocation that is not considered in the overall financial plan – money that could disappear without any impact on the quality of life or success of the plan.
End of the War – Back to the Races?
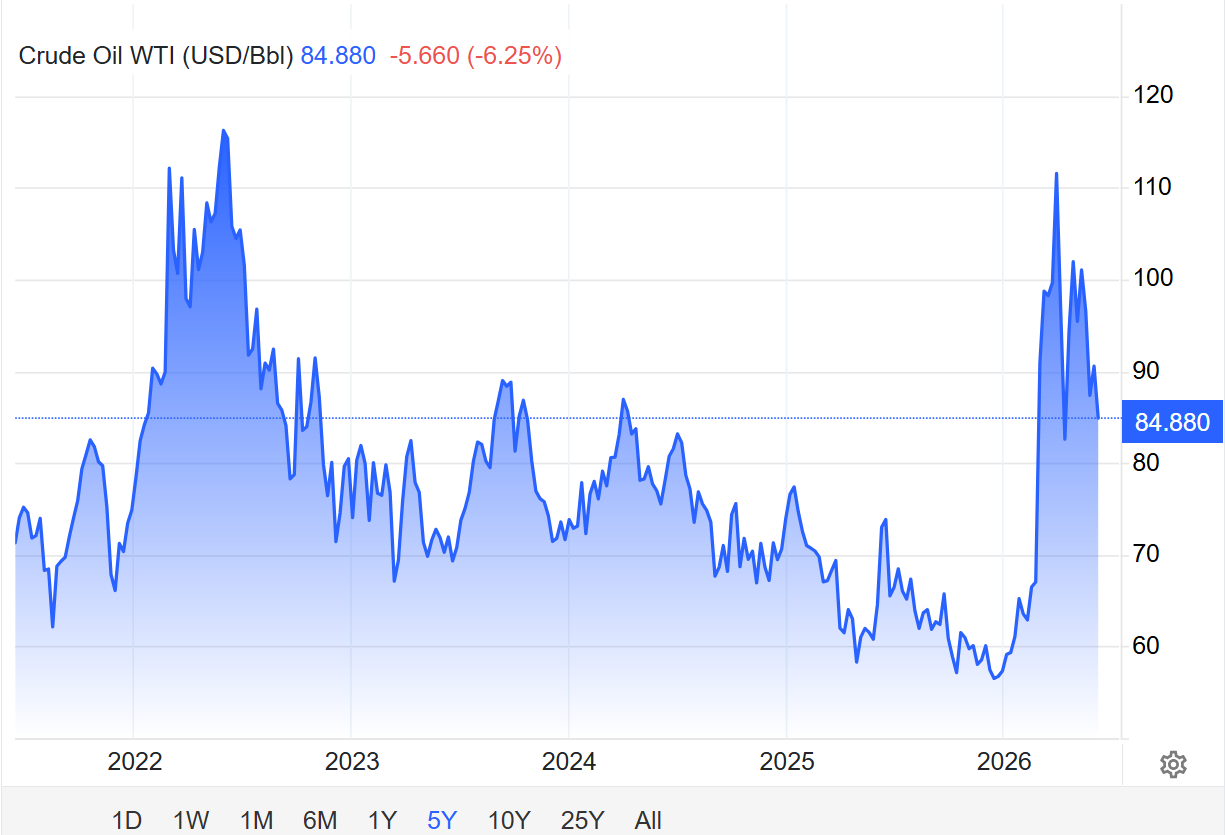
Since the US/Israel started the war with Iran at the end of February, the market has gone through up and down cycles based on the expectations of when the war will end. Going into the SpaceX IPO, the S&P 500 had dropped 5% as the fragile cease fire appeared to be unraveling. With the announcement of what may be the "final" deal to end the war, stocks may be ready to take off once again. Oil prices, while still above where they were at the start of the attacks have dropped to the lowest levels since April.
Late(r)-Stage Cycle Signal?
Starting last fall, we were "excited" to see the stock market, which was being driven by the "hyperscalers" broadening out to the rest of the company. For the past 3 years those hyperscalers who were spending the money were seeing their stock prices skyrocket with every announced "investment". The market broadening was exciting because the companies actually receiving the orders were rallying.
We also have been lamenting the fact most of the AI "deals" were simply long-term agreements being paid for by exchanging their privately held stock for the products. The "hyperscalers" were spending real cash to build their data centers. Earlier in the cycle, these "investments" were being funded with their own cash flow. Now we’re seeing a shift toward raising capital from the market, both equity and debt.
Historically, that tends to happen later in the cycle.
It doesn’t mean the growth story is over. But it does raise the stakes. When expectations are high and capital is abundant, the turning point often comes when:
- A major IPO struggles after launch
- Or growth expectations start to cool
We’re not there yet. But those are the signals we’re watching. Granted, we're still in the "big buildout" stage of the cycle, but the SpaceX IPO is likely something we're going to look back at when this stage inevitably ends and realize it was most certainly a transition sign.
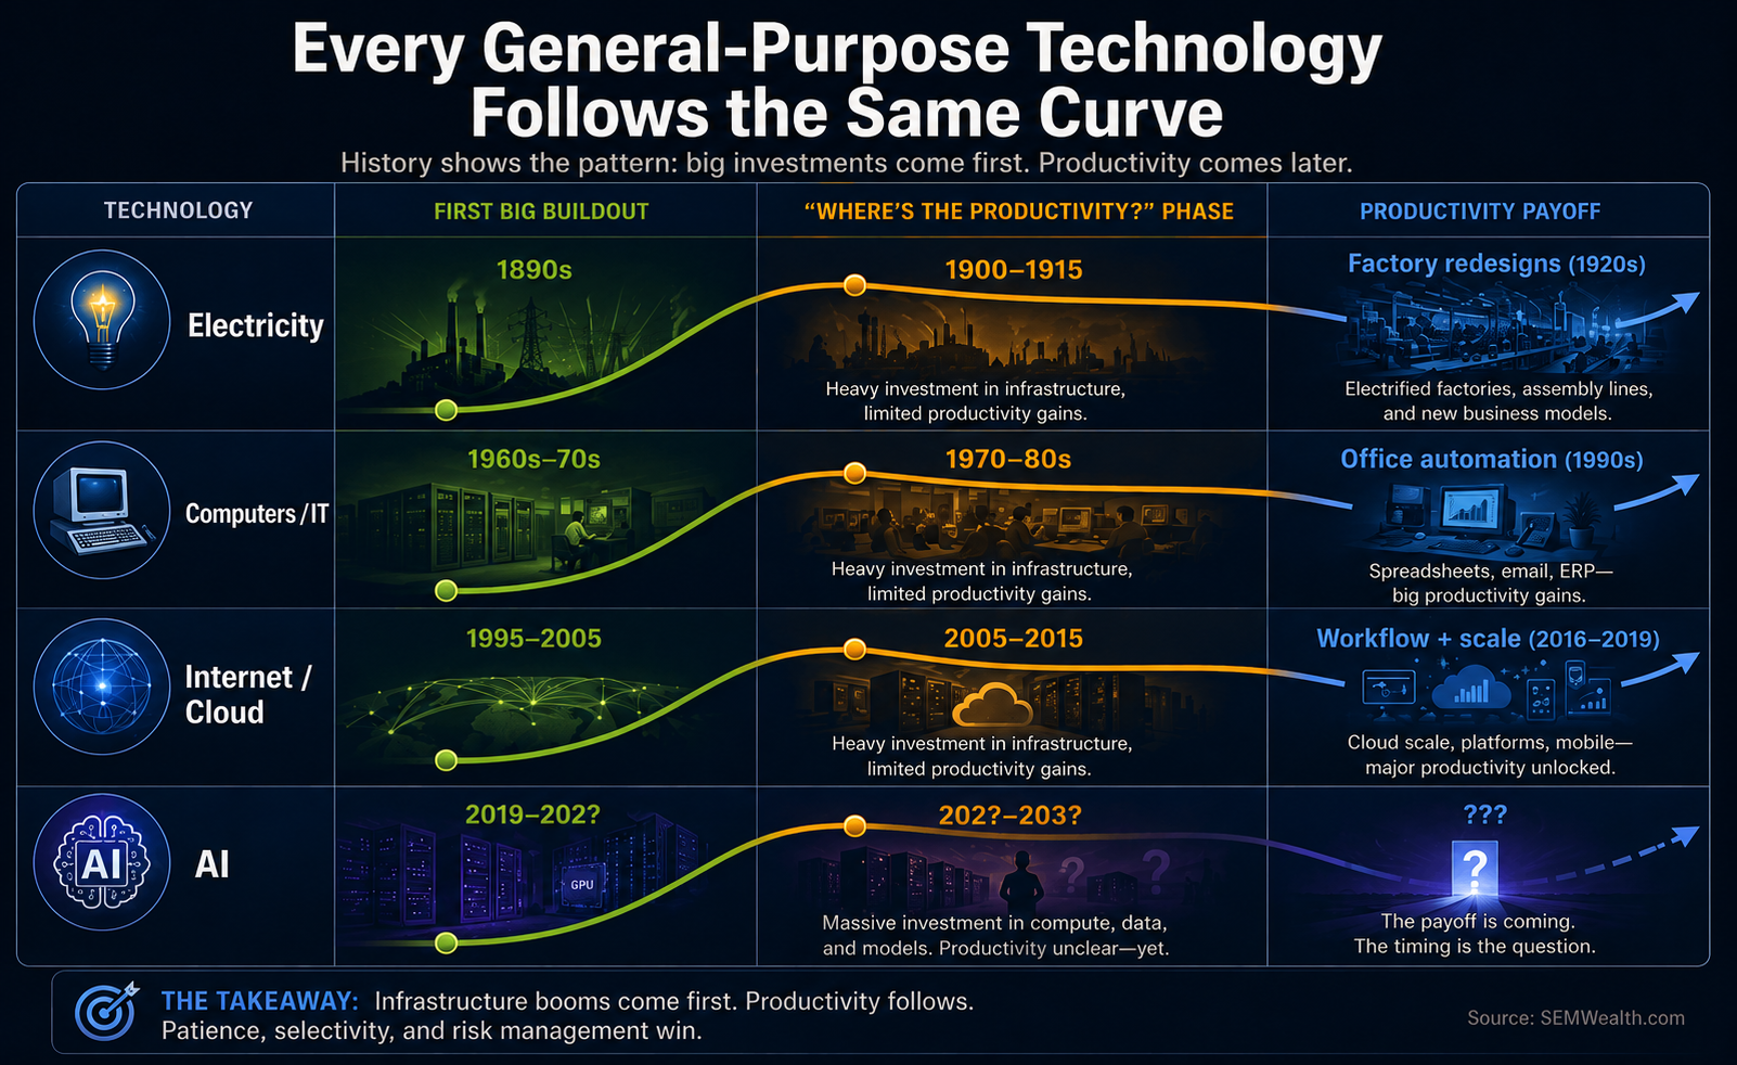
While I'm the first to admin that the AI buildout has the potential to be an even bigger game changer than the Internet/Cloud Computer phase of the 1990s, we still have to acknowledge this is looking more and more like a mania.
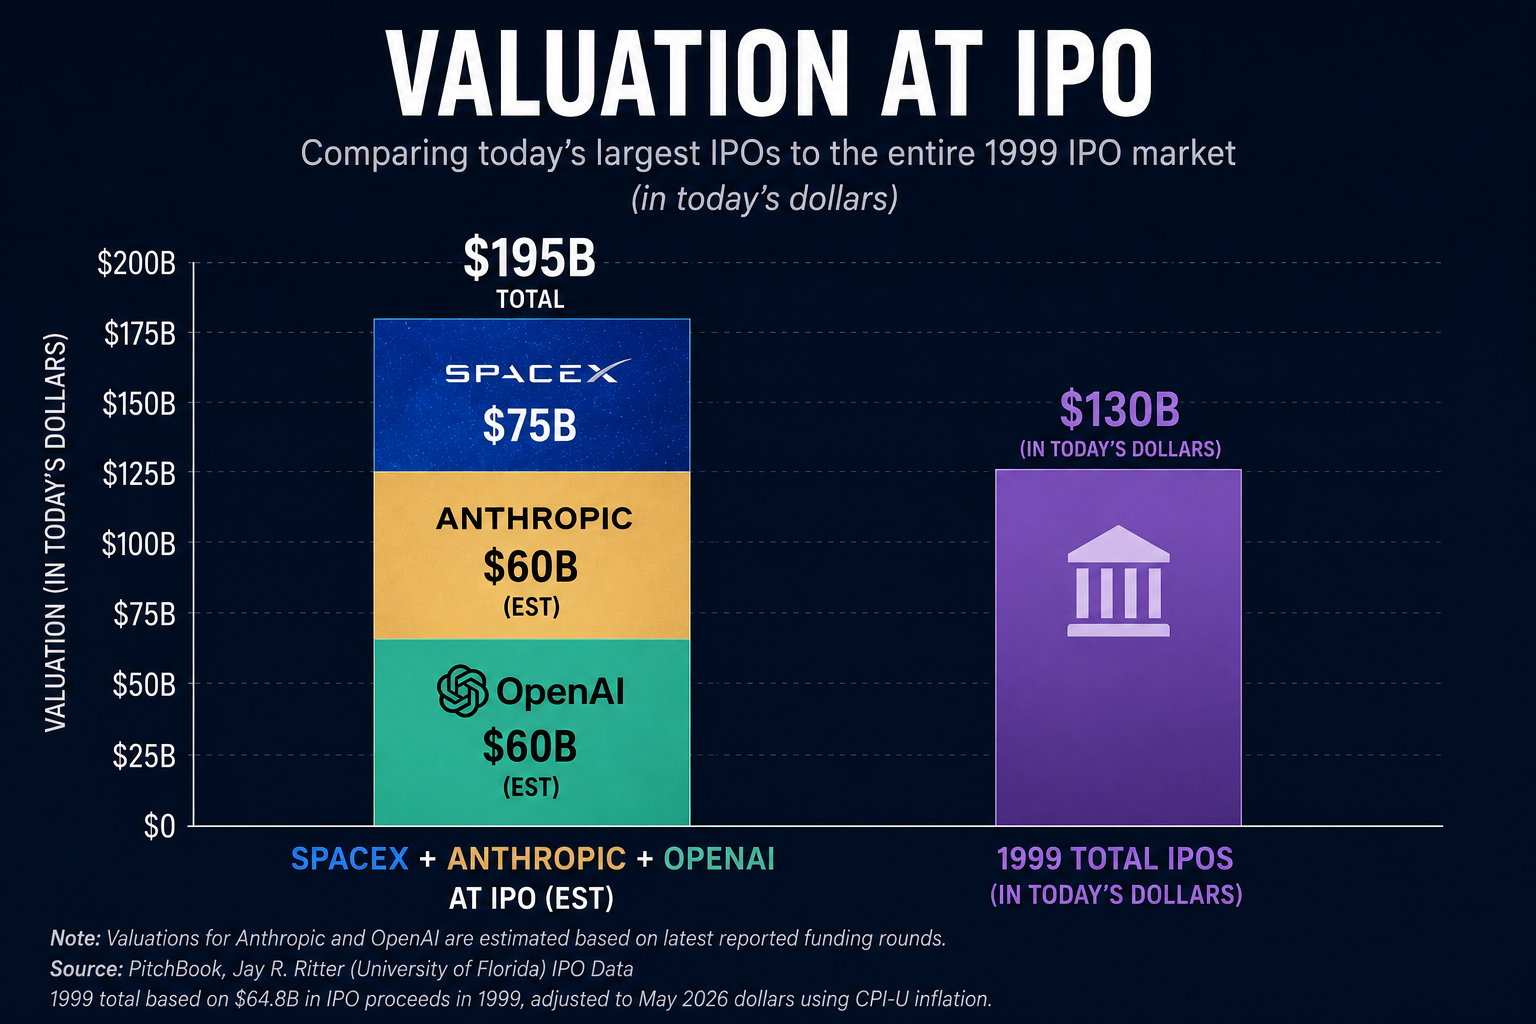
There were over 400 IPOs at the peak in 1999, all but a couple dozen were technology related companies. Most of the companies ended up failing. Combing through the list of those companies who debuted in 1999 who are still around today, there are just 3 companies that standout – Salesforce, Juniper Networks, and Akamai. Most of the others are no longer around. Adjusted for inflation, those 400+ IPOs were valued less than SpaceX and the anticipated Anthropic and OpenAI IPOs.
Granted, many of the 1999 companies were not established with products in demand in the market place. However, this is a significant amount of money being raised for companies that may never be able to be profitable. They are also relying on other companies who are both struggling to keep up with demand and also have other customers with equally big checkbooks. Maybe all 3 end up being the next "Google", but keep in mind they also have to knock off Google, who at this point is the leader in the AI race (and is also trying to raise $50 Billion of cash via a new stock offering.)
Why Interest Rates Matter More Than the Headlines
If there’s one variable that matters most right now, it’s not AI hype or IPO chatter.
It’s interest rates.
Recent data has shown inflation is proving a bit more stubborn than many expected. Oil prices have also pushed higher again. At the same time, the 10-year Treasury yield has been creeping up.
That matters because higher rates tend to hit long-term growth stocks the hardest.
When valuations are based on earnings far into the future, even small changes in interest rates can have a big impact on how those earnings are valued today.
That’s a big reason why some of the same stocks that can rise 50% or 100% quickly can also drop 20-30% equally fast.
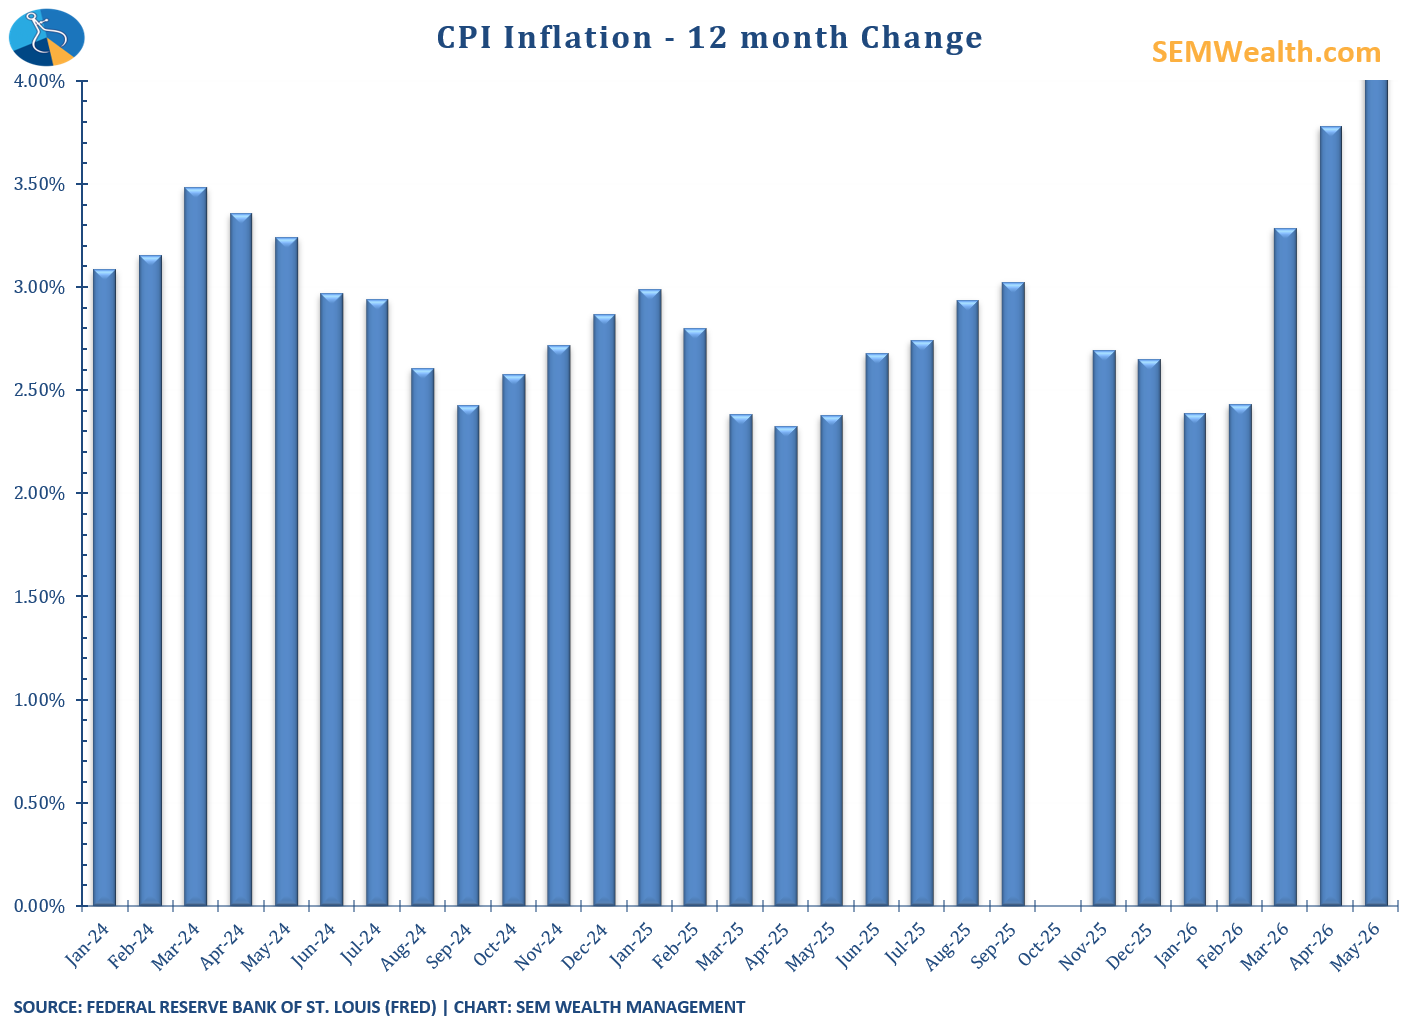
Inflation data last week was not great for those hoping for lower interest rates with the CPI index crossing 4% on a year-over-year basis.
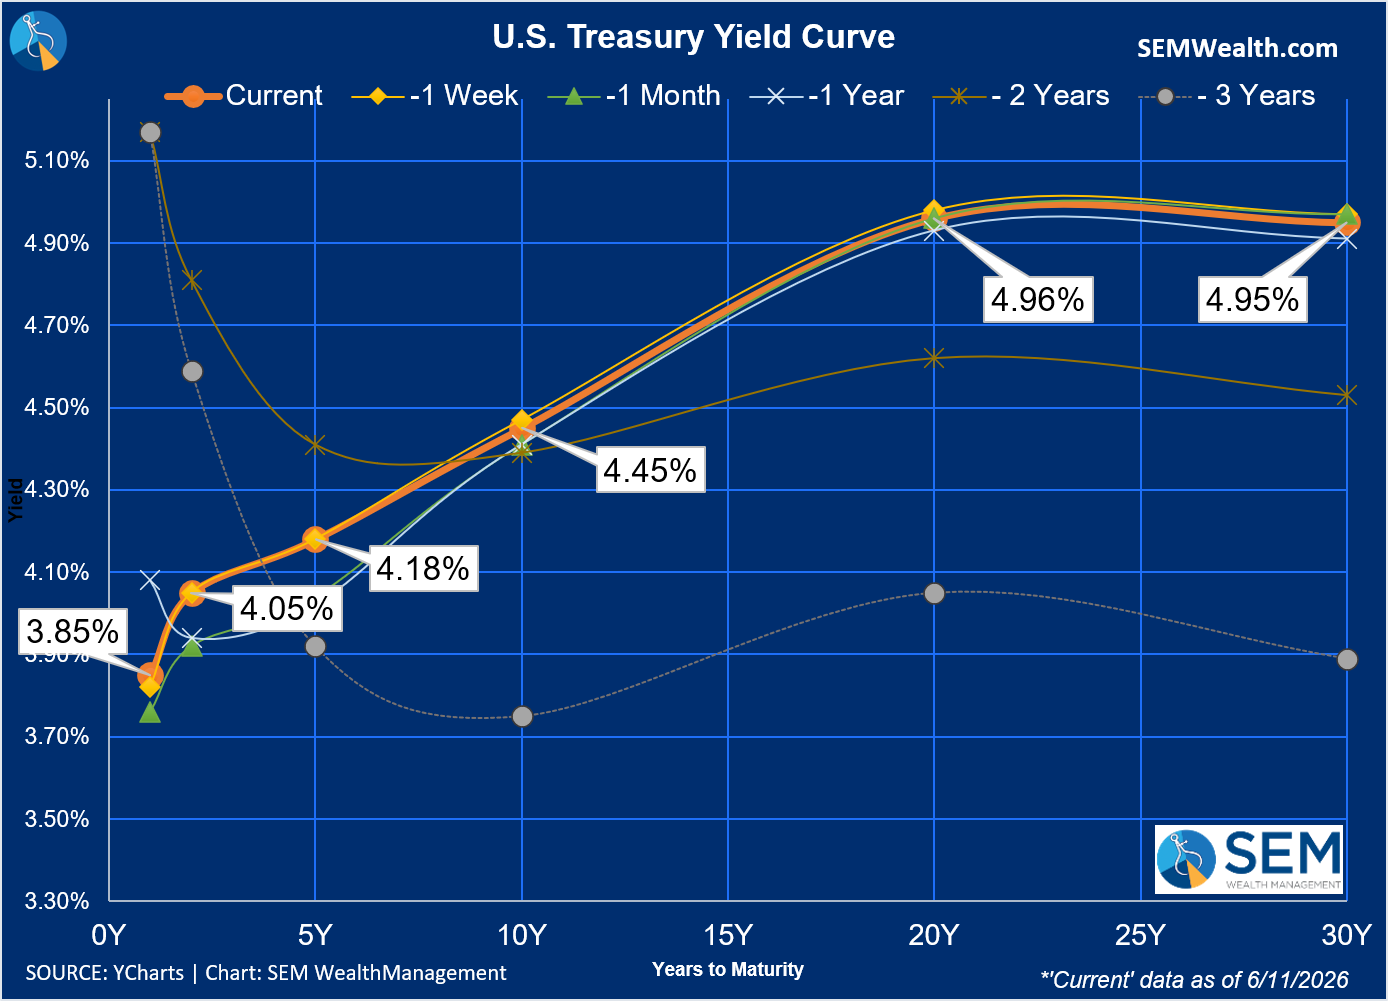
Even with the drop in oil prices on Friday, interest rates are still much higher than they were 3 years ago where it matters – on the longer end of the yield curve.
What We’ve Been Doing
From a portfolio standpoint, we’ve taken a more cautious approach over the past couple of weeks in our "tactical" equity model, Enhanced Growth Allocator (EGA).
After being fully invested, we reduced exposure as the market became increasingly overbought and the rally showed signs of being driven more by futures than broad participation.
That doesn’t mean we’re bearish. In fact, our longer-term models inside AmeriGuard and Cornerstone portfolios are still fully invested. For EGA, which has been fully invested for over a year, with conditions stretched, it makes sense to dial back risk and wait for better opportunities.
Market Charts
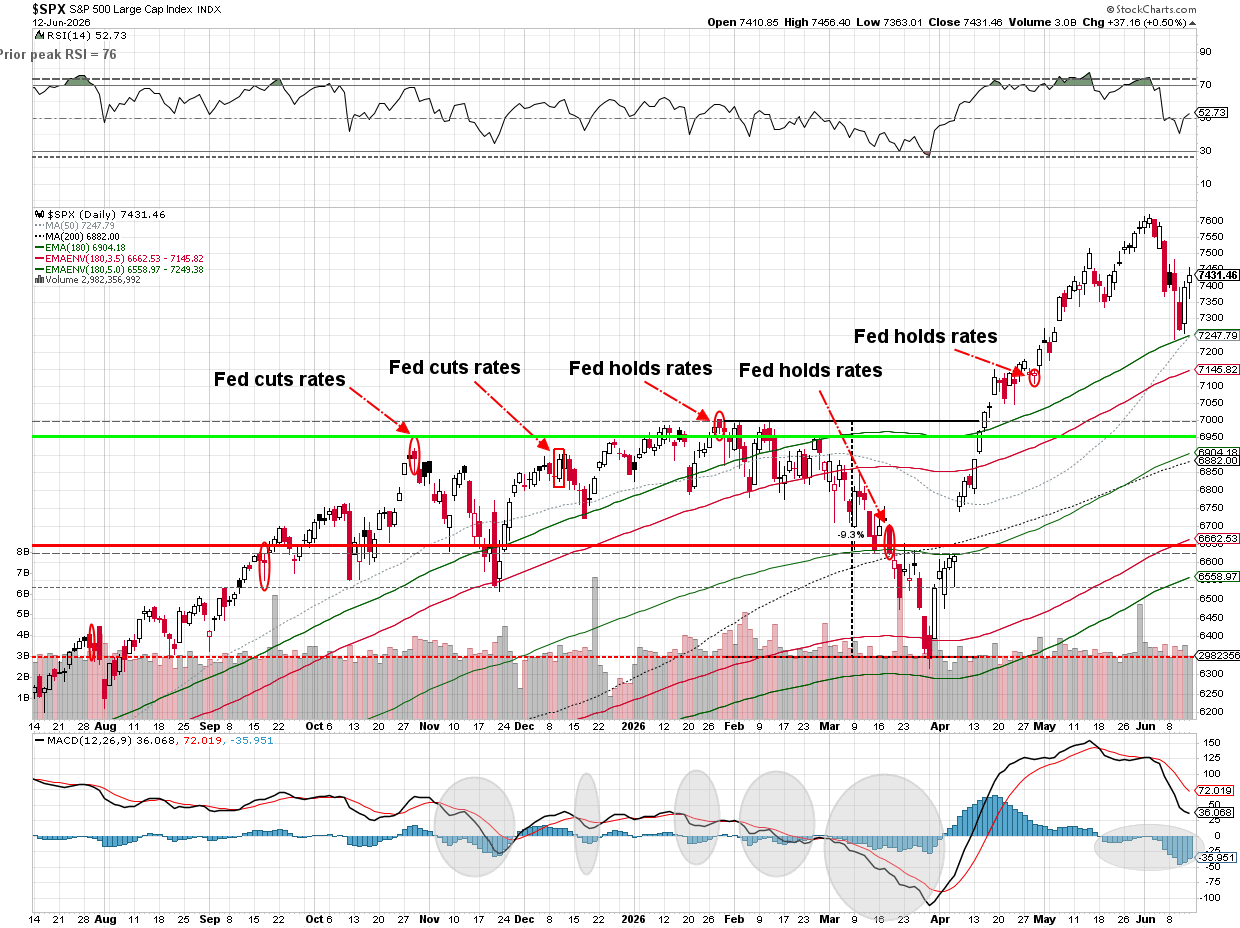
The rally on Thursday and Friday actually had me scraping my entire outline for what I thought the blog would look like this week. Instead of putting the 5%+ loss from the all-time highs in perspective, we now appear to be back in the euphoric bubble once again (with the caveat that interest rates remaining high or a high profile tech company lower their projections could cause it to reverse quickly).
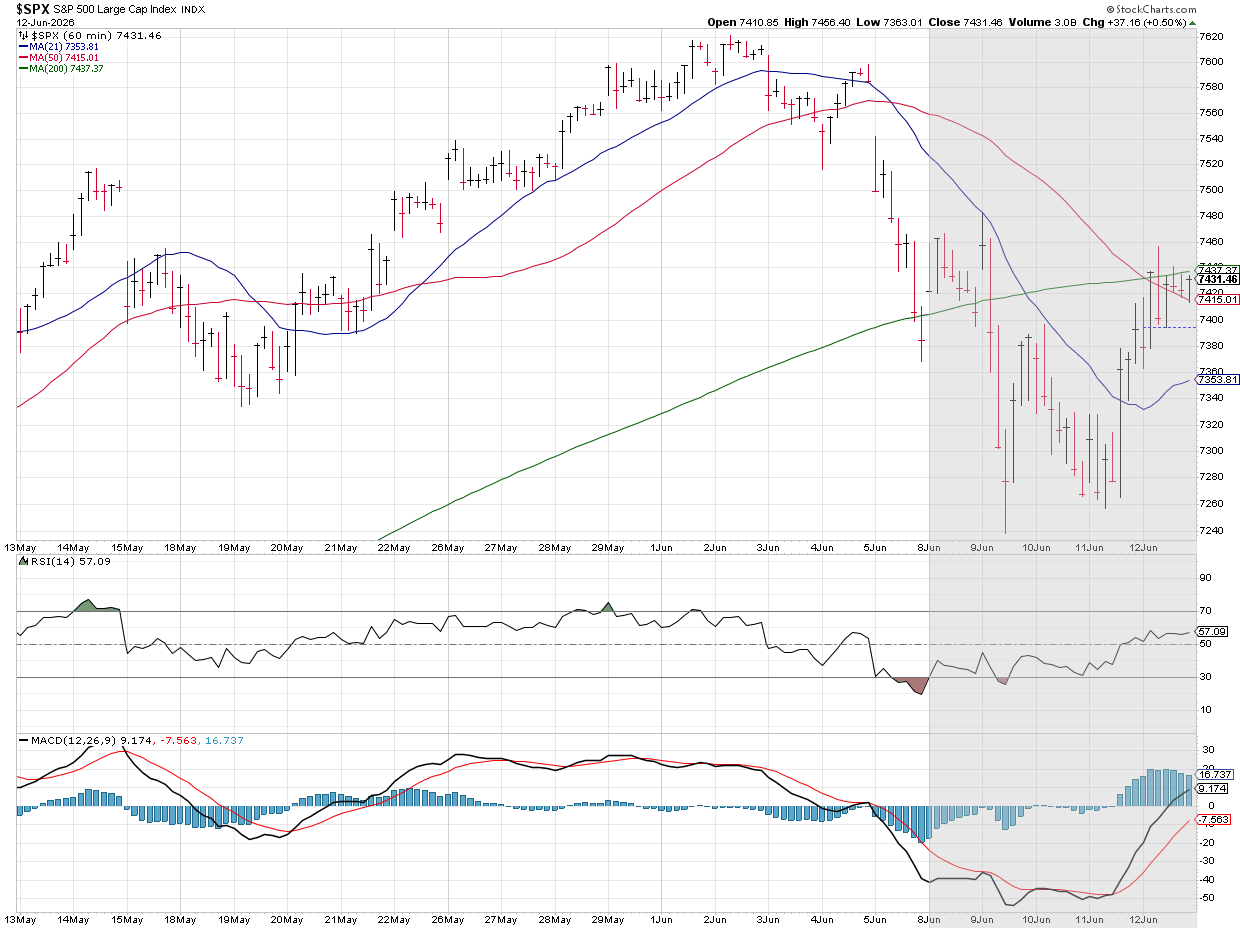
The longer-term chart shows both how quickly the market reversed at the start of June as well as the fact we recovered nearly half the losses in just two days.
SEM Market Positioning
SEM deploys 3 distinct approaches – Tactical, Dynamic, and Strategic. These systems have been described as 'daily, monthly, quarterly' given how often they may make adjustments. Here is where they each stand.
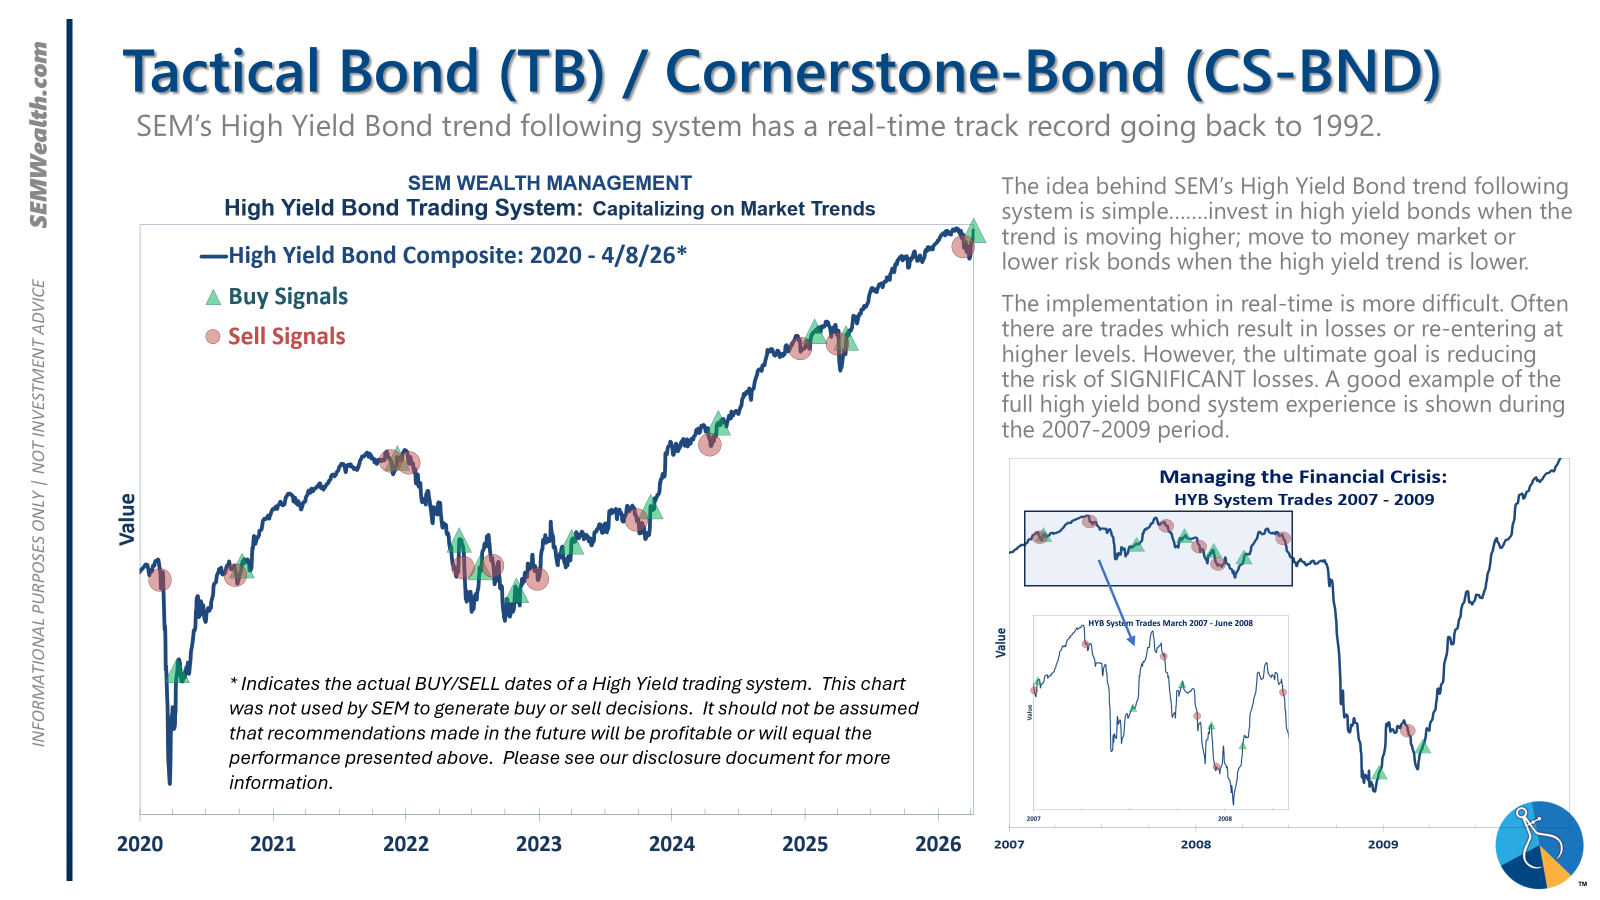
- Tactical = BULLISH | 100% High Yield Bond (4/8/2026) | High-yield spreads remain narrow but trend is slightly higher
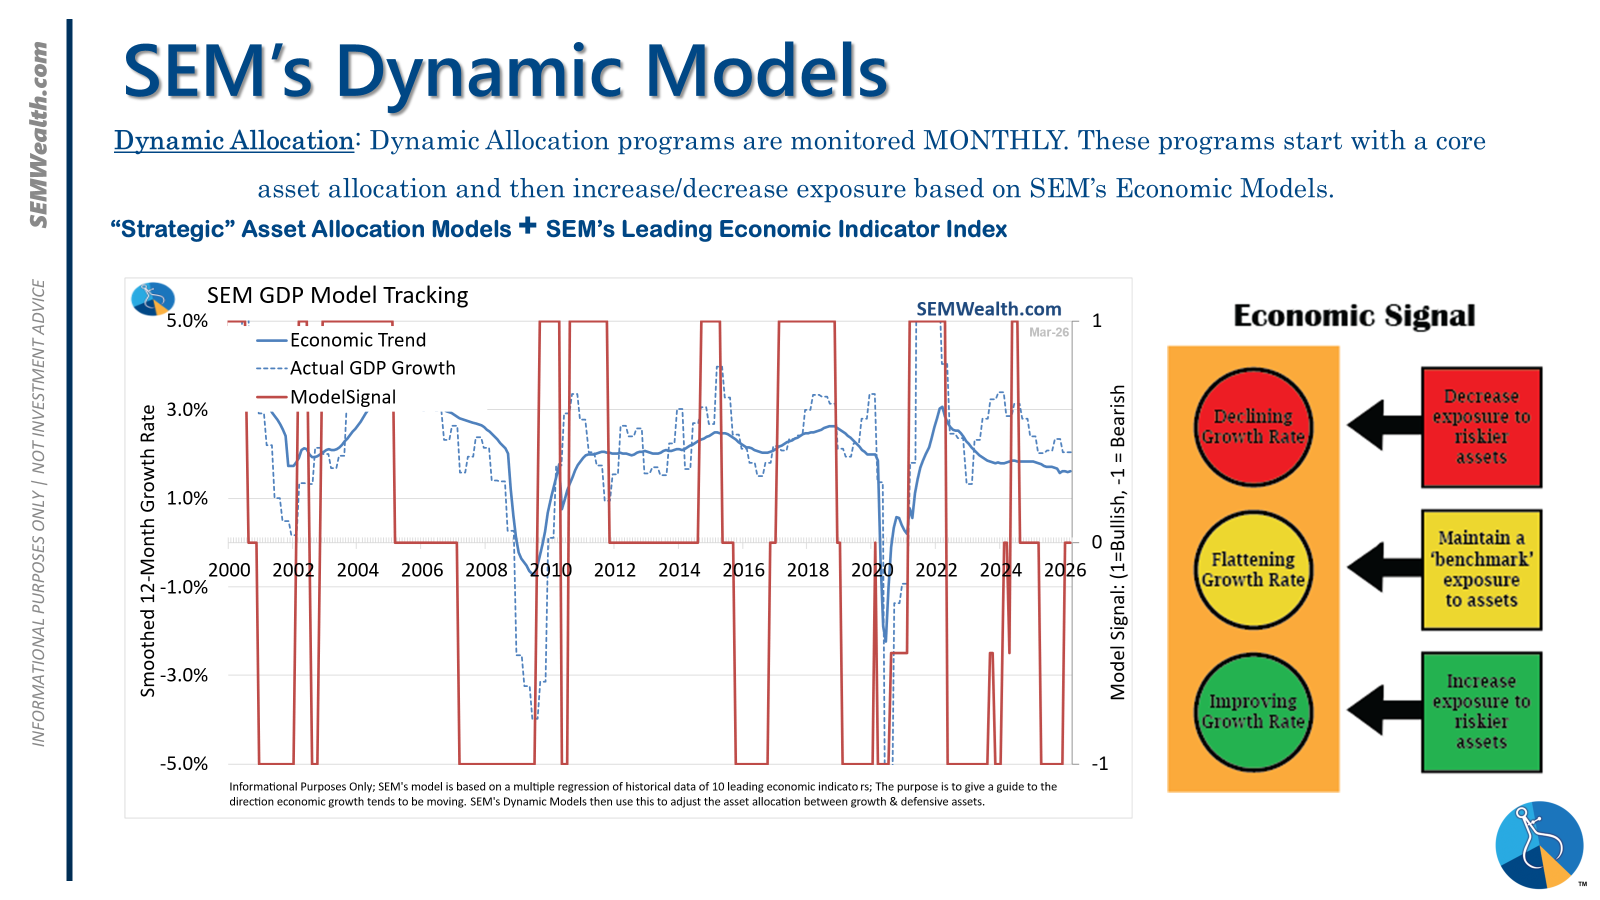
- Dynamic = NEUTRAL (2/15/2026) | "Benchmark" Allocation | Economic model inconclusive
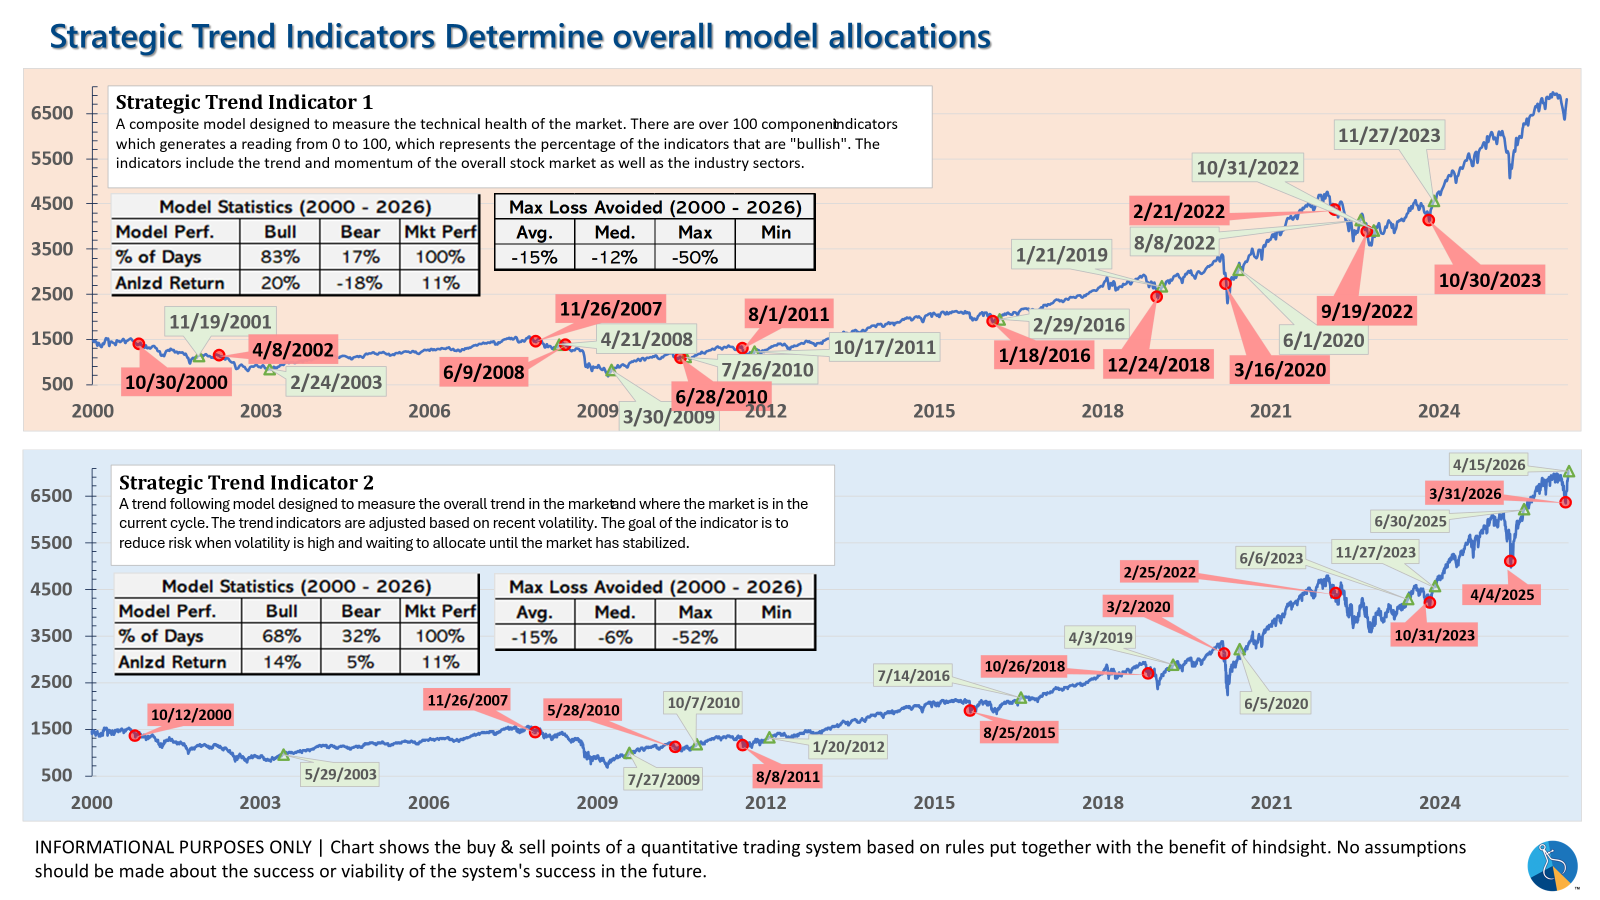
- Strategic = BULLISH (4/15/2026) | V-Bottom projecting "end" of Iran War
Tactical (daily):
- Monitored DAILY
- Models: Tactical Bond, Cornerstone Bond, Income Allocator, Tax Advantaged Bond
- Designed to follow the trends for use in our lower risk models
- BUY Signal issued April 8, 2026 (exiting the sell from March 13)
Dynamic (monthly):
- Monitored MONTHLY
- Models: All "Dynamic" Models (Income, Balanced, Growth, and Asset Allocator)
- Uses SEM's Quantitative Economic Model
- Designed to overweight riskier assets if economic trend is higher & underweight those assets if economic trend is lower.
- NEUTRAL signal issued February 15, 2026 (following BEARISH signal from July 2025)
Strategic (quarterly)*:
- Monitored QUARTERLY
- Models: AmeriGuard (Balanced, Moderate, & Growth) and Cornerstone (Balanced & Growth)
- Core Component: Quantitative Filter using 4 different time horizons across universe of asset classes
- Trend Indicator: Two different Quantitative Systems monitoring the intermediate-term trend, health of the market, and volatility
- CORE has been overweight small cap and international since October 2025 – overweight increased slightly in January
- Both TREND INDICATORS are BULLISH following 10% drop and "V-Bottom" reversal in early April
- AmeriGuard & Cornerstone Max DO NOT use the Trend indicator and are always 100% invested in stocks using our CORE rotation model.
The core rotation is adjusted quarterly. This quarter we saw half of our international positions reduced (we sold developed markets and kept our emerging markets exposure). We also saw the remaining share of mid-cap reduced in favor of more small cap exposure. We remain with a "barbell" core portfolio – about half in large cap and half in small cap as the models expect the market to "broaden".
The * in quarterly is for the trend models. These models are watched daily but they trade infrequently based on readings of where each believe we are in the cycle. The trend systems can be susceptible to "whipsaws" as we saw with the recent sell and buy signals at the end of October and November. The goal of the systems is to miss major downturns in the market. Risks are high when the market has been stampeding higher as it has for most of 2023. This means sometimes selling too soon. As we saw with the recent trade, the systems can quickly reverse if they are wrong.
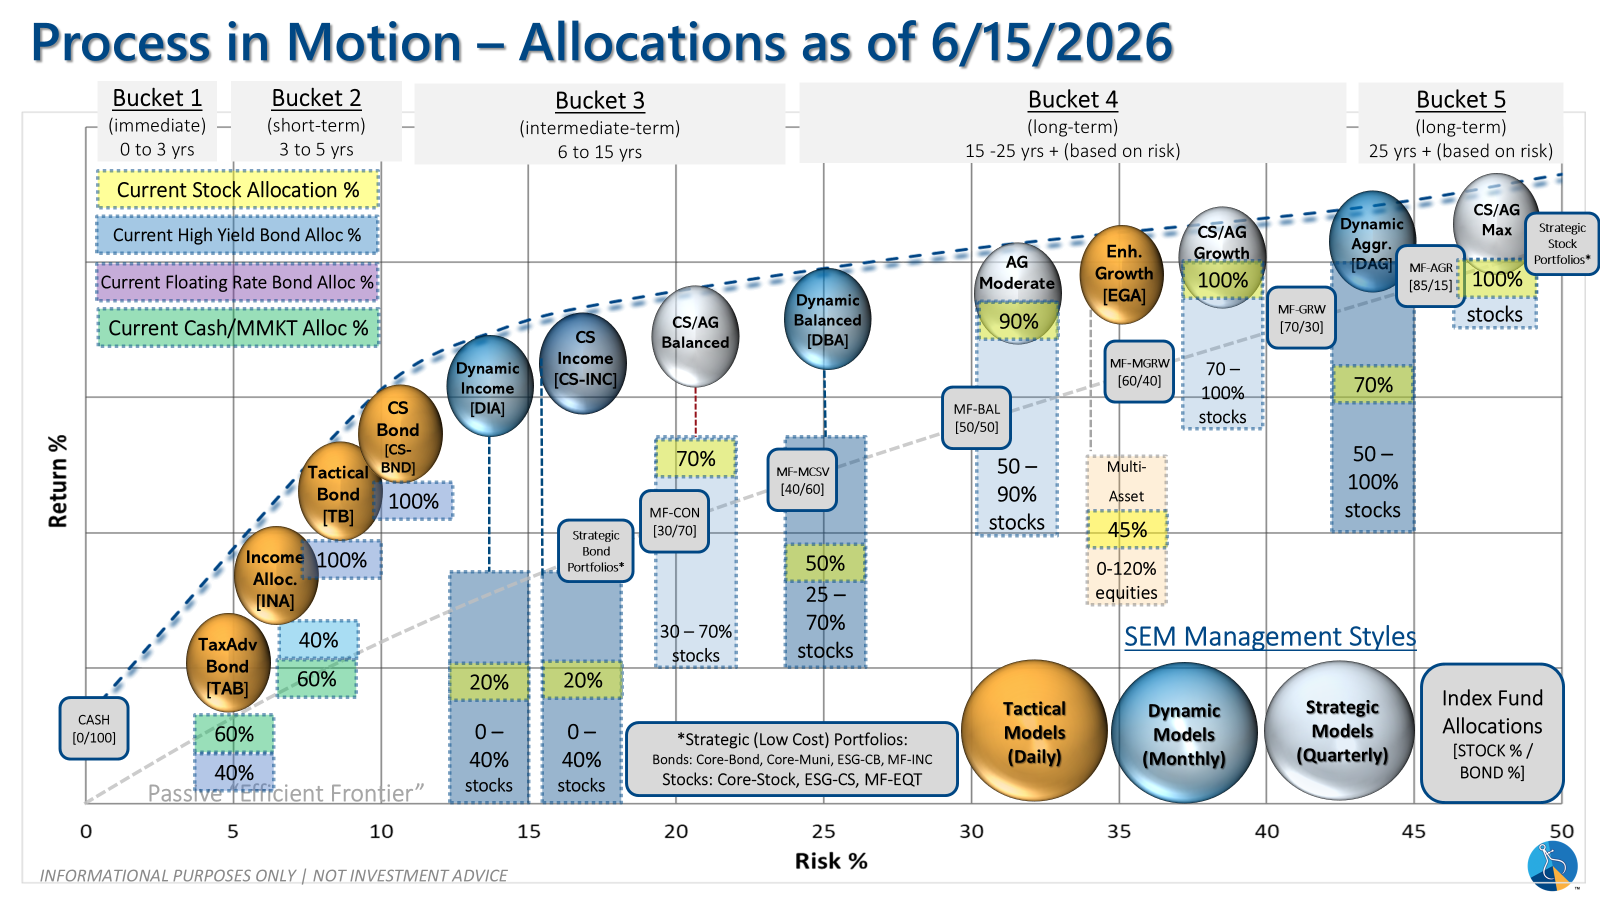
Overall, this is how our various models stack up based on the last allocation change:
Curious if your current investment allocation aligns with your overall objectives and risk tolerance?


