The stock market is attempting to stabilize, but the economic indicators continue to point to a slowdown. In this brief economic update I highlight what the DATA is saying along with ideas on what you should be doing to prepare for what could be a big move up or down.
Tag: Chart of the Week
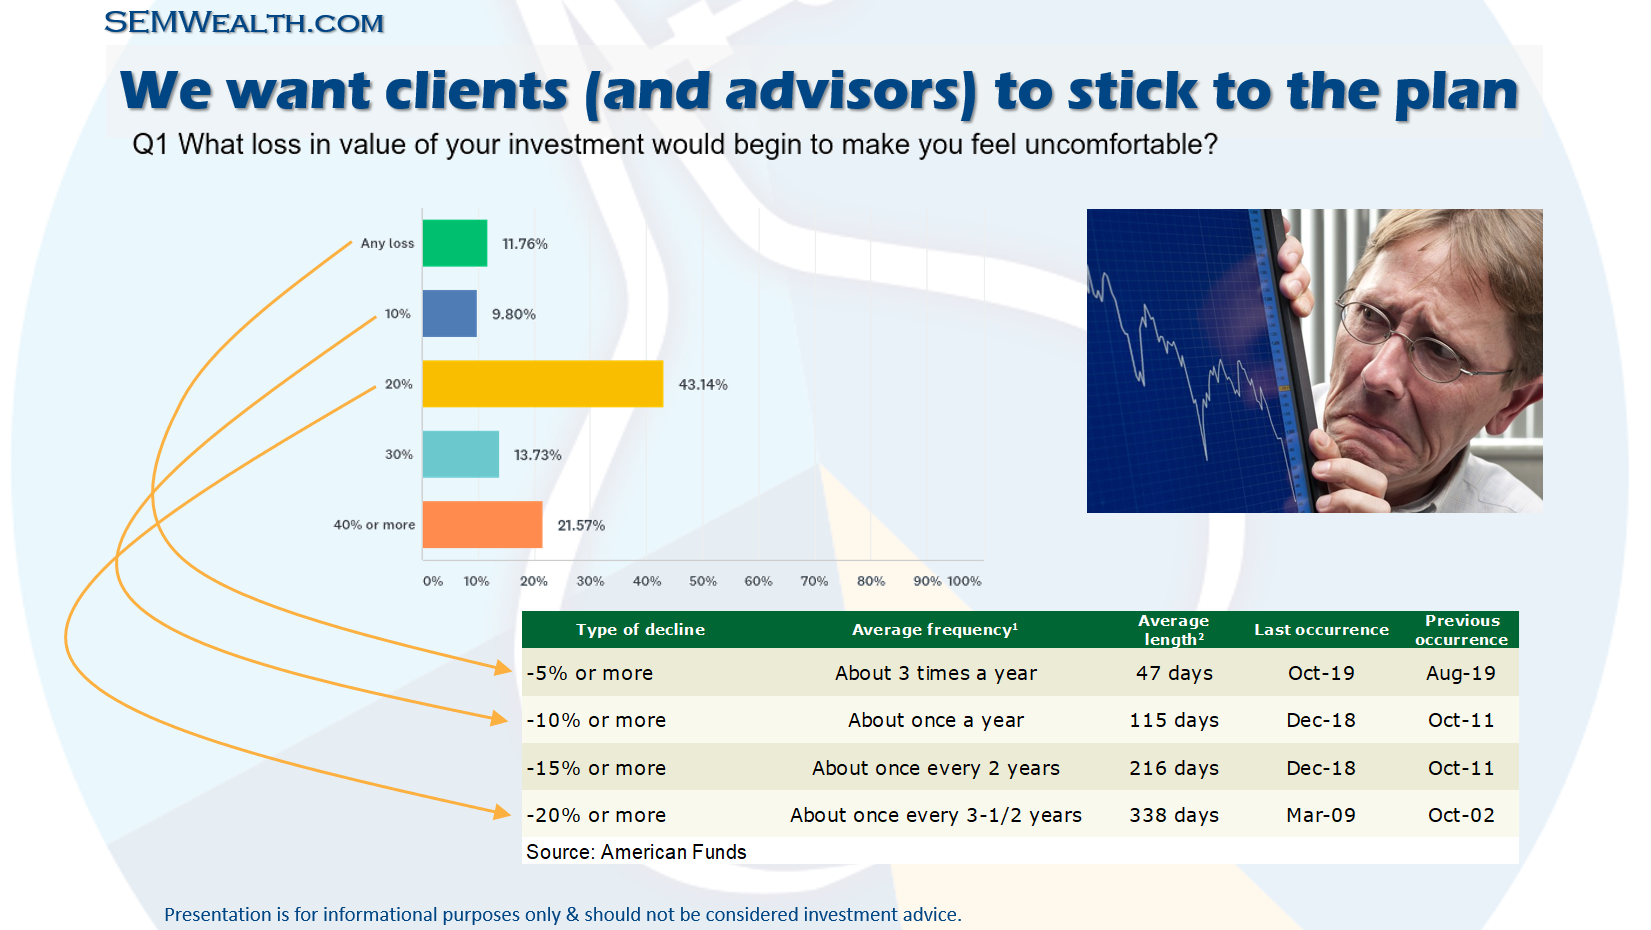
I presented at a financial planning meeting this week the “missing link” we’ve witnessed the past 20+ years. While providing a financial plan and cash flow strategy is absolutely necessary to build a behavioral portfolio that can withstand the market and emotional cycles nearly all investors
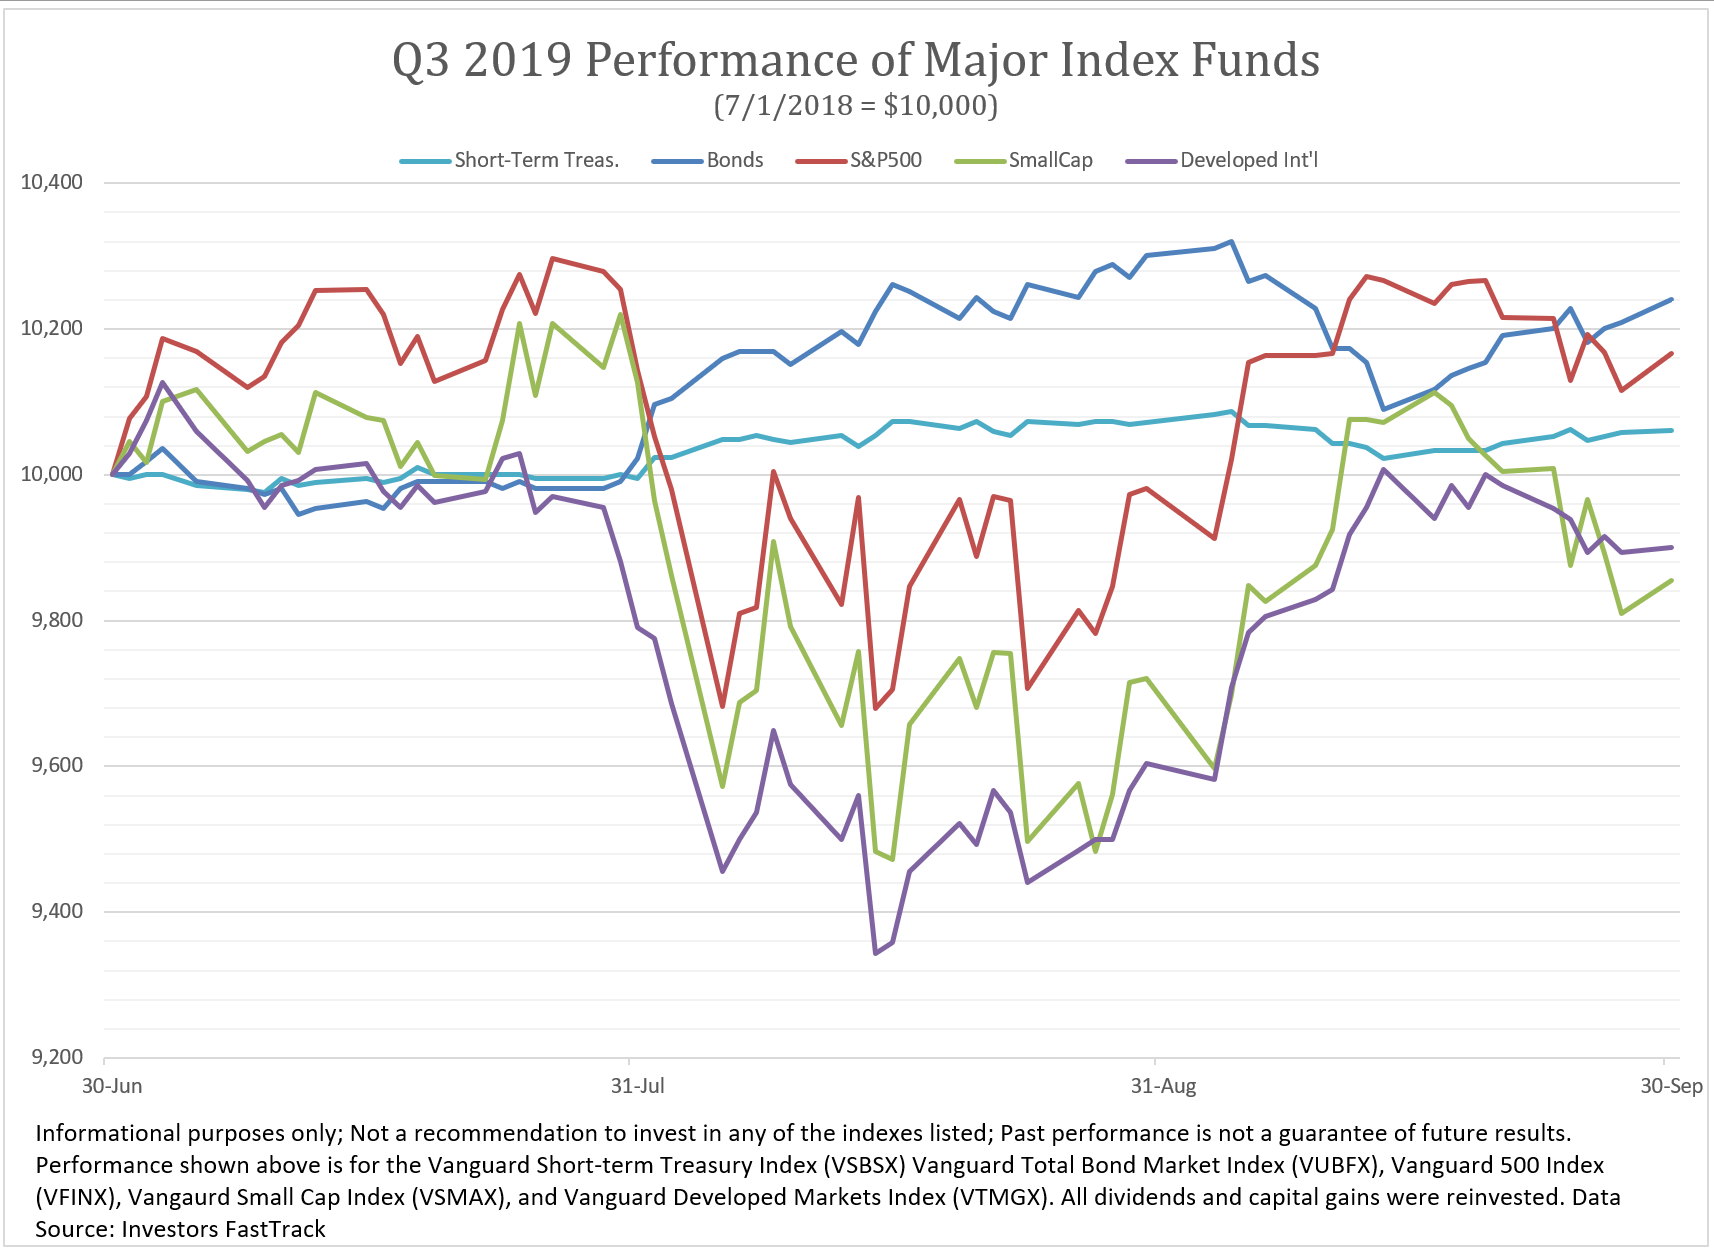
Volatility has become the norm it seems. After a nice steady first year under President Trump, since the beginning of 2018 we have seen the market swing wildly. The key drivers have been interest rates and trade policies. Both have put a sharp focus on the chances of entering a
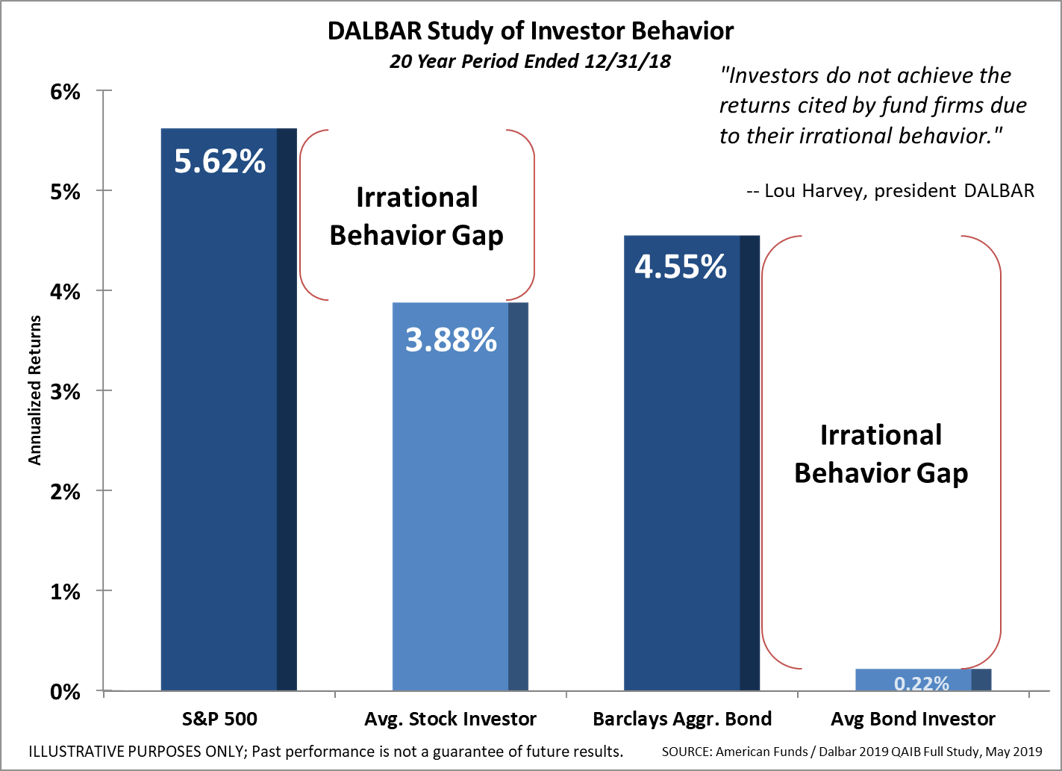
Since our founding 27 years ago, SEM has understood one critical fact — investors are humans, not robots. Each year DALBAR releases the Quantitative Analysis of Investor Behavior (QAIB). They study the buy & sell patterns of stock and bond investors and compare the returns of the average investor to
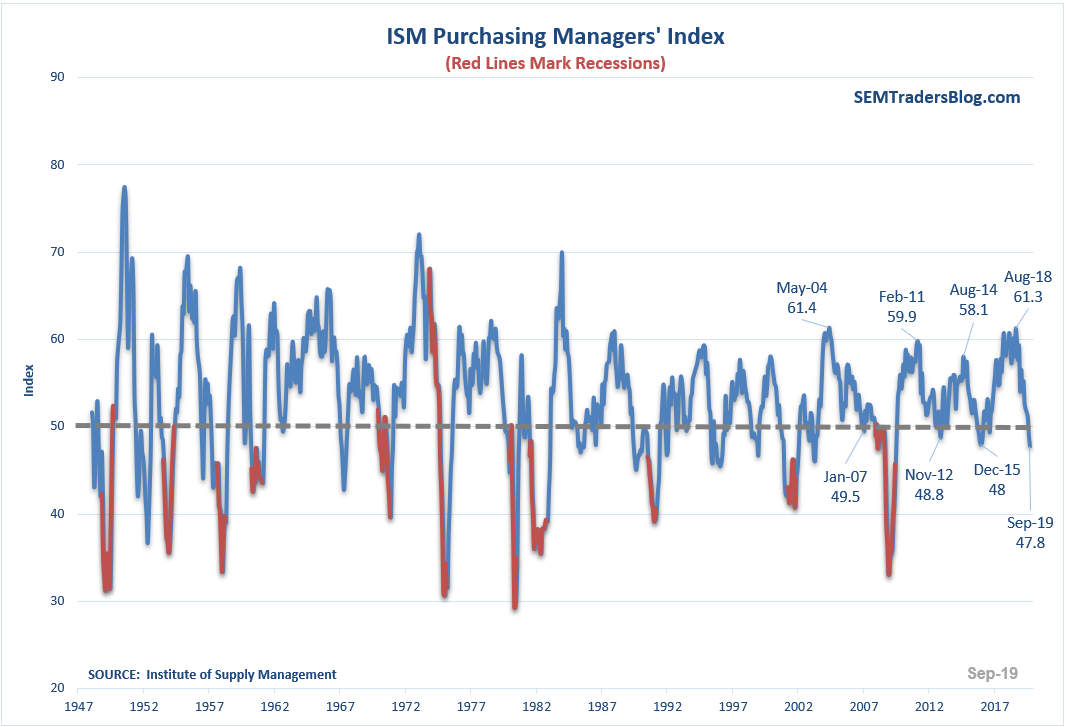
After 25 years of following the financial markets every day, you’d think I’d grow used to the sensationalized headlines of every single market move and every single economic data point. Today the financial media was reminding us that the ISM Manufacturing data released this morning showed


