
Since our founding 27 years ago, SEM has understood one critical fact — investors are humans, not robots. Each year DALBAR releases the Quantitative Analysis of Investor Behavior (QAIB). They study the buy & sell patterns of stock and bond investors and compare the returns of the average investor to a buy & hold strategy. Despite two decades of marketing and education about the benefits of buy & hold investing, every update proves the same thing………….
Buy & hold investing in theory would work if investors were robots. Instead, investors are “irrational” according to economists and end up buying after market rallies and selling after market sell-offs. We don’t consider investors “irrational”, instead we know they are human.
Here are the latest results from DALBAR.
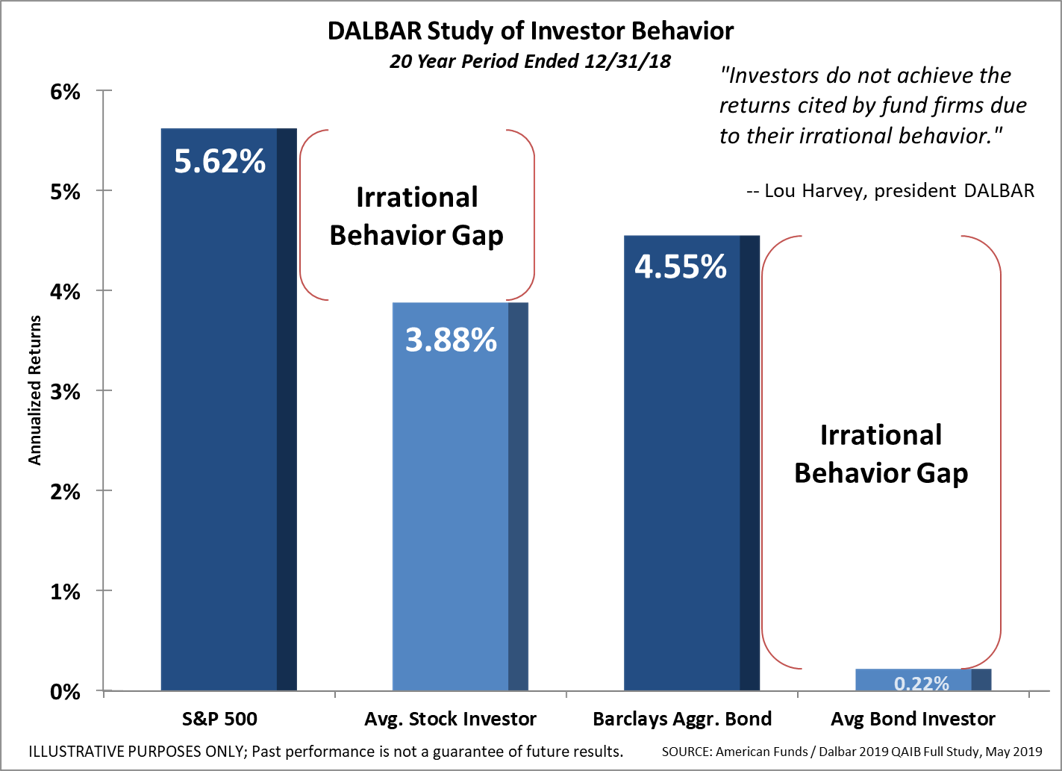
There are a few things that jumped out at me:
1.) The average stock investor did worse than a buy & hold bond investor.
2.) Bond investors, due to their conservative nature are their own worst enemies.
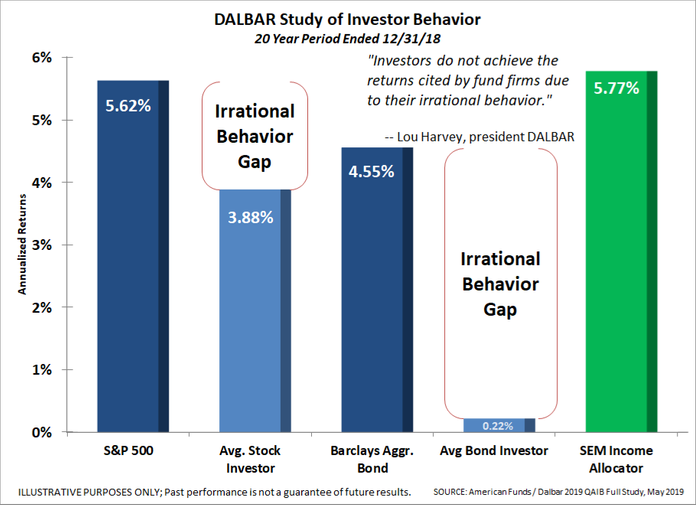
3.) SEM’s LOWEST RETURNING (and LOWEST RISK) investment model, Income Allocator has outperformed the average stock investor over the last 20 years.
4.) Your starting point matters.
What really surprised me was how much the returns fell for stocks just by moving your starting point from 1998 to 1999. Here is a comparison between the 2017 & 2018 studies.
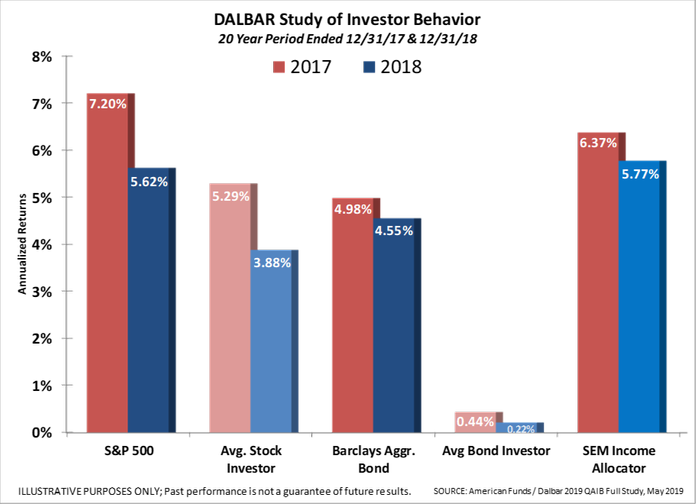
For the last 20 years stocks have only returned 5.62% annually. How many stock investors are/were expecting 8-15% returns for their stock investments 20 years ago? At its peak, the average annual return for stocks was 13.5%. Most investors, including pension funds assumed they would be able to continue generating those returns.
For a $100,000 investor, the difference in returns for a buy & hold investor by just starting 1 year later was $36,000. (The difference in returns between the average stock investor and a buy & hold investor at the end of 2018 was $41,000). This is a SIGNIFICANT DIFFERENCE!
This data provides us some key proof investors remain their own worst enemy, but it is backwards looking. What can we expect for the next 10 years? The market has returned over 14% per year for the last 10 years. The average return depending on the look-back period is 7-9%. Prolonged periods of high returns usually lead to prolonged periods of low returns.
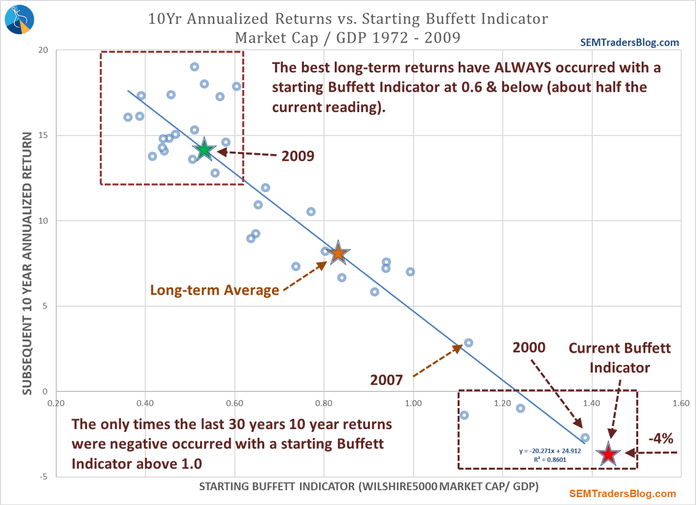
Regardless of the valuation metric, the stock market is in bubble territory. Of all the valuation metrics out there, the “Buffett Indicator” is the most reliable predictor of the subsequent 10 year returns. It is also the most logical of them all — the stock market CANNOT produce gains bigger than the underlying economy for a prolonged period of time. It is mathematically impossible.
While short-term returns can continue higher, longer-term investments made today (or held onto) are likely to suffer from low or negative returns when we fast forward to 10 years from now. This isn’t my opinion, it’s what the data tells us.
ILLUSTRATIVE PURPOSES ONLY — PLEASE SEE DISCLAIMER AT BOTTOM OF PAGE
SEM is here to help. We have a wide range of models designed to let the gains accumulate until there are signs of increasing risk. Each then has mechanisms to take some (or all) of the risk exposure off the table until the market environment is more favorable. As illustrated with the Income Allocator returns above, a ‘boring’ investment model tends to prove the old adage, “slow and steady wins the race.”
INCOME ALLOCATOR DISCLAIMER: All results assume the maximum management fee was deducted in arrears and capital gains and dividends were reinvested. Starting October 1, 2006, the maximum management fee for all accounts is 0.5625% per quarter. Results prior to June 30, 2001 are model performance results achieved by Merit Advisors, a sub-advisor to SEM. Performance results from June 30, 2001 to December 31, 2003 were subject to services provided by Merit Advisors and represent a single High Yield Bond trading system. Merit provided the buy & sell signals and SEM chose to accept or reject the signal, selected the fund(s) to use and executed the trades. Performance since June 30, 2001 represents the results of SEM tracking accounts. Results after 2003 reflect multiple trading systems developed by SEM. Advisor reserves the right to add or replace trading systems during real time without restating model performance results if they believe the return/risk profile will not change substantially. All accounts within a program at a specific custodian are managed in a similar manner. From July 1, 2001 – December 31, 2015, performance results are the asset weighted average performance for each custodian representative account within each program. If a custodian represents less than ten percent of total program assets, results may not be included. Beginning in 2016 results are an asset weighted composite of all accounts in the program for the entire period.For more details on the composite construction, please contact Strategic Equity. Individual client results may vary from the performance of the composite. Some or all of the following may occur: There could be cash flows into or out of the account. The advisor could select a different fund in the same asset class for different client accounts. Different custodians could have different fund availability, annual costs, and fees. The advisor may use different trading systems or system allocations at different custodians. Clients in the same program can be charged different fees. Fee schedules are available in Strategic Equity Management’s Firm Brochure or upon request.


