
Bad news is good news right now for investors. It seems the uglier the economic data, the more excited they become. The reason, as we cited last week was the belief this will lead to Fed interest rate cuts sooner rather than later. Investors are conditioned to believe anytime the Fed cuts interest rates the stock market and other risky assets will rally.This has certainly been the case in bull markets, which is all most investors remember given the near-historic length of this bull market.
What happens if the Fed cuts interest rates when it is already too late (see last week’s post for the details)? Then bad news is actually bad news. Stocks get hammered, risky bonds get hammered, and there are few places to hide.
Since there is no indicator until after it is too late to tell us when bad news is actually bad news, we deploy three distinct management styles (tactical, dynamic, & strategic) designed to automatically adjust our allocations to riskier assets at various points of the cycle. This removes emotions from the decision and spreads out when we make portfolio adjustments.
The primary purpose of our tactical systems is to avoid the larger losses in the market it is designed to track. By far our most popular (and longest running) strategy is our high yield bond trend following trading system. We use 4 versions of this system inside our Tactical Bond model and 3 versions are a portion (up to 50%) of our Income Allocator model. Similar systems are a part of several of the strategies our outside managers use inside our Platinum Portfolios. (Click here to learn more about our models)
Within the last week, all 4 versions of our high yield bond trend following system triggered buy signals. I included this chart illustrating the real-time buy & sell signals for this system.
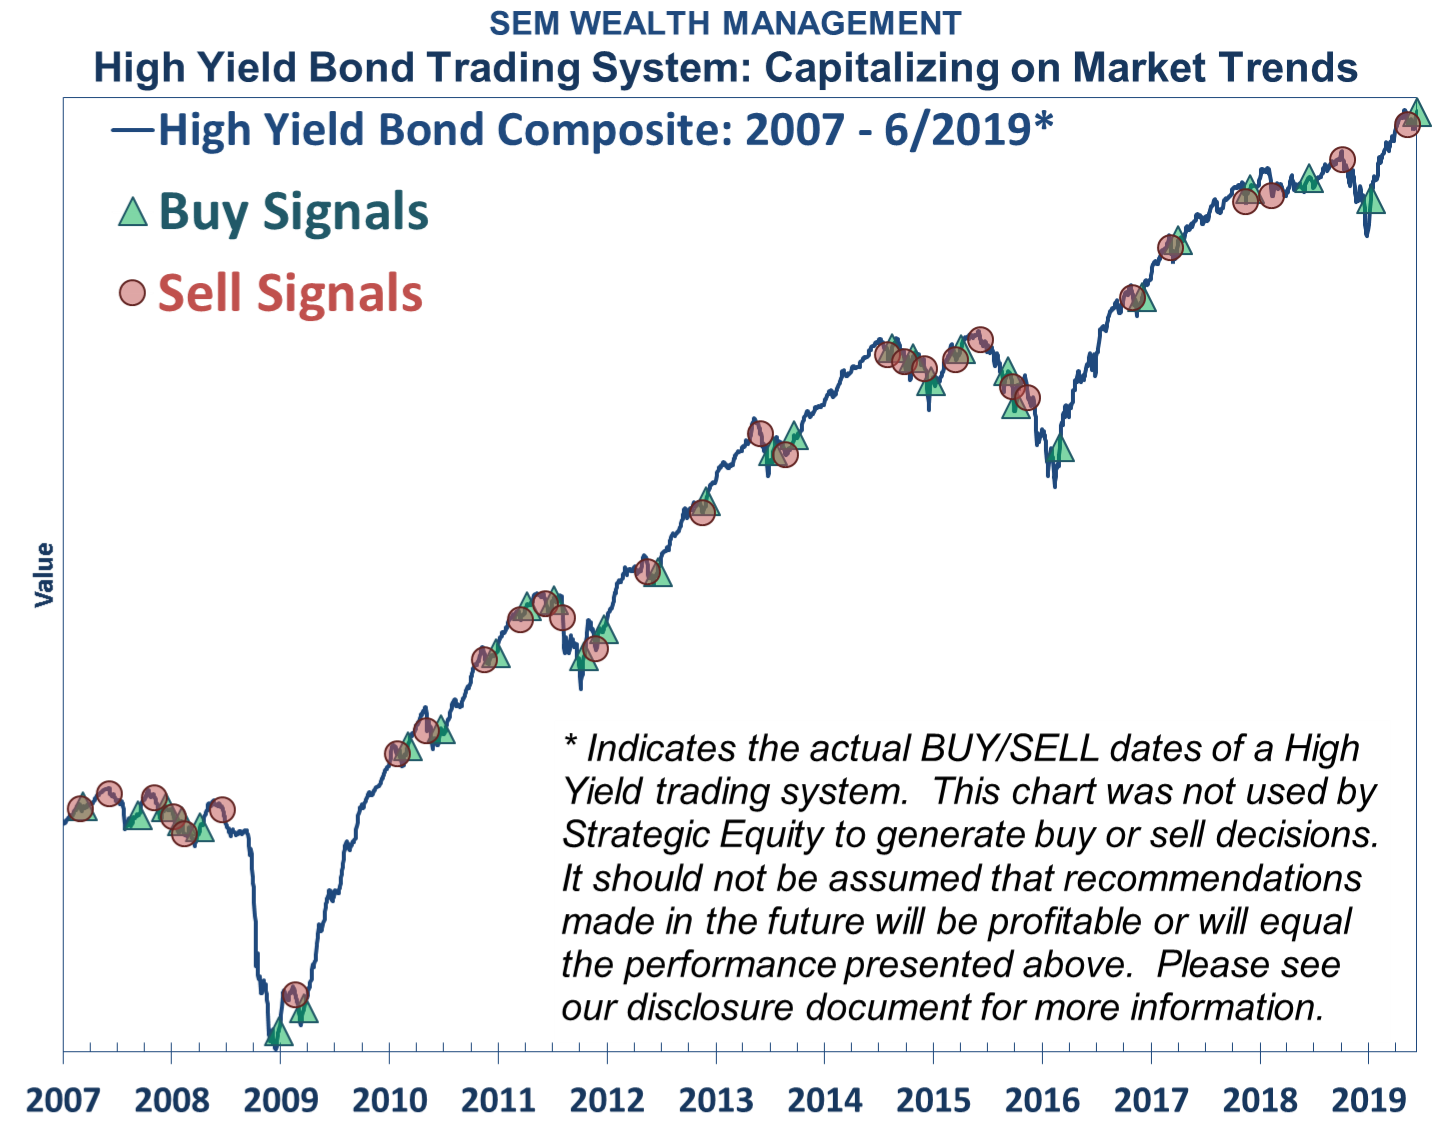
ILLUSTRATIVE PURPOSES ONLY — PLEASE SEE DISCLAIMER AT BOTTOM OF PAGE
There are two things you should understand:
-
Many of the signals, with the benefit of hindsight will be “wrong”.
-
The goal is to avoid the large losses (5% or more)
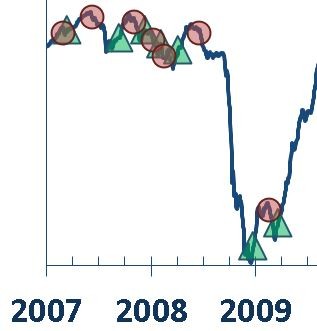
Looking at the chart the losses avoided in 2008 are obvious. The index lost 35% from June through December 2008. Leading up to that time, there were many “false” signals that frustrated many of our clients and advisors.
Remember, the Fed was ensuring us they were “watching” and “ready to act” should the problems in the mortgage market spread. More importantly, the Fed began cutting interest rates in late 2007. They continued to cut through 2008.
Bad news was bad news and the Fed COULD NOT STOP the natural forces of too much debt wiping out over 1/3 of bond values and over 1/2 of stock values. Many “AAA” investments became worthless.
Since that time (with hindsight), we could look at the trades the high yield bond system has made and question the value of the system. The 10-year rally has masked some other larger losses in high yield bonds.
-
August – October 2011: -10%
-
November 2015 – February 2016: -10%
-
October – December 2018: -6%
In all 3 cases, our model chopped off half or more of the losses from the time we sold until the time we got back in the market. Any of those cases could have turned into a 2008 type sell-off.
For now, while our outlook for the economy is negative (which means our Dynamic models are “bearish”) and our opinion is the stock/bond bubble we are seeing means we are in the very late stages of the bull market, this well tested, robust trading system says to buy, so we buy. Like it has done dozens of times the last 27 years if it was wrong and bad news is actually bad news, it will generate a sell signal.
Remember, the goal is to avoid large losses. By doing this we have capital ready to take advantage of what will be incredible discounts in the high yield bond market. The values right now are not that attractive, but our average coupon in Tactical Bond is 6.3% annually. We’ll take what we can get for as long as we can get it.
After a couple of years of “lean” returns in these very conservative models, 2019 has been a good year for these models. Combined with our Dynamic Income Allocation (DIA) model discussed last week, it has been a VERY good year, especially when you consider the relatively low risk a combination of these two models gives you in your portfolio.
Given where we are at in the market/economic cycle, now would be a great time to look at how your portfolios are set-up to handle a market that actually goes down.


