
Depending on where you live, you've had your hoodies and flannels out for several weeks or they are still gathering dust in your closet. Here in eastern Virginia, our fall clothes are finally going to make their debut this week after a spectacularly warm fall.
I thought that was fitting as I reviewed the final pieces of economic data from last month. Since summer, my opinion has been that we would start to see a slowdown in late fall / early winter. The reasons were pretty simple – we are comparing today's economy to one where we saw $5.3 Trillion of stimulus dumped on the economy (which is about 27% of our TOTAL economic output per year). So not only are we comparing economic numbers to a period that had mass stimulus floating through it, we are also seeing both the side effects (supply chain shortages, inflation, labor market imbalances, etc) as well as what the economy really looks like without all of that government support.
Last week I talked about some of the side effects. Prior to that I talked about the structural imbalances in the labor force. Just before that in our client newsletter we walked through some key questions or economy is facing. In case you missed any of those or need a refresher, here are the links:
 Jeff Hybiak, CFA
 Jeff Hybiak, CFA
 Jeff Hybiak, CFA
In the interest of time, here are some additional data points we received in the past few weeks:
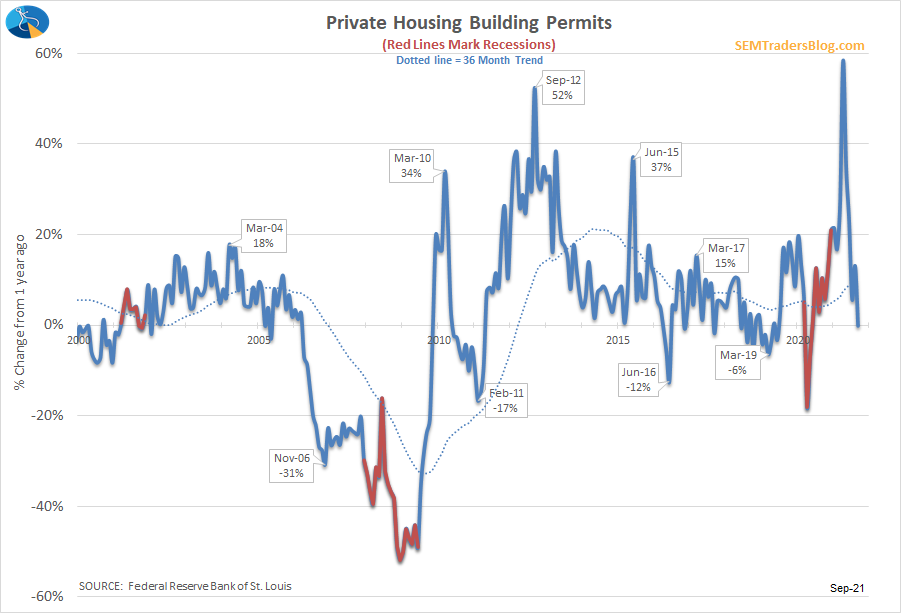
Building Permits are declining. This was one of the pillars of the economic rally throughout 2020. The question is whether this is the result of extremely high materials prices and shortages of key components or sales prices getting too far ahead of demand.
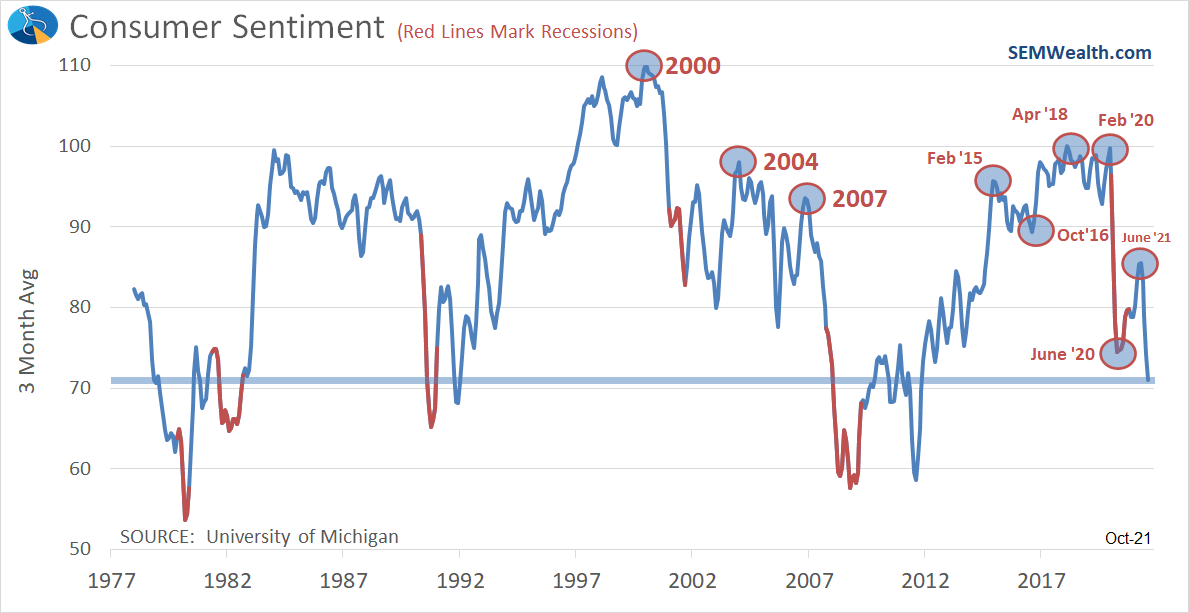
Consumer Sentiment is below the COVID lows. This could be due to the supply chain/inflation issues, but this doesn't bode well for FUTURE economic activity.
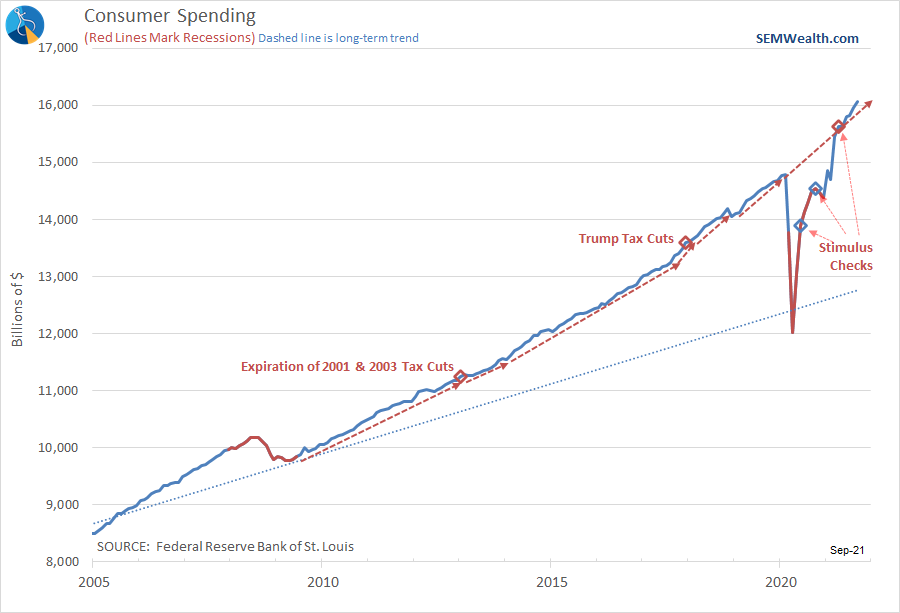
Consumer Spending is still rising at a pace FASTER than the pre-COVID levels. As I touched on last week, this is one of the reasons we are having supply chain issues. One thing I worry about is these shortages typically lead to overstocking which will take time to work through and will be a drag on future economic growth. Typically when we have shortages by the time the supply chain catches up demand has fallen to the point where we don't need the excess capacity.
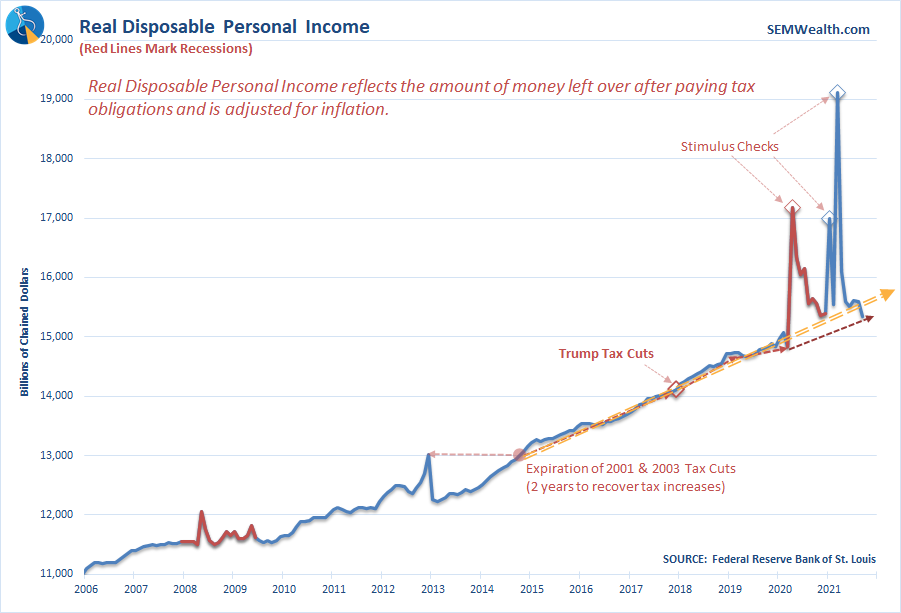
Disposable Personal Income growth is now running BELOW 2015-2019 trends. This is a huge issue. The $5.3 Trillion combined stimulus is mostly gone. The orange line on the chart below is the trend in personal income since 2015. You can see a very slight improvement from the Trump tax cuts that was already disappearing before COVID. This does not bode well for future spending.
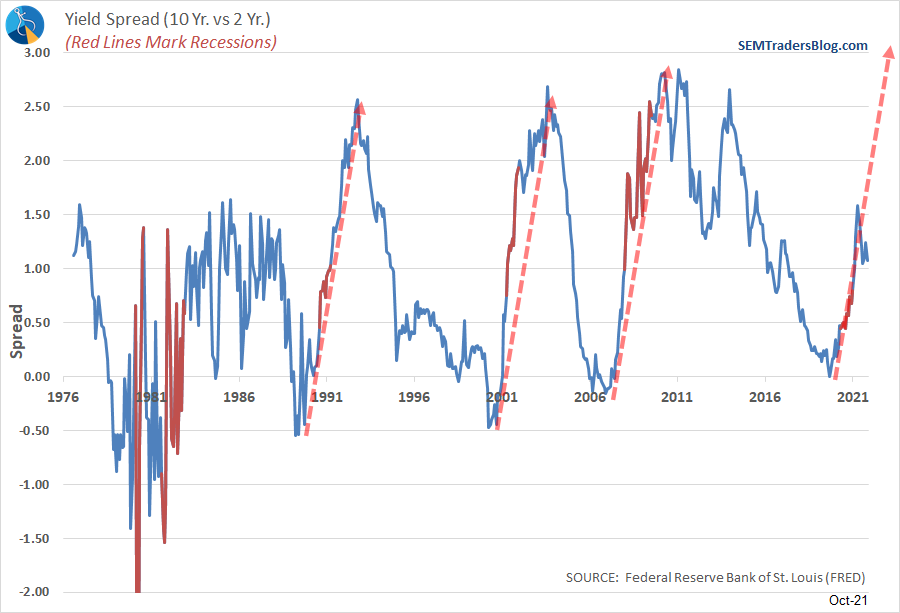
The bond market is starting to price in a slowdown and/or STAGFLATION (or 'slugflation'). Until last week bonds had mostly shrugged off the slowing economic data and higher than expected inflation. Last week we saw the 2-year yield spike, which dropped the 10 year - 2 year yield spread significantly. Normally coming out of a recession we would see this spread skyrocket (as shown by the red arrows below). Maybe this is a short-term phenomenon, but the bond market is warning us that something may be breaking down in our economy. We also saw high yield bonds begin to sell off last week to a point we may get a sell signal in our high yield models soon.
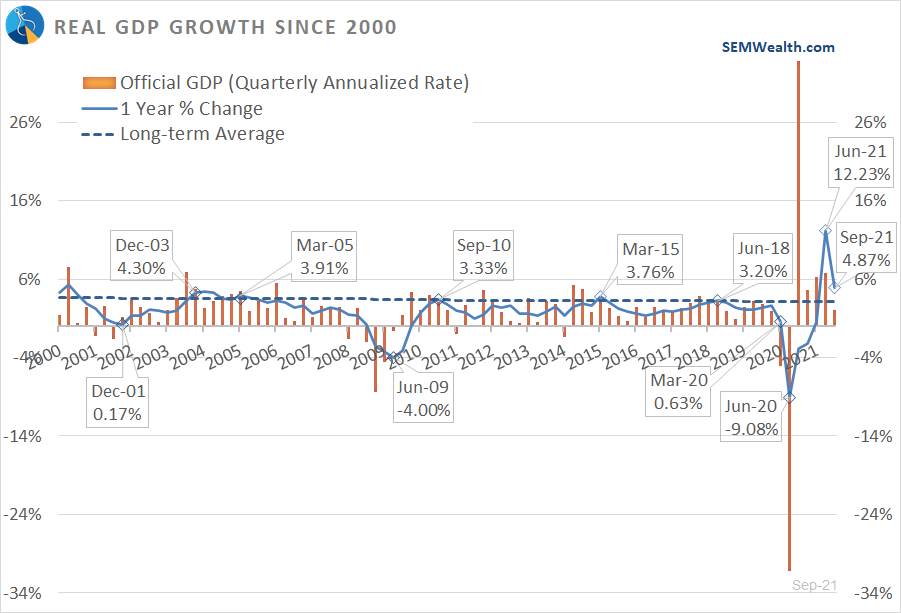
GDP is heading back to BELOW 'NORMAL'. The Q3 annualized number came in at 2%. Long-time readers know we focus on the 1-year change. It is still above the long-term average, but is likely to fall back below average in the next quarter or two.
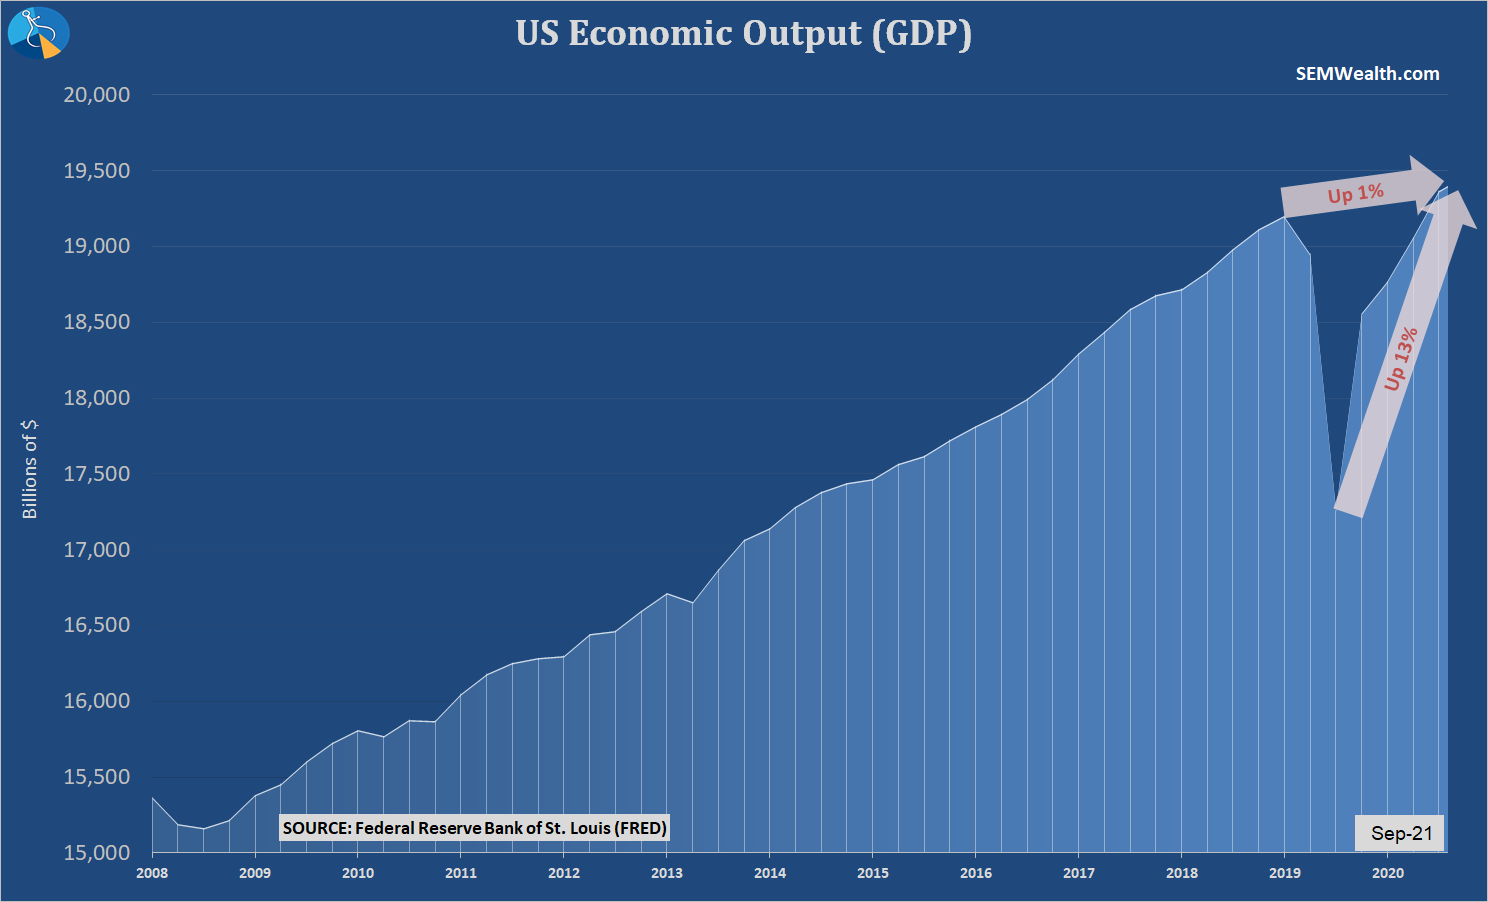
$5.3 Trillion of stimulus lead to 1% GDP growth. Something is broken in our economy and more and more debt won't fix it. It wasn't just COVID. We added more than $12 Trillion to our national debt from 2003 through 2019 and yet we only had above average growth a handful of quarters. Now all of that debt has to be paid back with future revenue.
We will not have our official update to our economic model, but so far it looks like we'll probably stay in "transitioning" mode this month. The data is weakening, but not enough for the model to confidently move to "bearish" mode. There are a lot of moving parts and a lot of unknowns, which makes a data driven, analytical approach important in the months ahead.


