
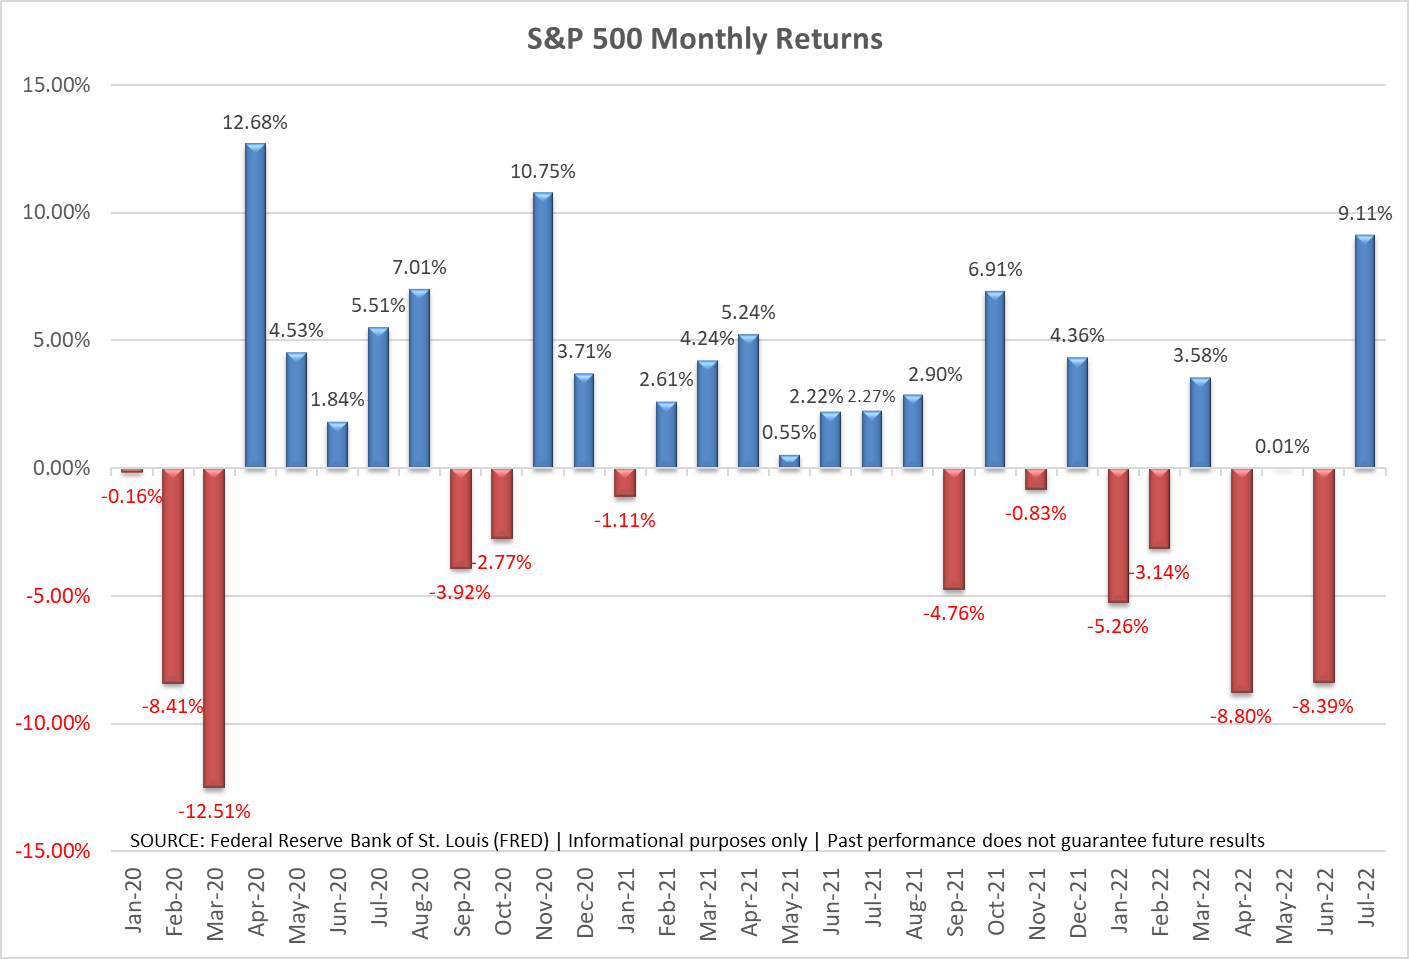
The S&P 500 just posted its best month since November 2020. This has led many market 'experts' to declare the "Bear Market" over, marking it up as just a temporary bump in our recovery from the pandemic. The month closed with another impressive week, which included yet another 3/4% hike in interest rates by the Fed and a report showing a second consecutive quarterly decline in economic output.
The chart below really highlights the big swings in the market following a nice, steady climb from February 2021 through August.
Before we get too excited, we should look at other periods to keep things in perspective. Here are the monthly returns from just before and during the 2000-2002 bear market.
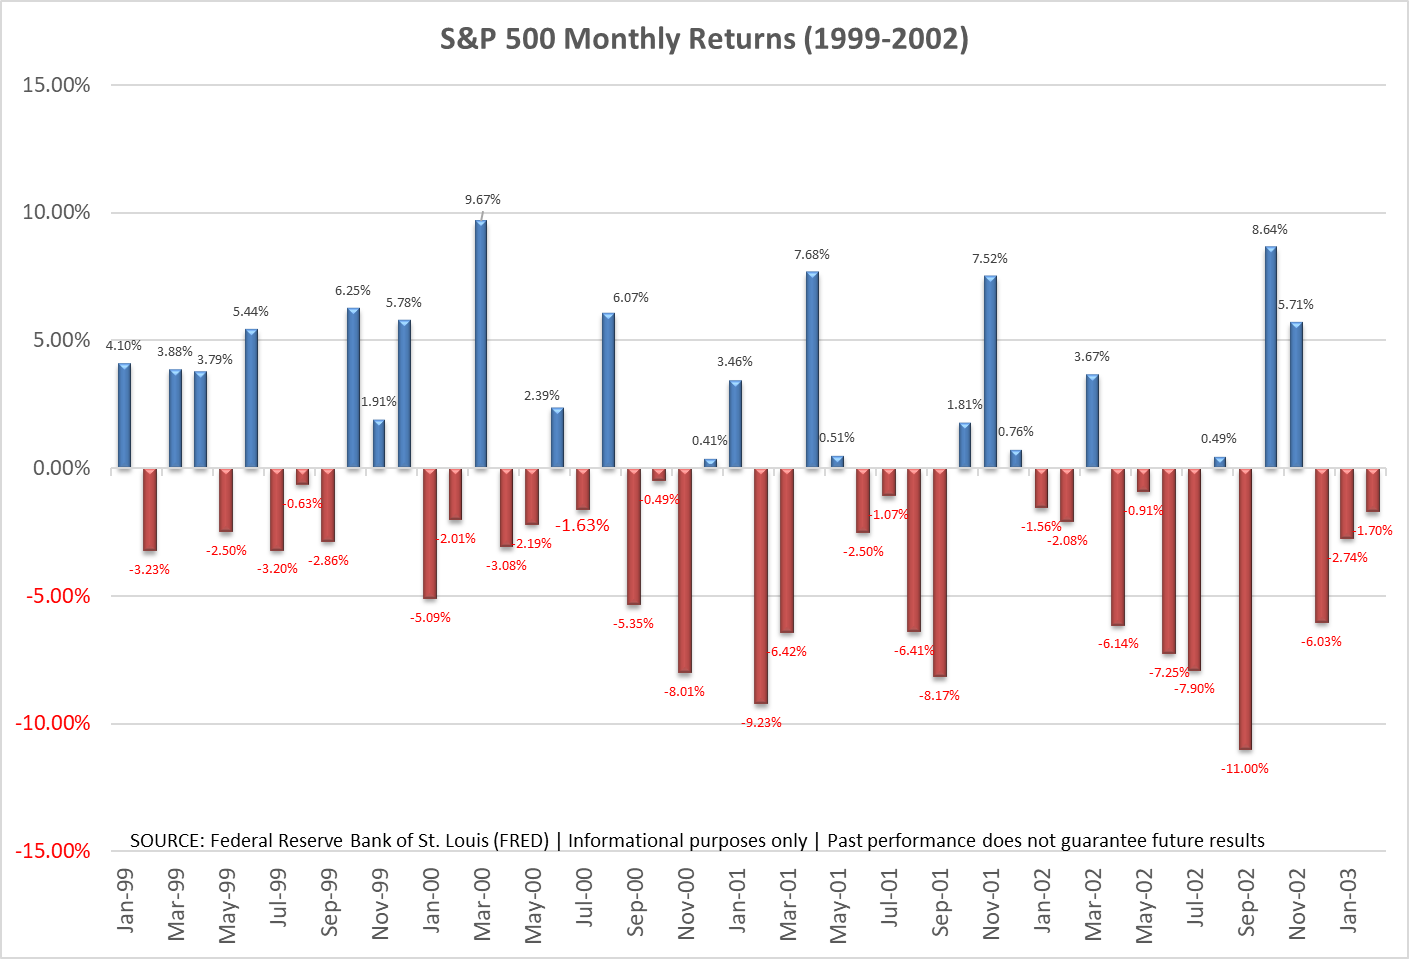
Note there were plenty of "the worst is over" rallies during that time. One of the reasons cited for the big rally last week was a hint the Fed may be done RAISING interest rates soon. People forget the Fed began LOWERING interest rates in June 2000 (after raising them to take away their pre-Y2K stimulus programs.)
If you're in the camp of "the Bear Market is over", I would strongly encourage you to watch our short 'Bear Market Tips' video below:

Look, I hope the Bear Market is over. We all are losing money (just not as much as a passive/buy & hold strategy). I prefer seeing everyone's account values going up, but hope is not a strategy. Instead we rely on the DATA, not our opinions (our natural tendency to believe the worst is over every time the market goes up).
As mentioned last week, our tactical high yield strategies inside Tactical Bond, Cornerstone Bond, Tax Advantaged Bond, and Income Allocator all see signs there is a potentially decent rally in high yield bonds. They finished buying into these risky bonds last week. My subjective opinion based on 25+ years' experience and our data driven models is this is going to be a shorter-term trade that could go into early fall. I hope I'm wrong and this turns into something more sustainable, but again, hope is not a strategy.
Are we in a recession?
For my entire career, the textbook definition of recession (which I've never liked) was 2 or more consecutive quarters of declining economic output (Real GDP). The actual "official" declaration of a recession comes from the National Board of Economic Research (NBER), which I've always criticized because they wait until well after the recession has started (or ended) to tell us whether or not we are in a recession. Last week the White House spin machine was out telling us why this is not a recession (not a political statement, both parties are guilty of this when they are in control). It went as far as Wikipedia changing the definition of recession and then locking the entry from further edits.
Our long-time readers know I don't like how they calculate GDP. They essentially take the last quarter's growth and multiply it by 4 (I realize it's slightly more complicated than that, but you get close to the same number using this simple math.) We don't calculate any other annualized rate this way, but that's just how they do it. I use this chart to illustrate the difference between the official number and the actual 1 year change.
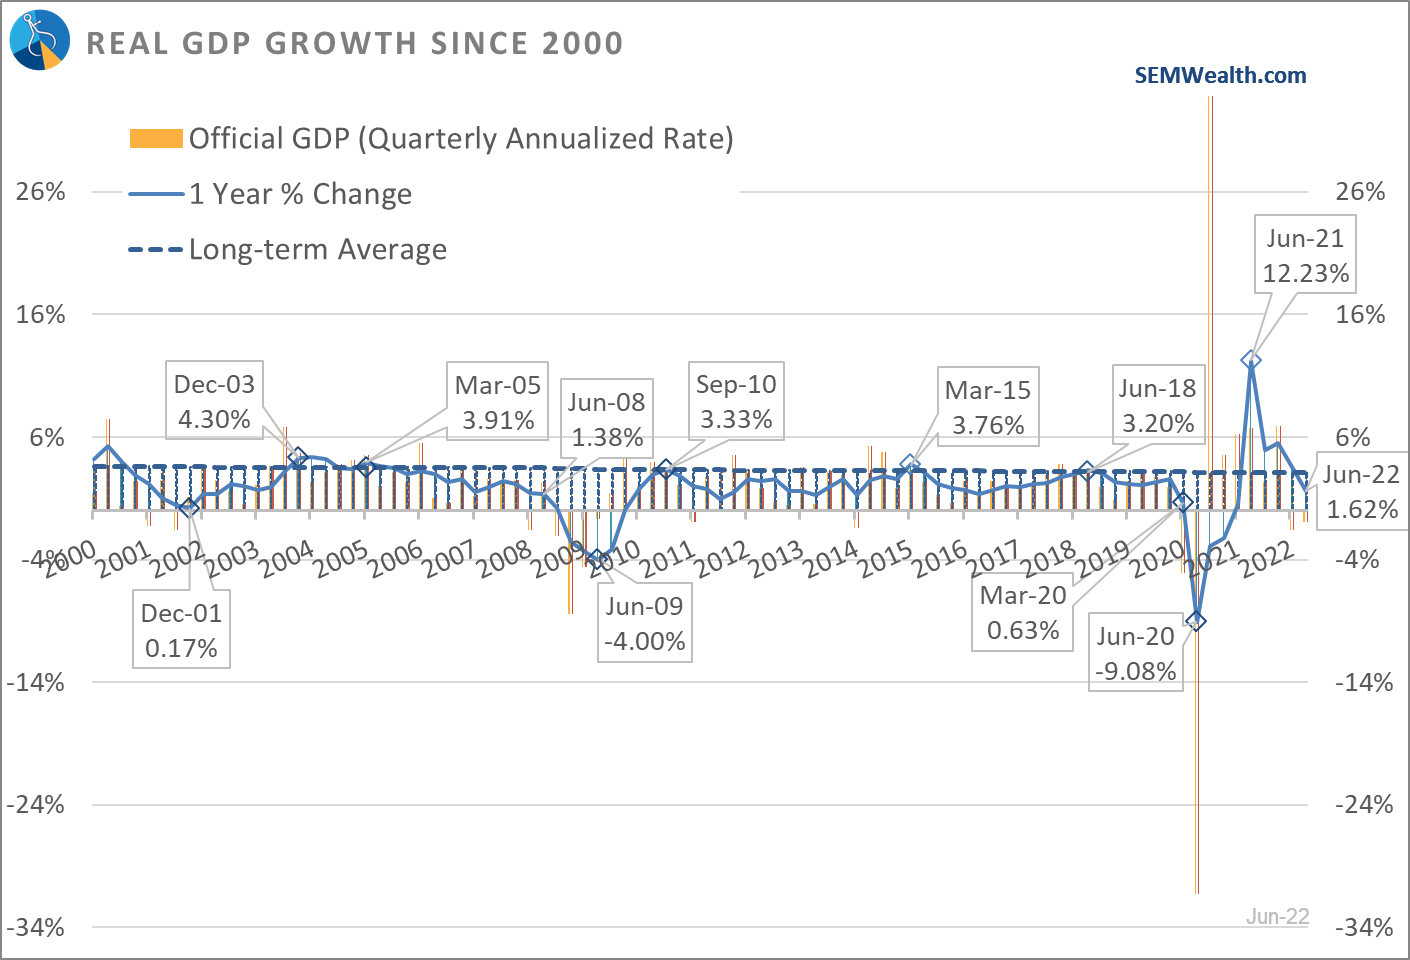
Very rarely does the 1-year number go negative, but we can see the economy is WELL BELOW the long-term average and is just above where we were in June 2008. The "official" recession during the Financial Crisis didn't "begin" until after the 3rd Quarter GDP number was released at the end of October. NBER declared the recession in November 2008.
As financial advisors and investors, we don't need to get lost in these political semantics. The economy is slowing (as our economic model warned us in April of this year). We will take a walk through all of our economic data next week as we close out our July model update, but I want to call your attention to this chart, which I identified at the beginning of the year as the most important chart for our economy.
Putting aside all pre-conceived opinions, if I said, Disposable Personal Income (what we have left after paying taxes and inflation) was all the way back to January 2020 (pre-pandemic) levels, is the economy strong or weak?
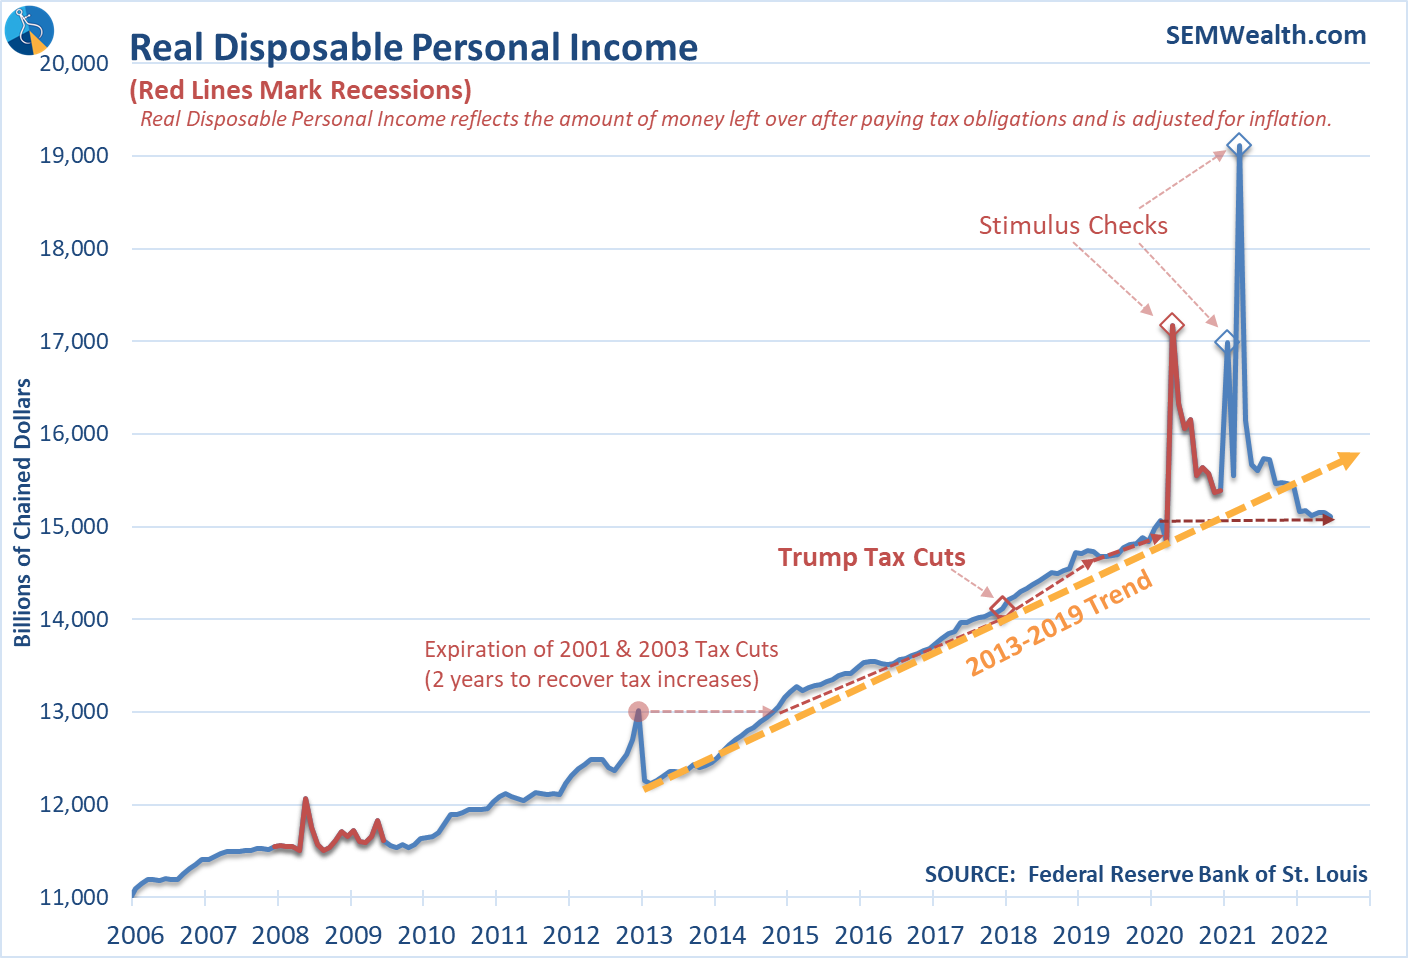
In the long-run that is all that matters. American families are making much less than they were a year ago. This will be a drag on the economy whether an official recession is declared or not. This will be a hit to S&P 500 earnings, which have yet to be adjusted down. This will lead the multiple (P/E ratio) on the S&P 500 to be reduced.
Enjoy this rally as long as it lasts. Again, I hope I'm wrong, but I would use it as an opportunity to "right-size" the risk you are taking in your account. If you're not sure if you are in the right portfolio, take our quick risk questionnaire here.


