
One of the comments following the jobs report last week was, the labor market is 'normalizing'. That led me to question, 'what is normal?'
We completely shut down the physical economy in 2020 to fight a global pandemic. Congress and the White House (from both political parties) voted to dump 25% of GDP into the economy via 'stimulus' to everyone, including those people who were able to work from their laptops or were retired and living on pensions and social security checks. The Federal Reserve then leveraged this and financed it with Quantitative Easing (meaning 50% of our economic output was dumped into the economy.)
Those who didn't need the stimulus spent it on bigger houses, home improvement projects, new vehicles, and still had money left over to invest/save (sparking disconnects in the supply chain and double digit increases in inflation for many materials). Others used it to pay off their debts. While a large group of people used it to start new careers or their own businesses. As the economy opened back up families took multiple trips to make up for lost time and memories. At the same time, offices were slow to require workers to return 5 days a week and those who attempted to do so were meant with rebellion from their workers who argued they were more productive at home.
Considering just the last 3 years, what do you define as "normal"?
Let's go back a bit further in time — going into 2018 Congress and the White House despite 9 years of economic growth decided to stimulate the economy even further by passing tax cuts – permanent ones for corporations and temporary ones for everyone else. I argued at the time that the cost of the tax cuts would be far more than the benefits for the simple fact we were already in an economic expansion with the economy running near full capacity. Most academics agree they certainly did not pay for themselves.
We saw an uptick in the economy in 2018, but by the middle of 2019 things were breaking. Twice the Federal Reserve had to resort to some emergency measures to shore up the financial system. The yield curve had begun to invert as corporations decided to use their tax cuts to pay dividends and buy back stock rather than to invest in long-term projects. SEM's economic model went bearish at the end of 2019 as the economic data was slowing dramatically.
Considering the 3 years prior to COVID, what do you define as "normal"?
Obviously we could go back even further in time. The unprecedented bailout of the financial system in 2008-2009 and then the slow unwinding of those 'emergency' measures led to all kinds of changes in our economy. Believing the Fed was there as a backstop, banks took on excessive levels of risk. Interest rates were pushed to artificially low levels, which forced more and more investors to take on higher and higher levels of risk.
Considering the last 15 years, what do you define as "normal"?
"Normal" is a relative term which is defined differently by different people based on their current circumstances. Our brains will play tricks on us which can lead us to make costly, if not devastating mistakes by believing the current environment is "normal". This is where the value of a data-driven approach comes in. By being able to look back through time with data we can see where the economic cycle has appeared abnormal. In all of those times, the economic system reverted back to the long-term 'mean' (or average).
This doesn't mean our economy doesn't improve, certain sectors become more important, or we cannot shift the curve higher permanently. What it does mean is we need to be careful thinking a 'normalization' will return us to a stable economic (and market) environment.
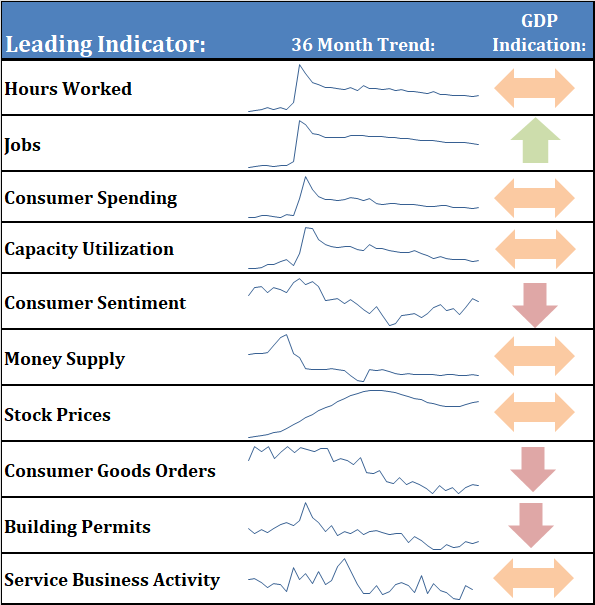
This fall I'm going to attempt to dig deeper into the various cycles our economy has gone through and study each of our leading indicators. For now, here's where each of the indicators stand as we head into September.
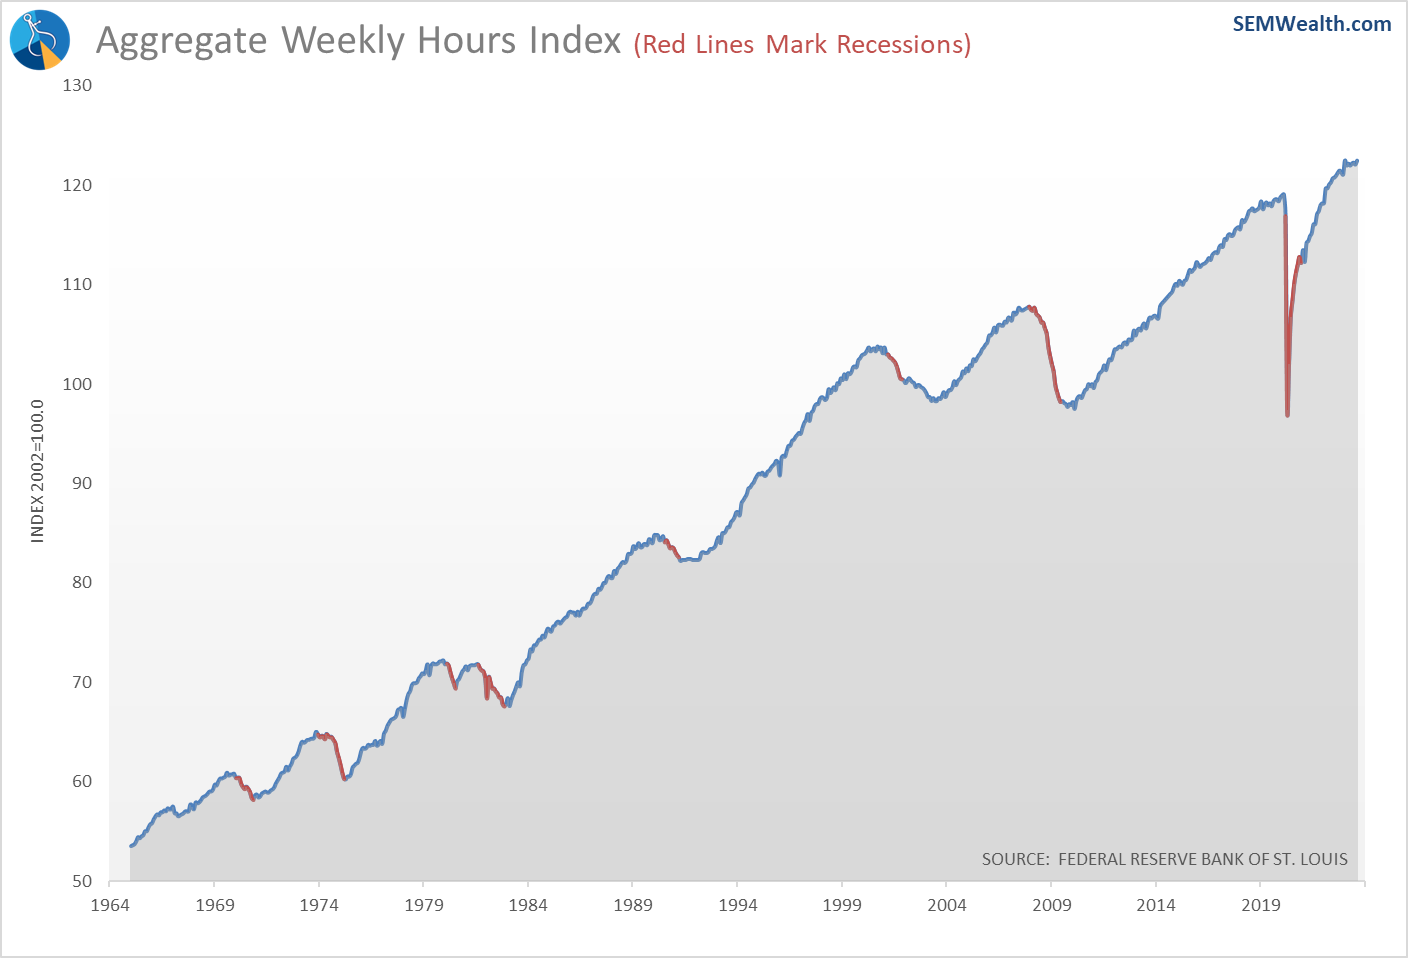
Hours worked are flattening
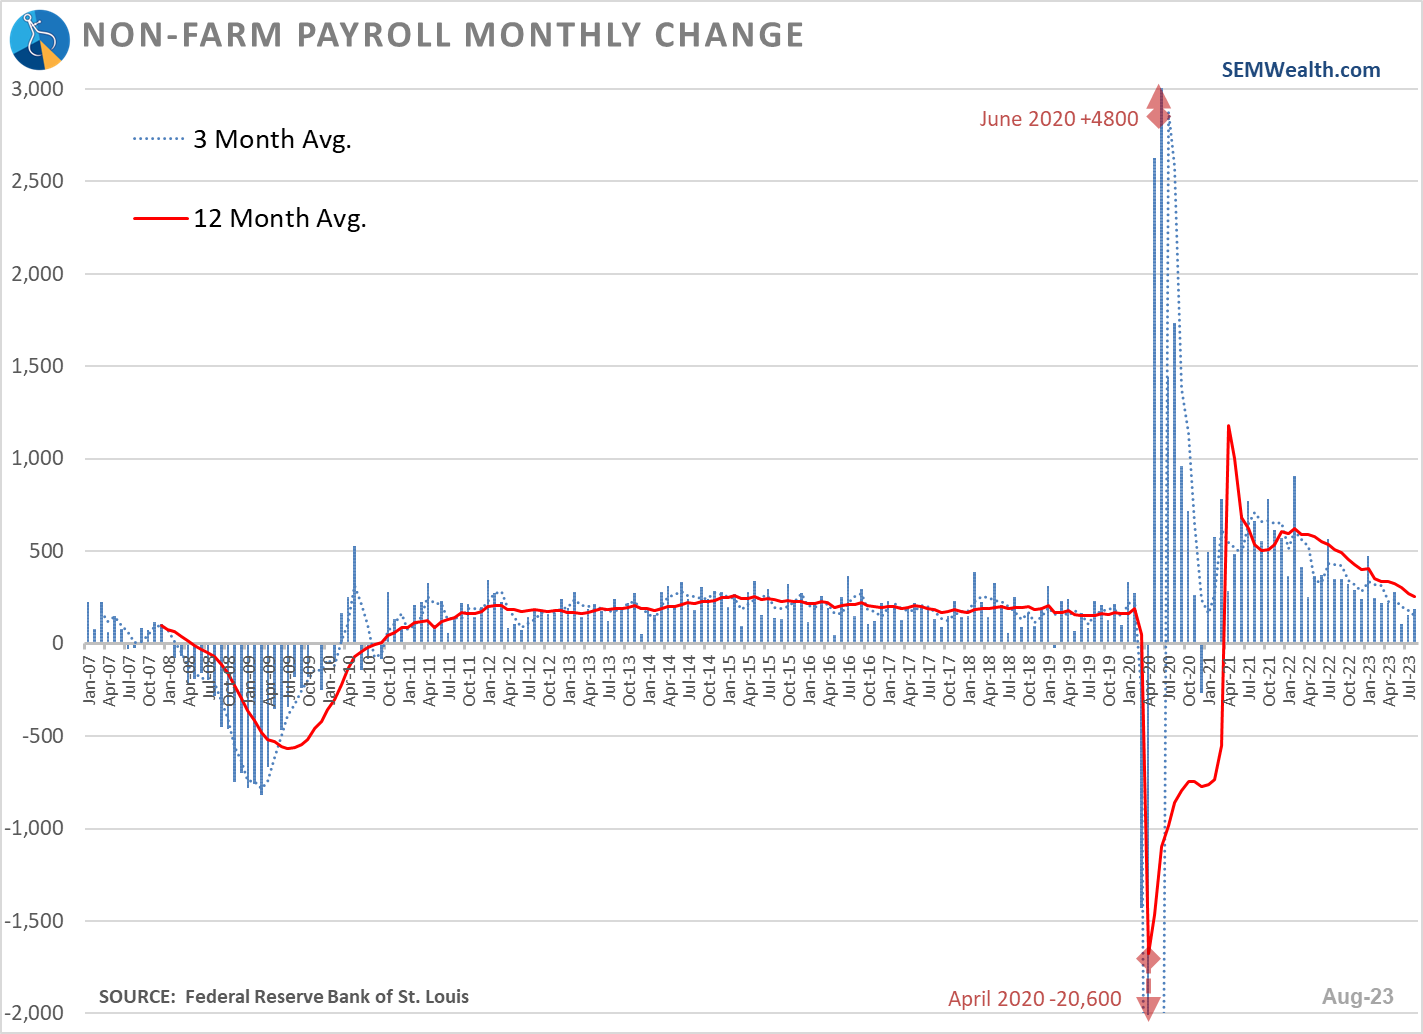
Job growth is slowing rapidly
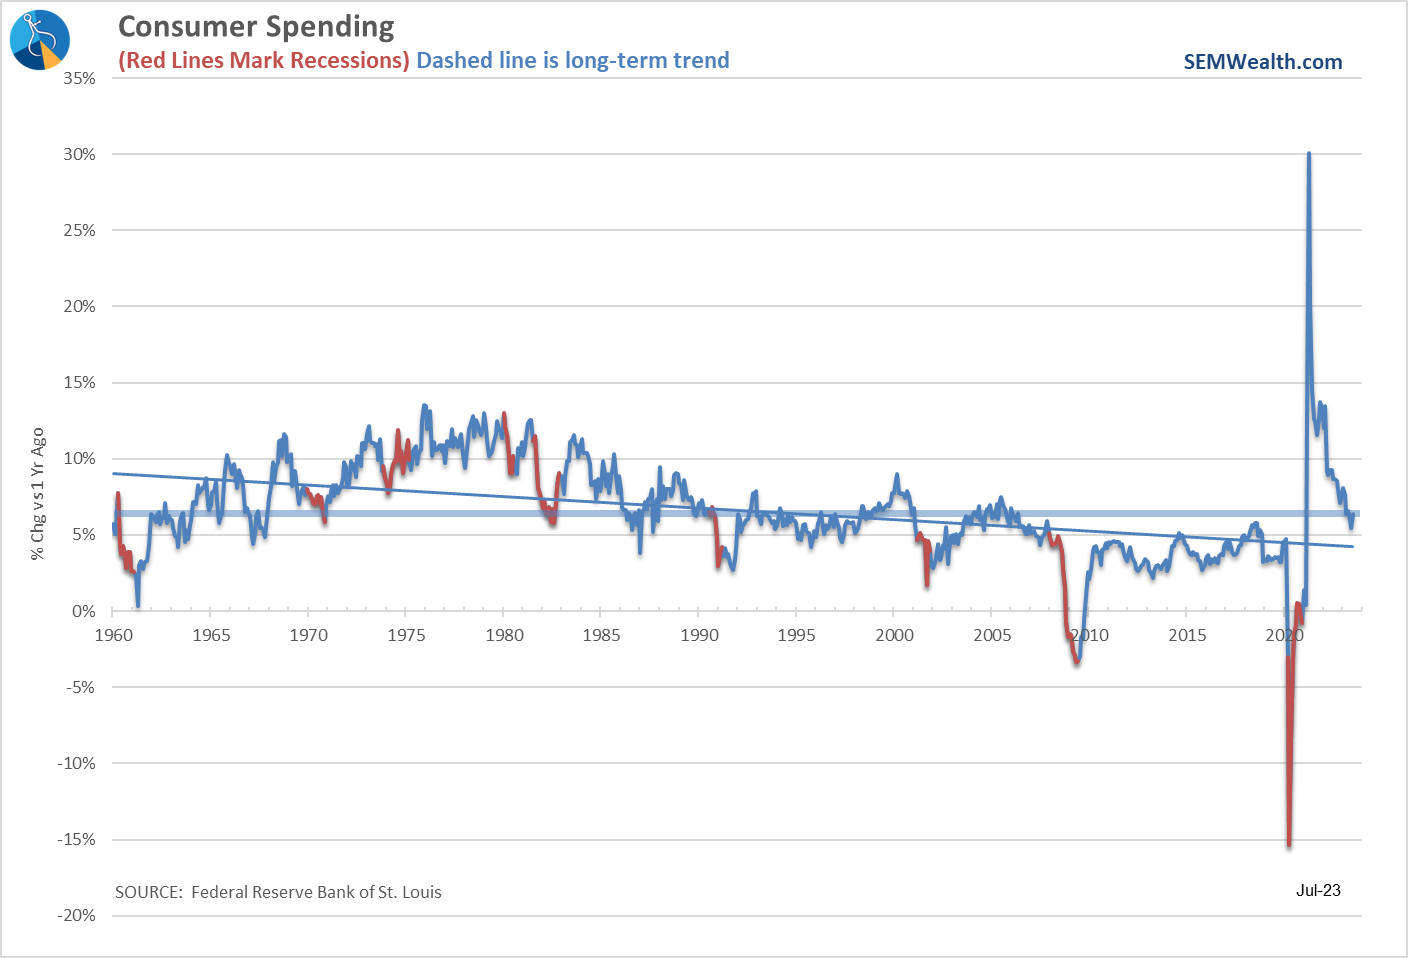
Consumers are still spending at above average rates....
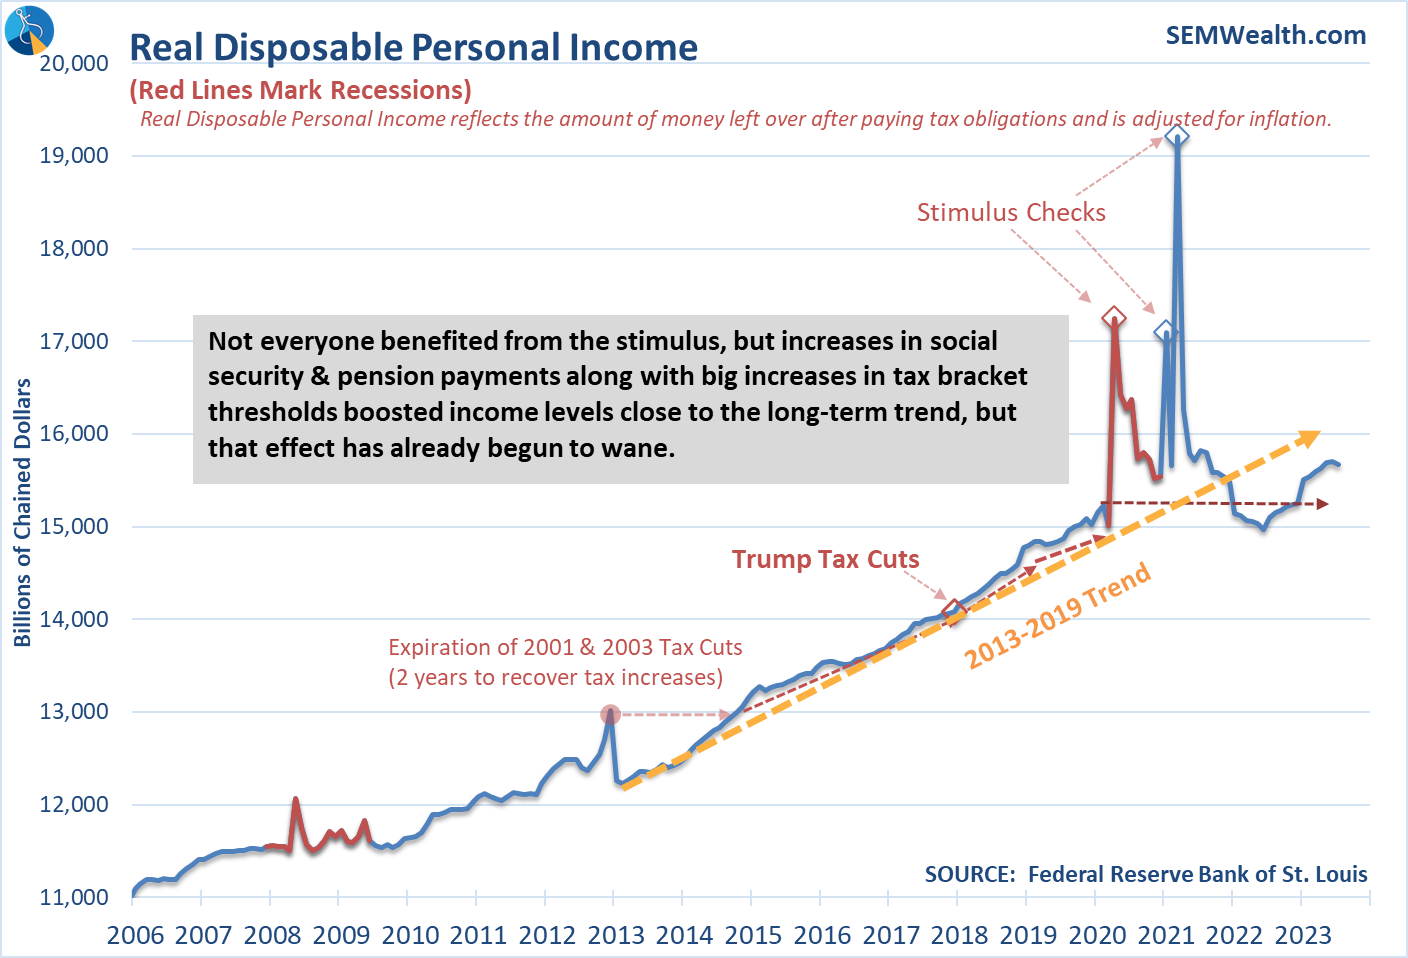
.....but a dip in Personal Income means the savings rate dropped dramatically
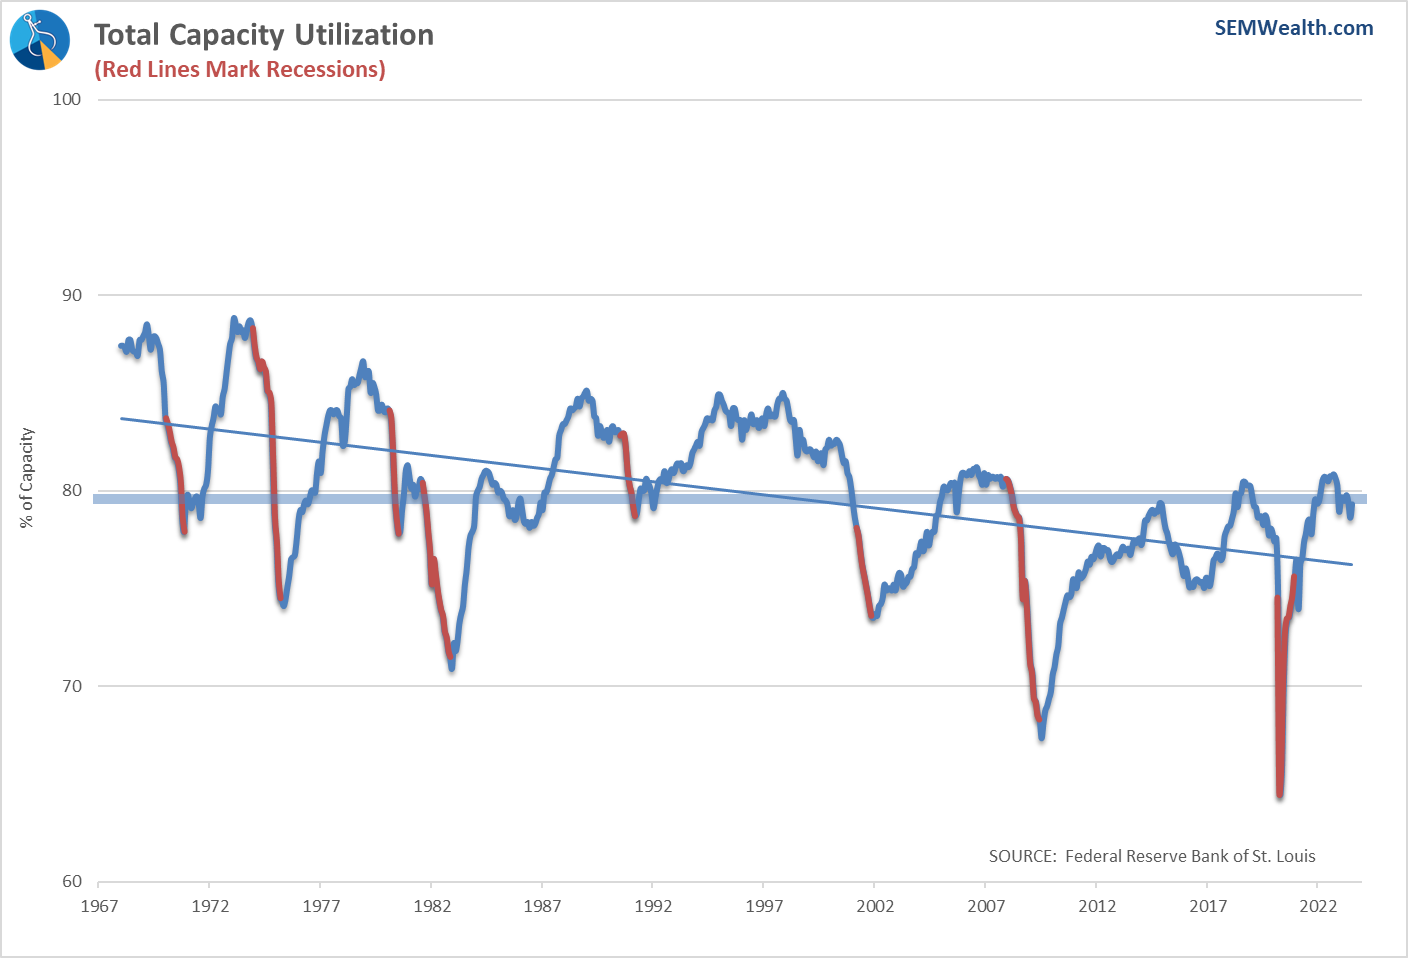
Capacity Utilization may have peaked again for this cycle
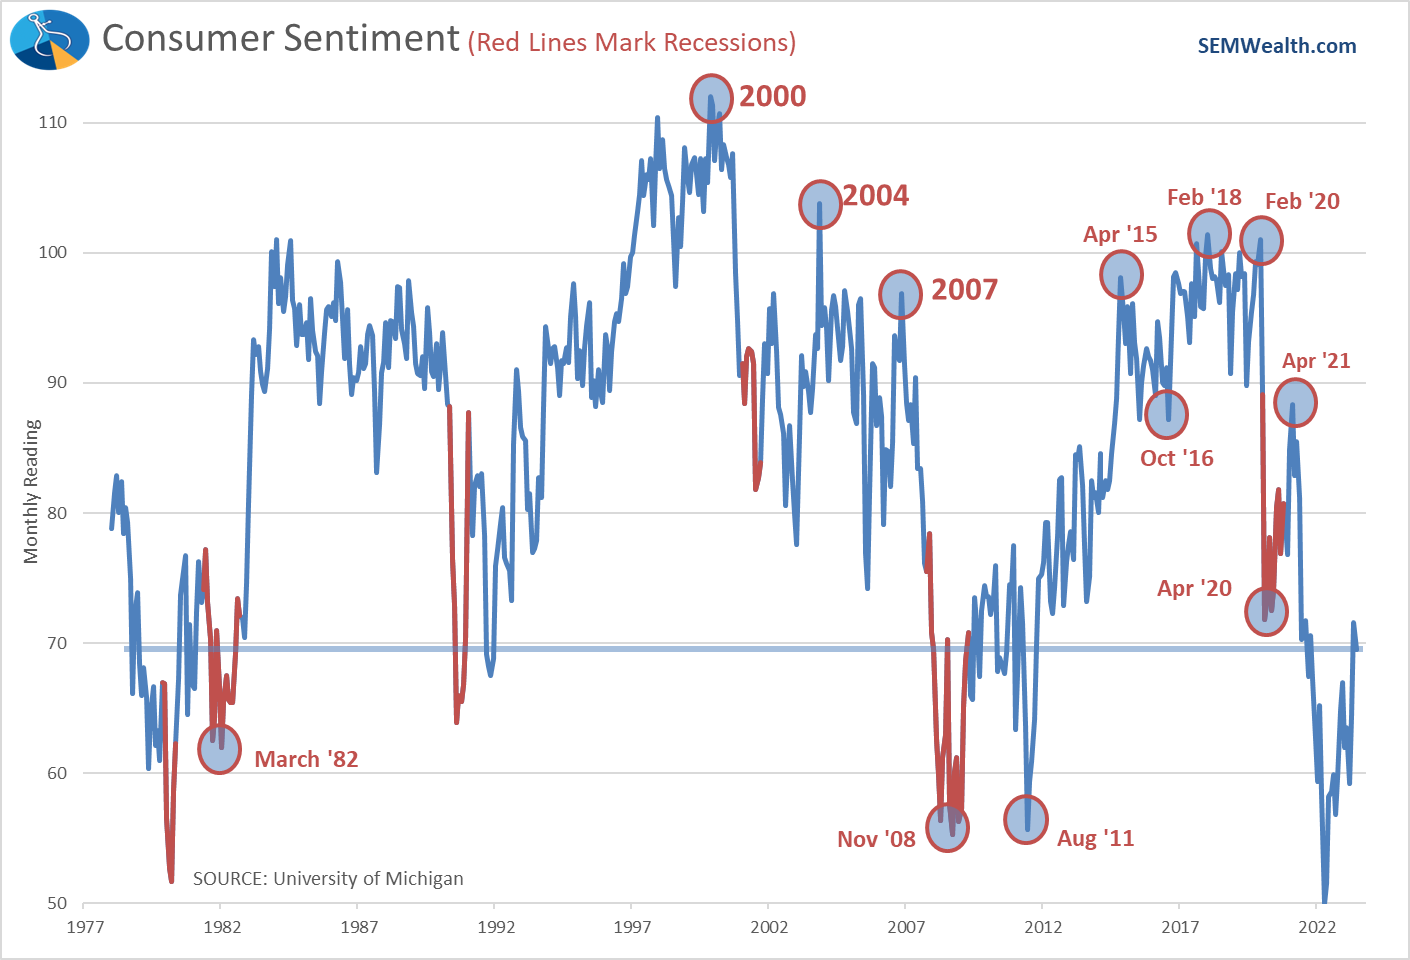
Consumer sentiment has weakened again
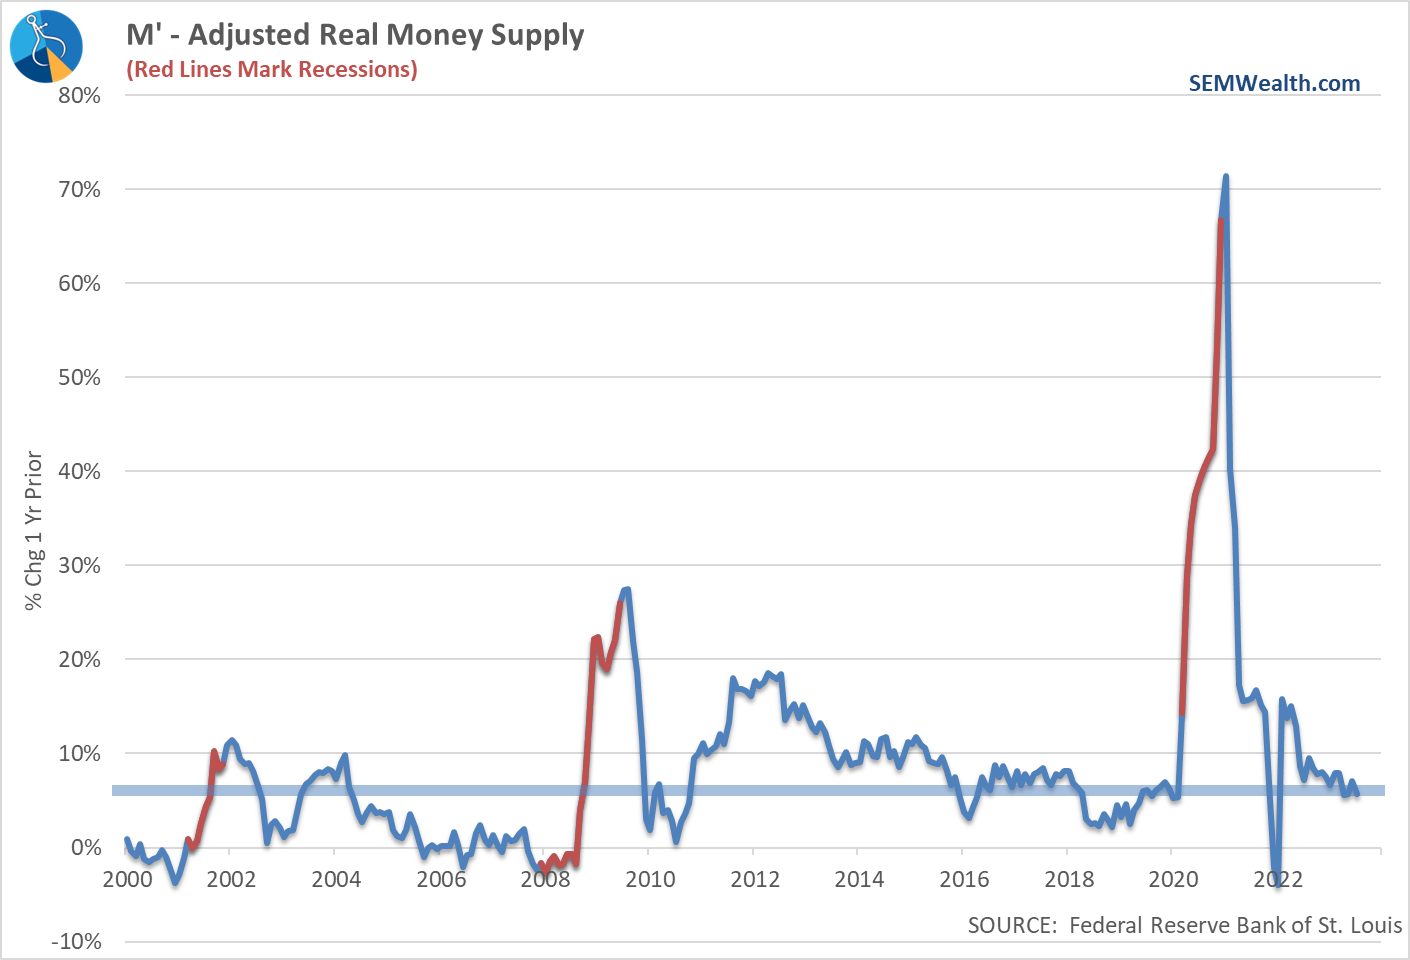
Growth of the Money Supply continues to decelerate...
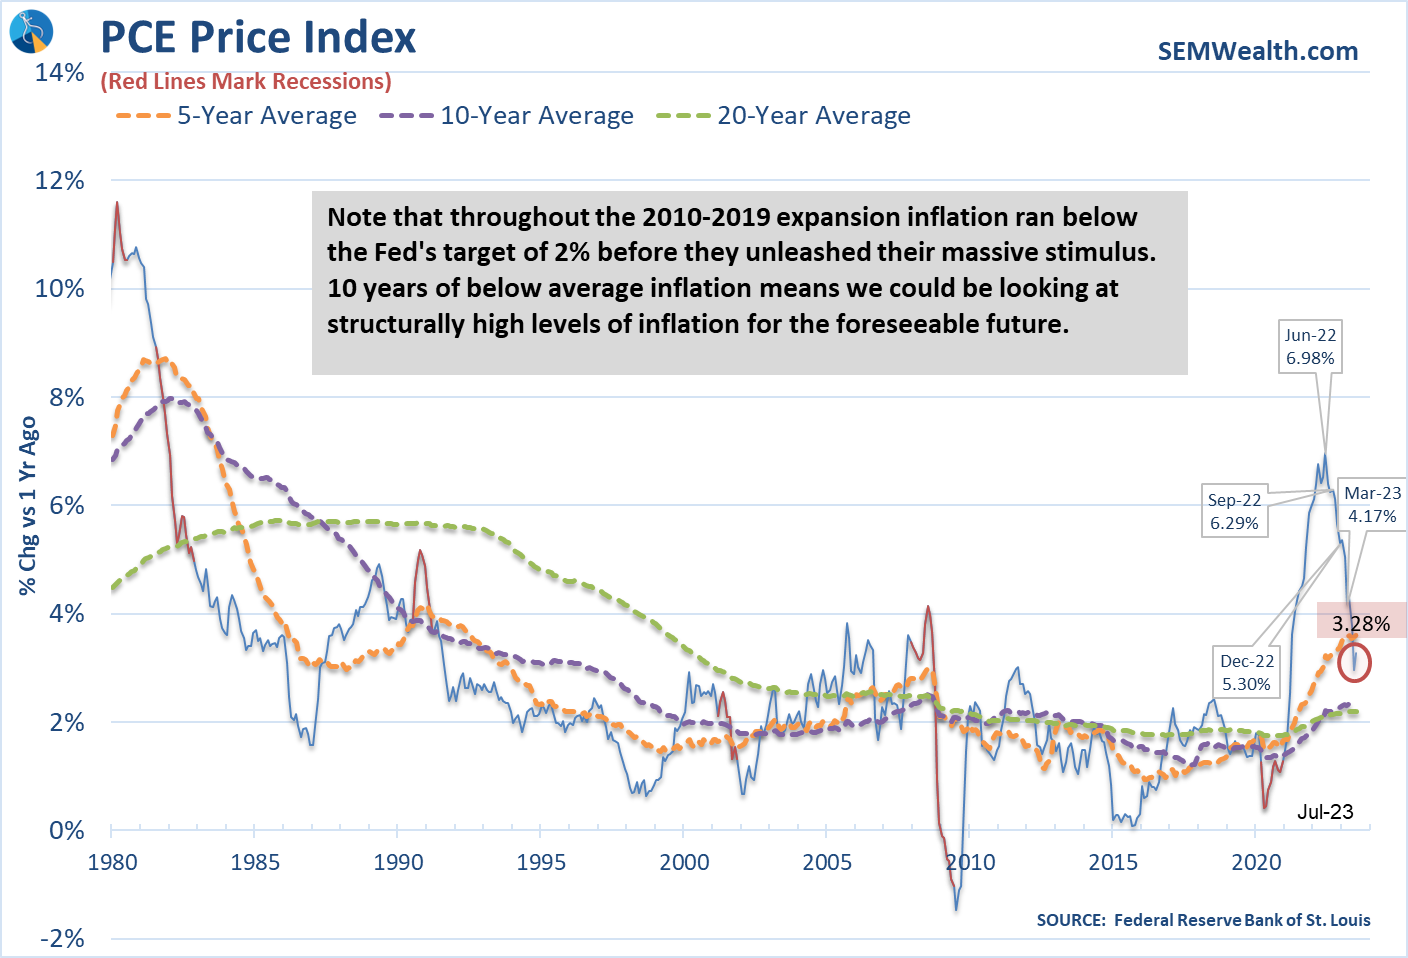
....as inflation remains well above the Fed's target (and rose last month)
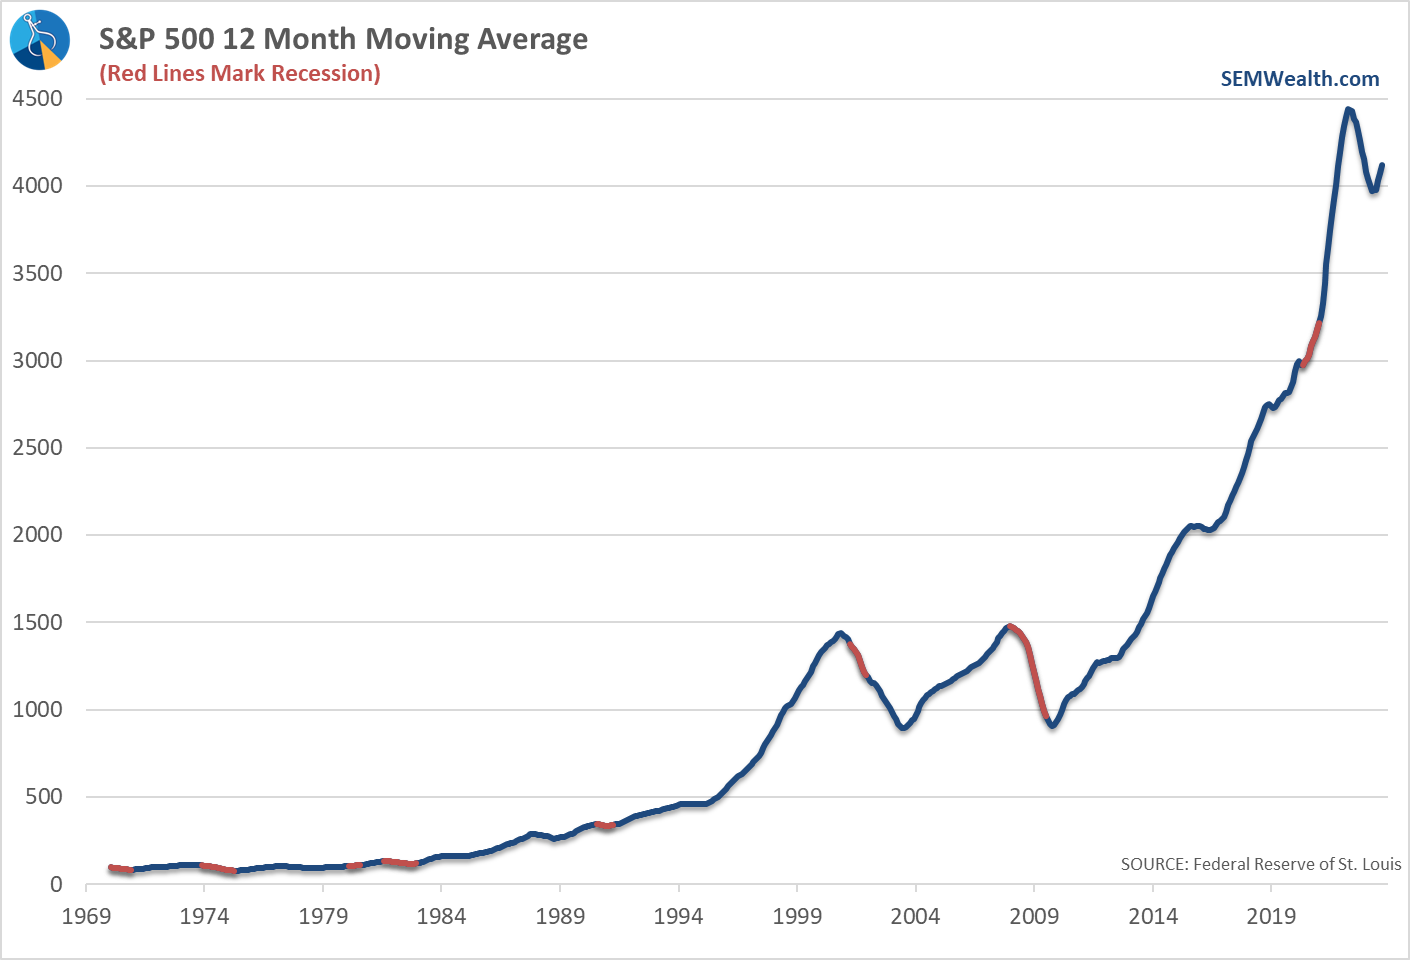
Stocks are still pricing in average to above average growth
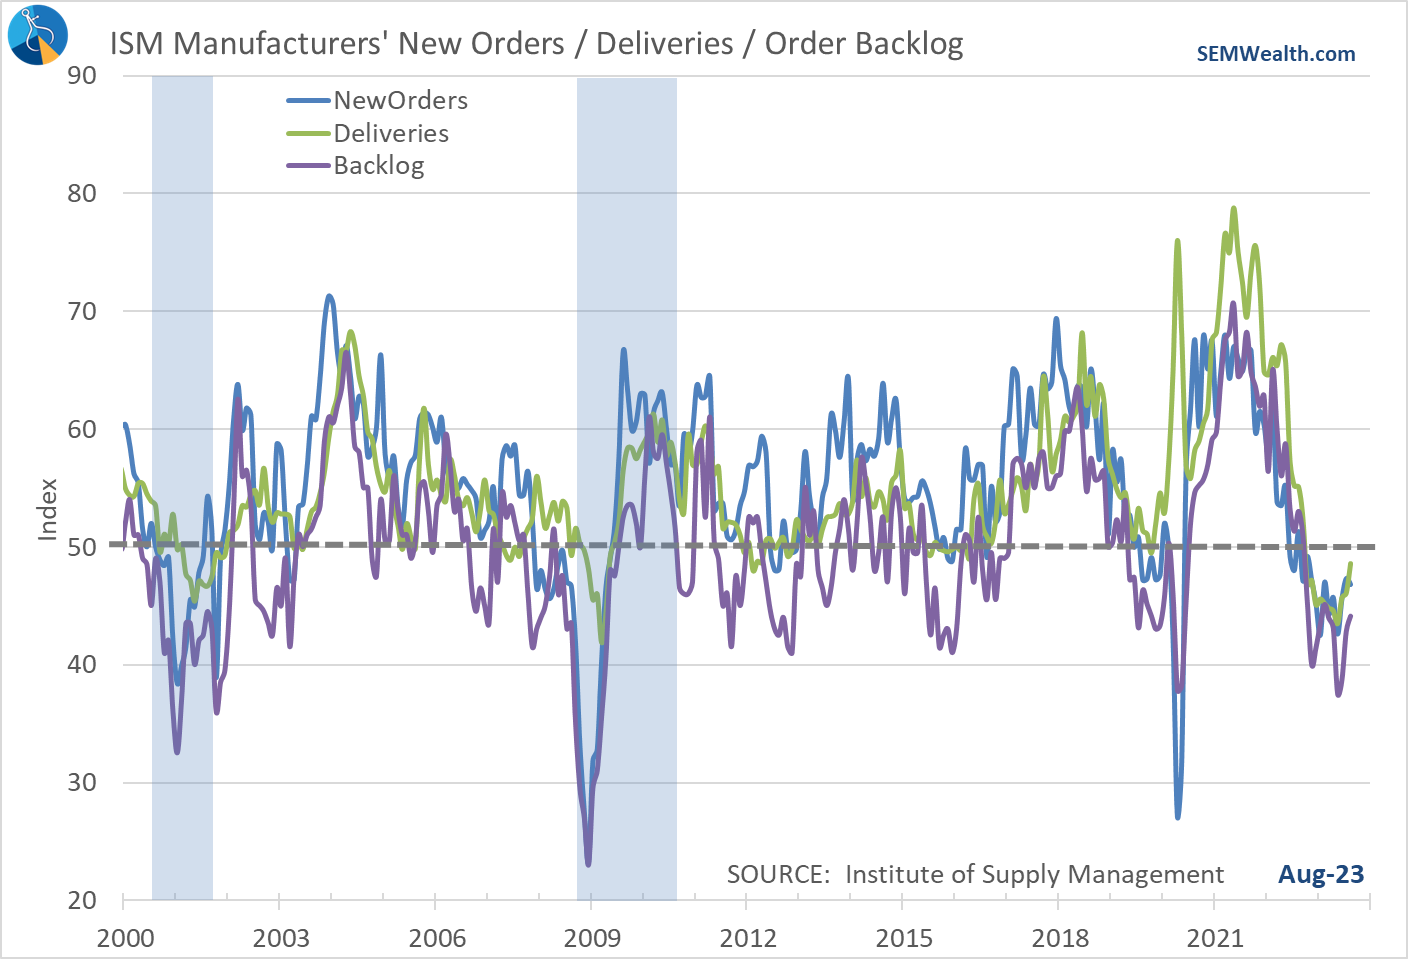
Manufacturing has improved, but is still indicating a contraction
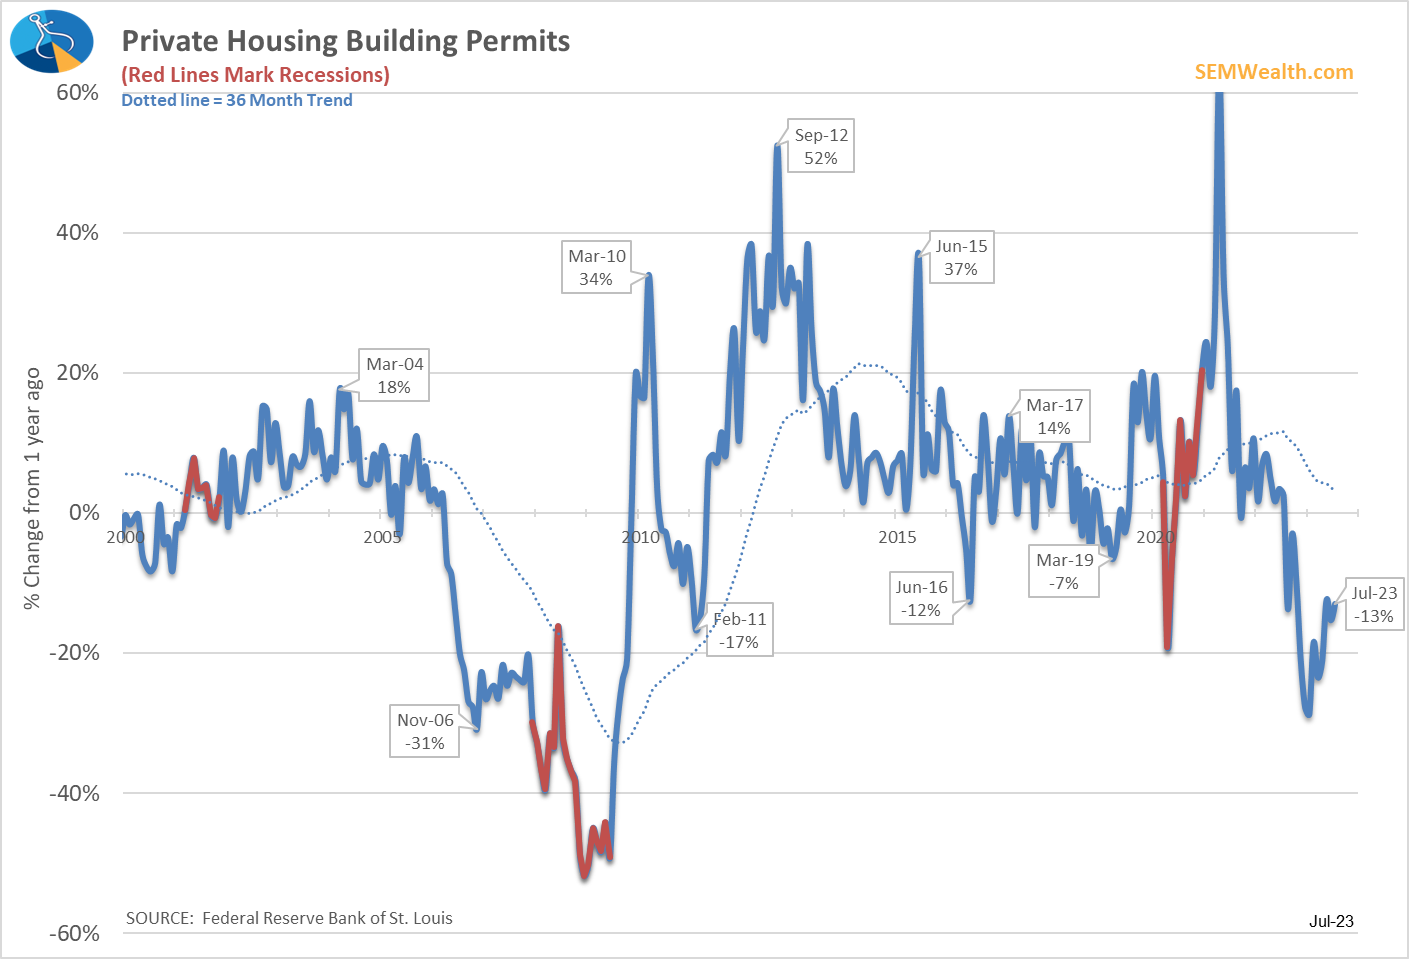
Building permits continue to decline
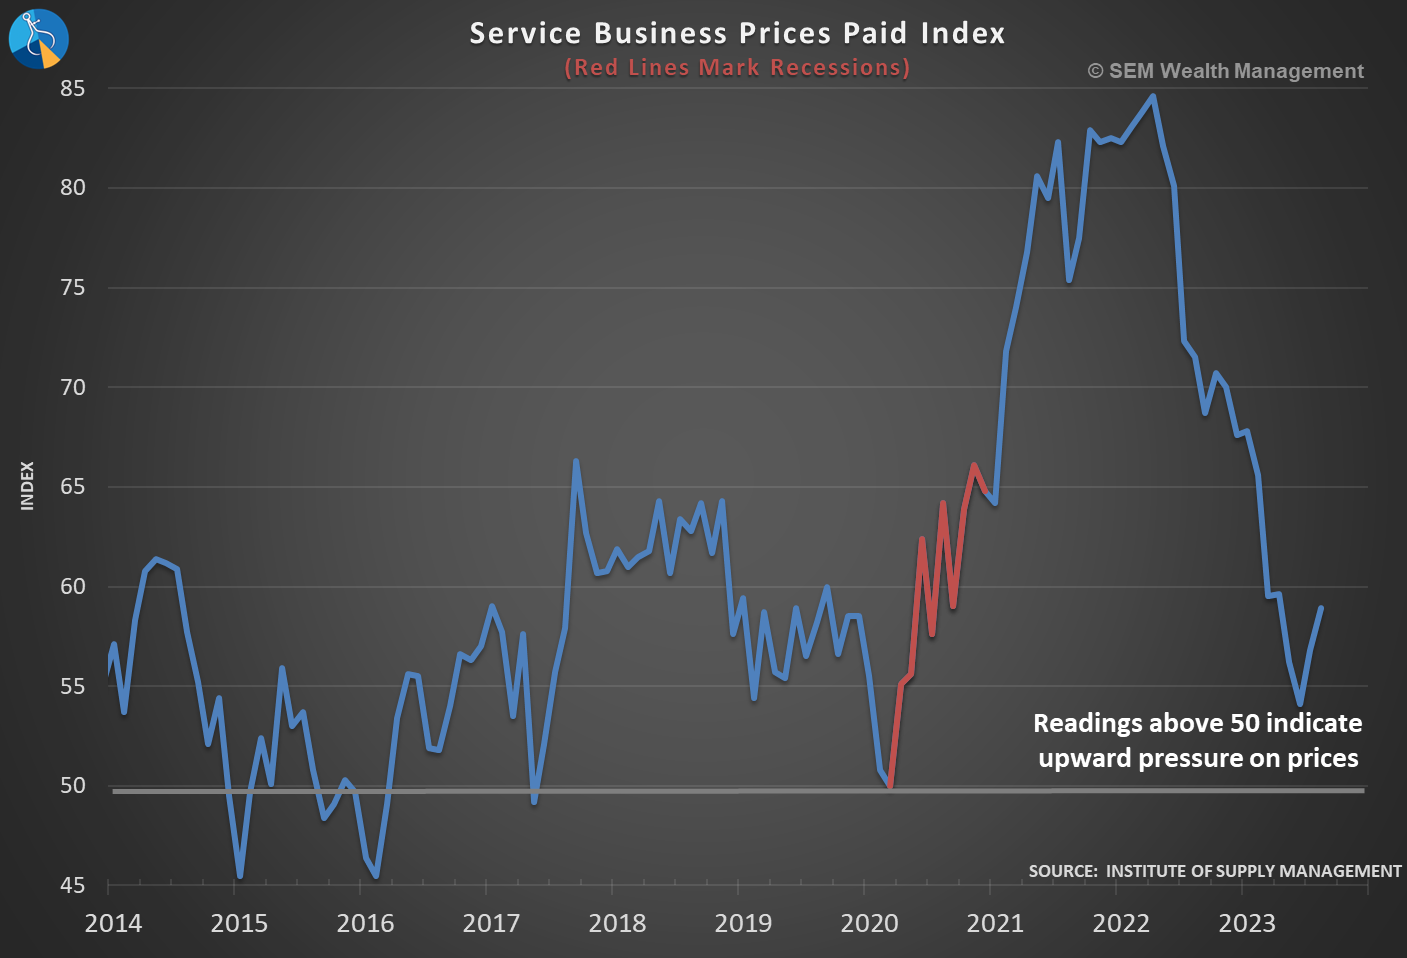
Service business activity remains strong.....
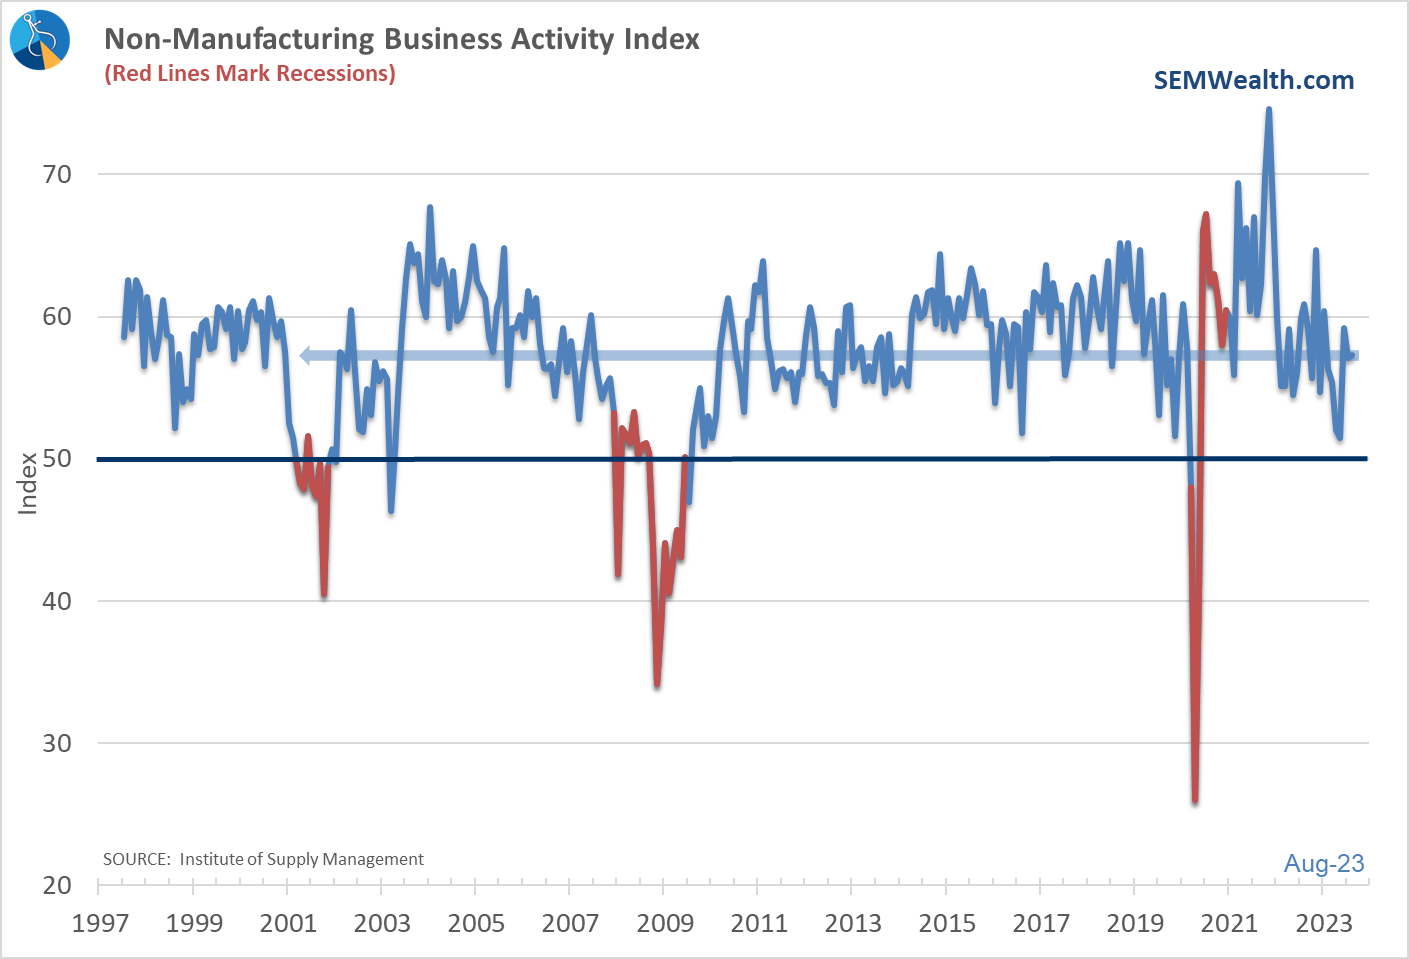
.....but so are prices
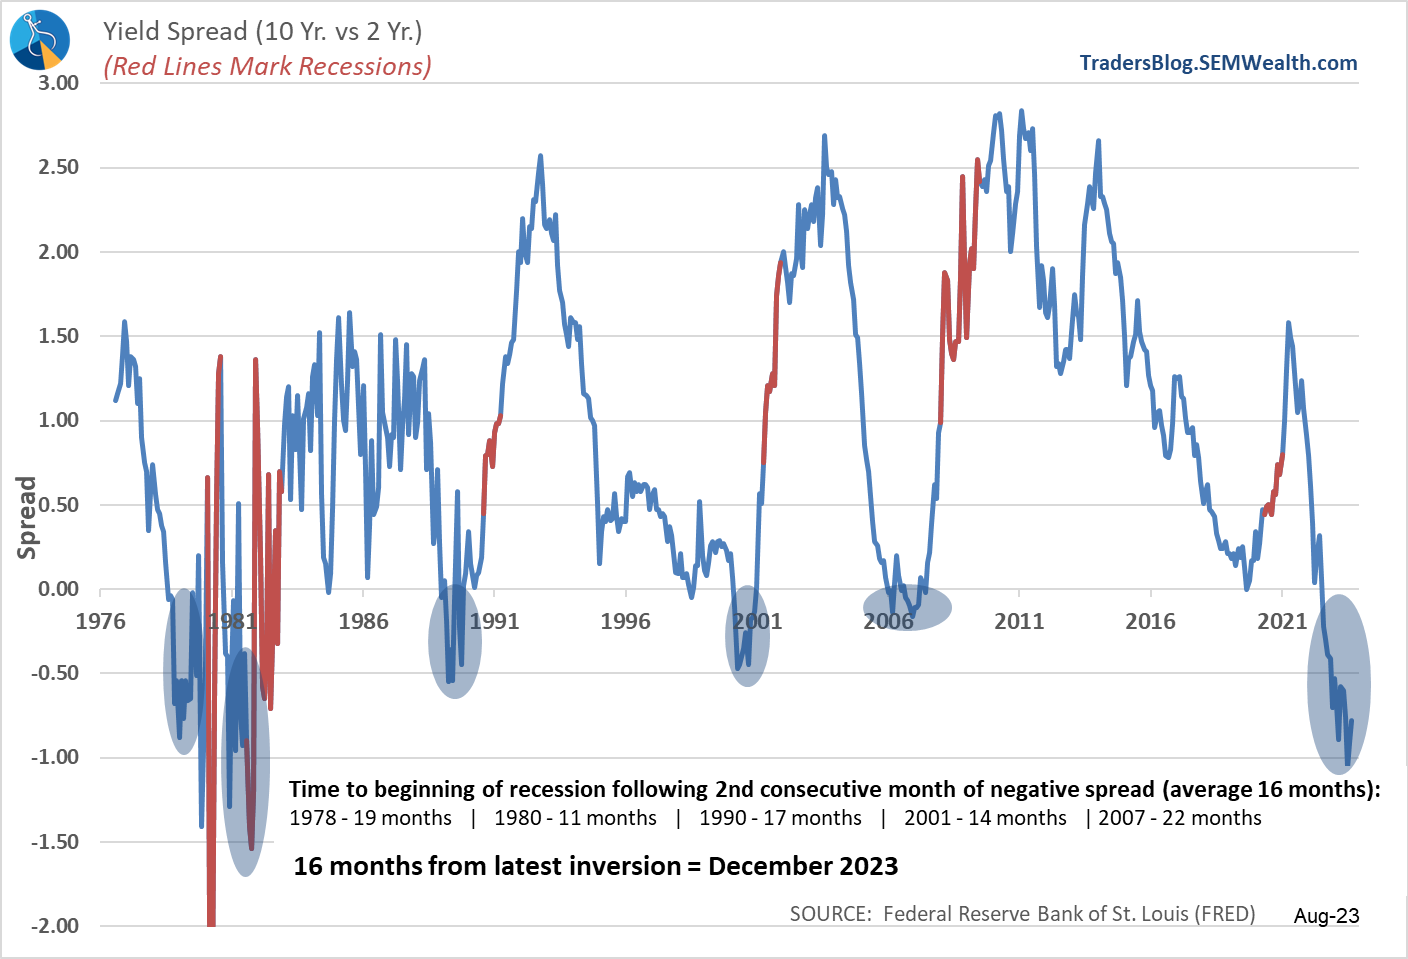
and most importantly - the Yield Curve is still pointing towards a recession
Overall, the labor market is the only thing holding up the economy
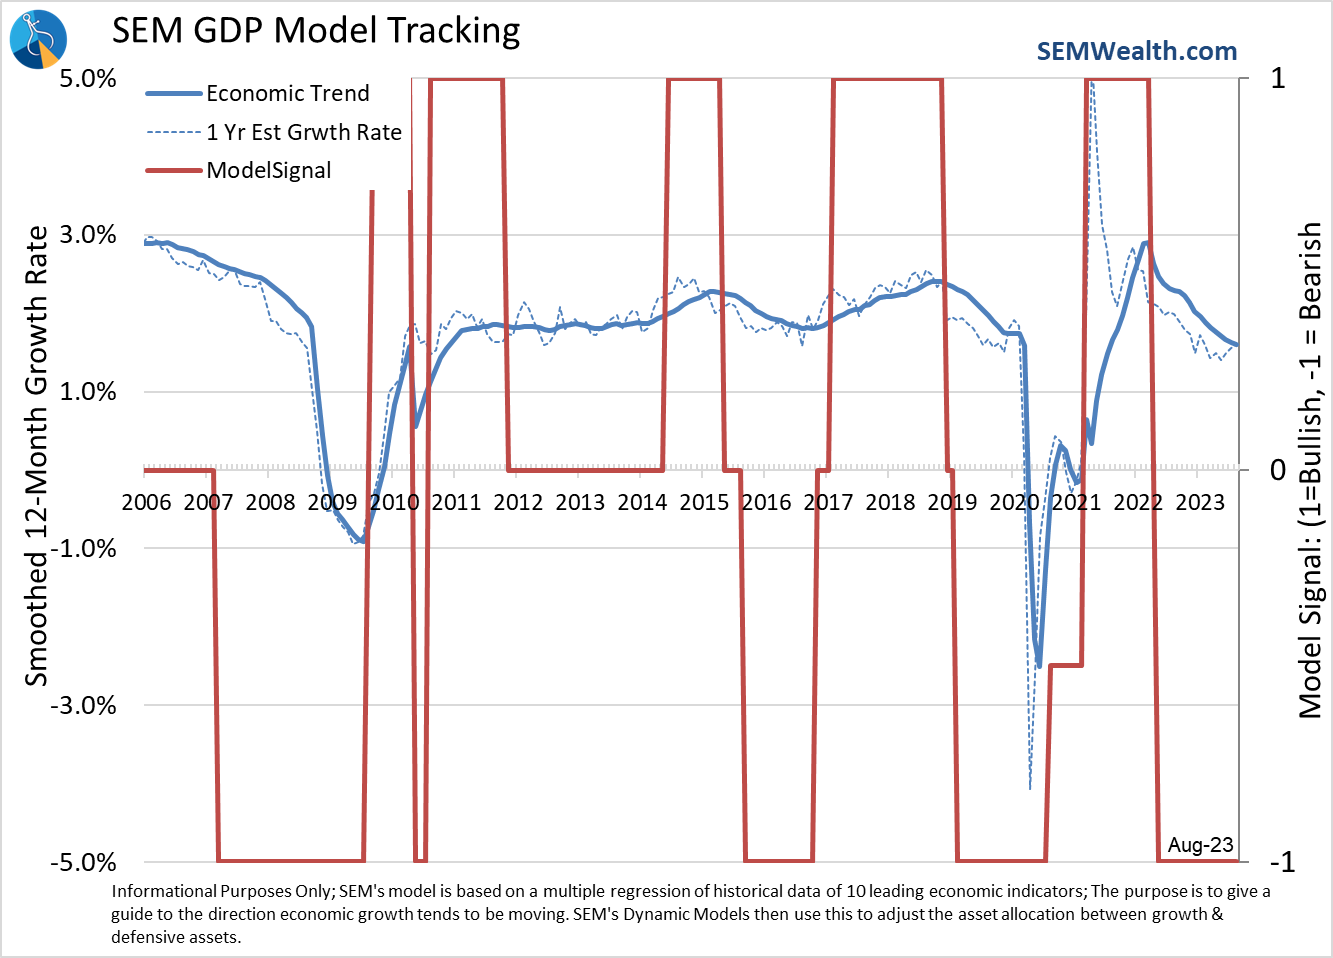
SEM's Economic Model improved in August
Looking at the table above, the improvement was due to several indicators flipping from 'negative' to 'neutural'. Another month like August and we are likely to see our model go from bearish to neutral.
This doesn't mean we are out of the woods, but it is a sign the economy has handled the year following the last stimulus checks without a recession (although some people argue we did have a recession due to the 2 consecutive negative quarters last year).

The question for the economy (and the market which is pricing in strong growth in 2024) is whether the 'normalization' means we are back to the 2012-2017 trends or we still have to deal with the excesses created from the tax cuts and "emergency measures" used to prop up the financial system from 2018-2021.
Whatever the case will be, our data driven approach is designed to help us see through it without any emotions.
SEM Model Positioning
SEM deploys 3 distinct approaches – Tactical, Dynamic, and Strategic. These systems have been described as 'daily, monthly, quarterly' given how often they may make adjustments. Here is where they each stand.
Tactical (daily): The High Yield Bond system which bought the beginning of April remains very close to a sell. Once again after being within one more down day of triggering, a late week rally kept us invested (for now).
Dynamic (monthly): As we've been since April 2022, our economic model remains "bearish". This doesn't mean we are predicting a recession, but rather a slowdown which means a difficult environment for corporate earnings. Other than the technology and discretionary sector this has been the case.
Strategic (quarterly)*: The core rotation is adjusted quarterly. On August 17 it rotated out of mid-cap growth and into small cap value. It also sold some large cap value to buy some large cap blend and growth. The large cap purchases were in actively managed funds with more diversification than the S&P 500 (banking on the market broadening out beyond the top 5-10 stocks.)
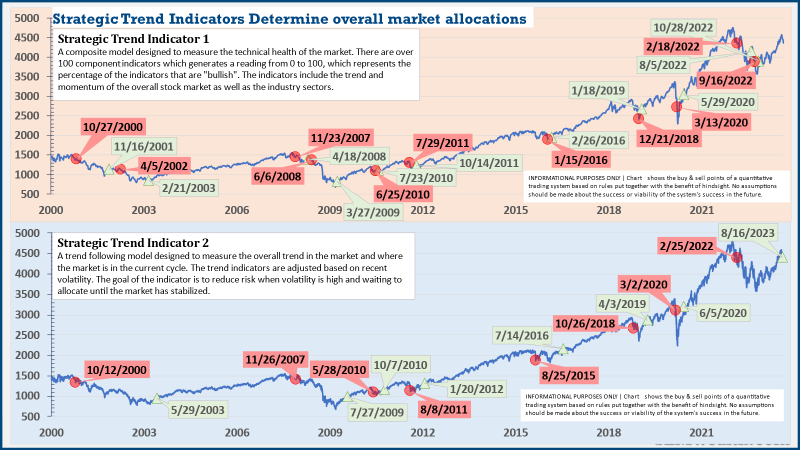
The * in quarterly is for the trend models. These models are watched daily but they trade infrequently based on readings of where each believe we are in the cycle. The second indicator triggered on August 16, brining the strategic models to a fully invested position. We are NOT locked into these for the next quarter. The 'sell-point' for this system is down around 3-4% from here.
This is the beauty of SEM's truly diversified approach. You get 3 distinct investment management styles inside one portfolio. We can customize models to match nearly any objective, risk level, and investment personality.
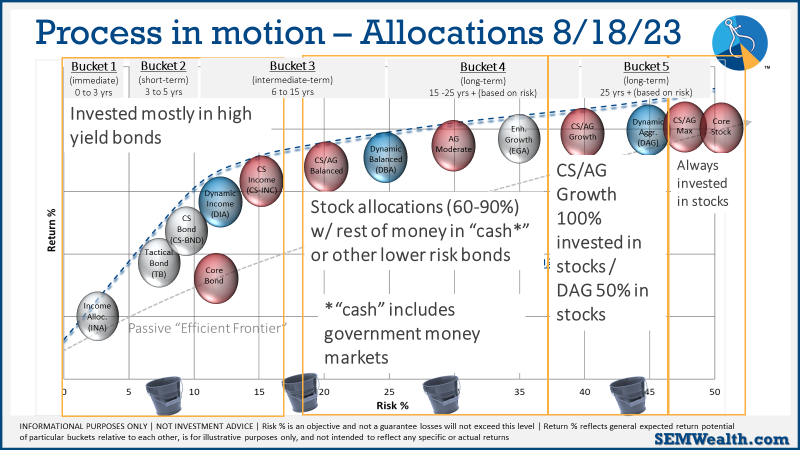
Our "bucket" approach allows for different parts of the portfolio to be positioned differently based on where we are in the market cycle. Whenever we are at a crossroads moment it is especially risky. This requires a disciplined approach which is what SEM brings. There will be much easier times to invest. Our goal is to get there with as much capital in tact to take advantage of that opportunity.


