With a holiday shortened week and a noisy market with no real news, the little bit of market commentary in this week's blog is found in the Market Charts section below. Based on the last three years, it seems that the only thing that can stop the stock market is when President Trump makes dire threats (devastating tariffs in 2025 and "ending" Iranian civilization in 2026). When he eventually backed off, it's back to the races.
This chart tells the story of the past 2 1/2 years.

The uptrend actually started before President Trump took office. It began when the Fed signaled they were done hiking interest rates at the October 2023 Fed meeting. Fast forward 82% later and a showdown seems to be emerging – will high inflation (again) cause the Fed to hike interest rates (wouldn't that be interesting given the President's non-stop assault on now former Fed Chair Jerome Powell) and would those rate hikes have the usual expected impact on high growth stocks -OR- will the seemingly non-stop AI buildout overcome the lowest consumer confidence on record, abysmal approval ratings on the President's handling of the economy, and a job market that has not grown over the past 12 months.
By the way, that 82% gain since October 2023.......that's a 26.1% annualized rate of return. Will the market continue at that pace or will we see it revert back to the long-term average of 10% annual returns? Our readers know my answer.
Market Charts

Following the losses from last Friday, the markets started the weak on a negative note as concerns the spike in oil prices has turned into broad based inflation that may be difficult to contain. Interest rates continued to move up early in the week until a different form of inflation helped stocks — continued impressive growth in Nvidia and other smaller chip makers.

While the S&P couldn't quite recovery the all-time highs, it again posted a positive week. The concerns over the Fed not cutting rates seems (for now) to be a distant memory of last fall.

The bond market and in particular, what happens to longer-term interest rates will continue to be the story as we move through the next phase of the AI buildout cycle. Amazon has already had to go to the debt markets to finance some of their spending and Meta is not far behind. Lesser players like Oracle have taken on massive loads of debt. The higher Treasury yields are the more attractive they become, which means higher risk borrowers will have to pay more to attract lenders.
I adjusted my usual yield chart to show how the yield curve looked 1-3 years ago compared to where we are today. You can see how much higher interest rates are on the longer end of the curve versus 3 years ago. The difference is the Fed cut short-term rates to push down the shorter part of the yield curve, but as we mentioned last week, that has sparked a return of inflation north of 3%.

A lot was made earlier in the week last week about the 30-year Treasury yield hitting the highest levels since 2007. While interesting, the 10-year Treasury is the benchmark for most longer-term borrowings. This 20-year chart shows we are back in the same brackets we saw just before the financial crisis began.

So which will win out – continued strong earnings growth via capital spending that seems to be increasing at an unstoppable level, or will higher rates serve to drag the stock market back to earth? As noted below, we are currently betting on the former with our tactical and strategic models, with our economic model still showing an economy that is only being supported by data center investments.
SEM Market Positioning
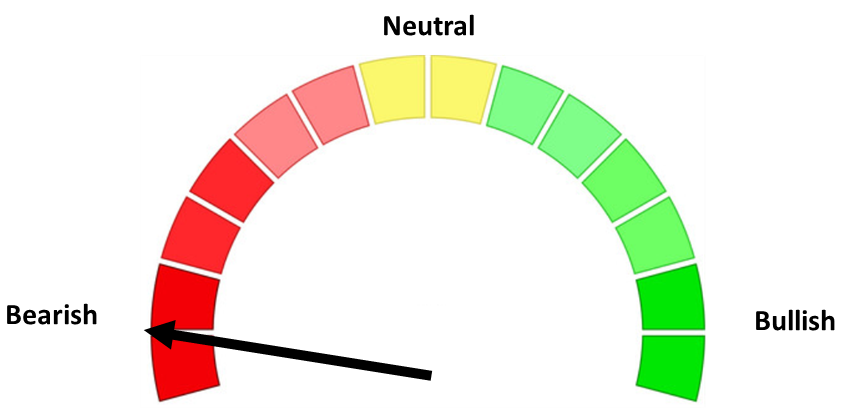
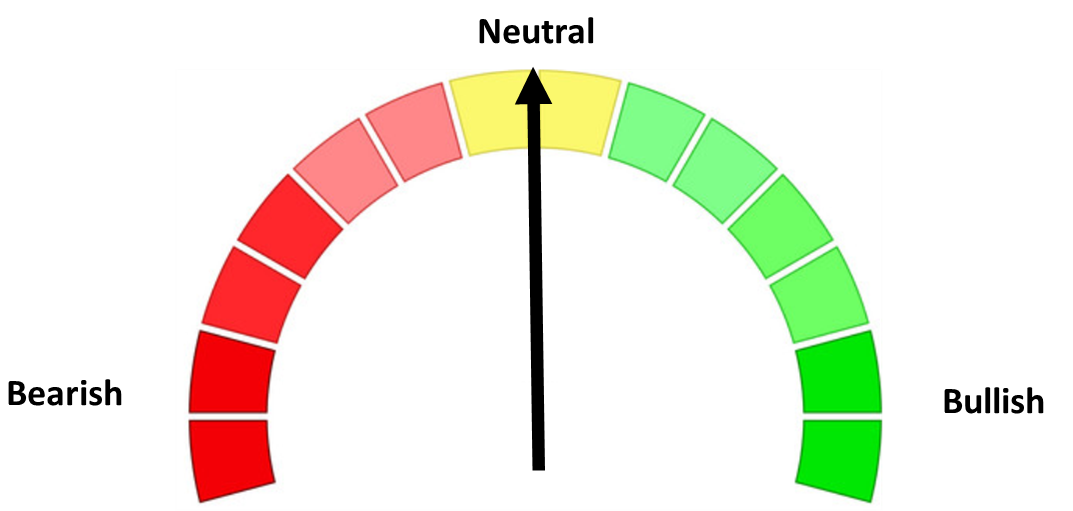
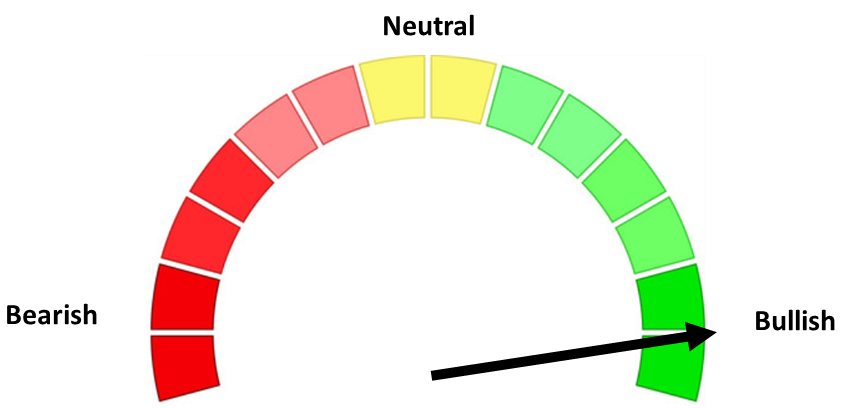
SEM deploys 3 distinct approaches – Tactical, Dynamic, and Strategic. These systems have been described as 'daily, monthly, quarterly' given how often they may make adjustments. Here is where they each stand.
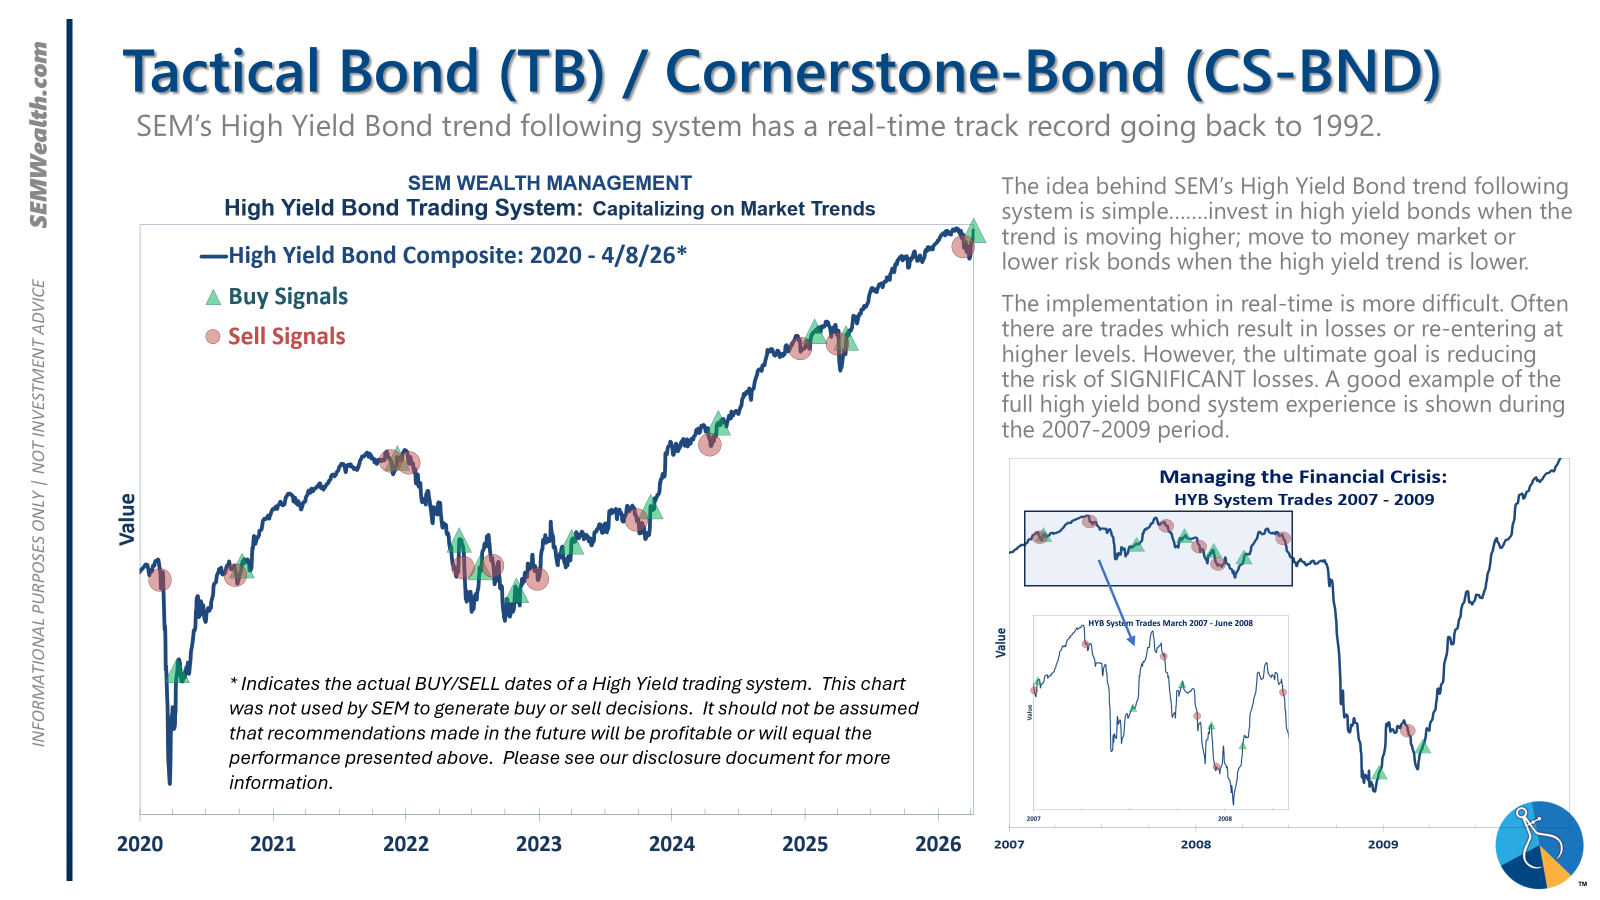
- Tactical = BULLISH | 100% High Yield Bond (4/8/2026) | High-yield spreads remain narrow but trend is slightly higher
- Dynamic = NEUTRAL (2/15/2026) | "Benchmark" Allocation | Economic model inconclusive
- Strategic = BULLISH (4/15/2026) | V-Bottom projecting "end" of Iran War
Tactical (daily):
- Monitored DAILY
- Models: Tactical Bond, Cornerstone Bond, Income Allocator, Tax Advantaged Bond
- Designed to follow the trends for use in our lower risk models
- BUY Signal issued April 8, 2026 (exiting the sell from March 13)
Dynamic (monthly):
- Monitored MONTHLY
- Models: All "Dynamic" Models (Income, Balanced, Growth, and Asset Allocator)
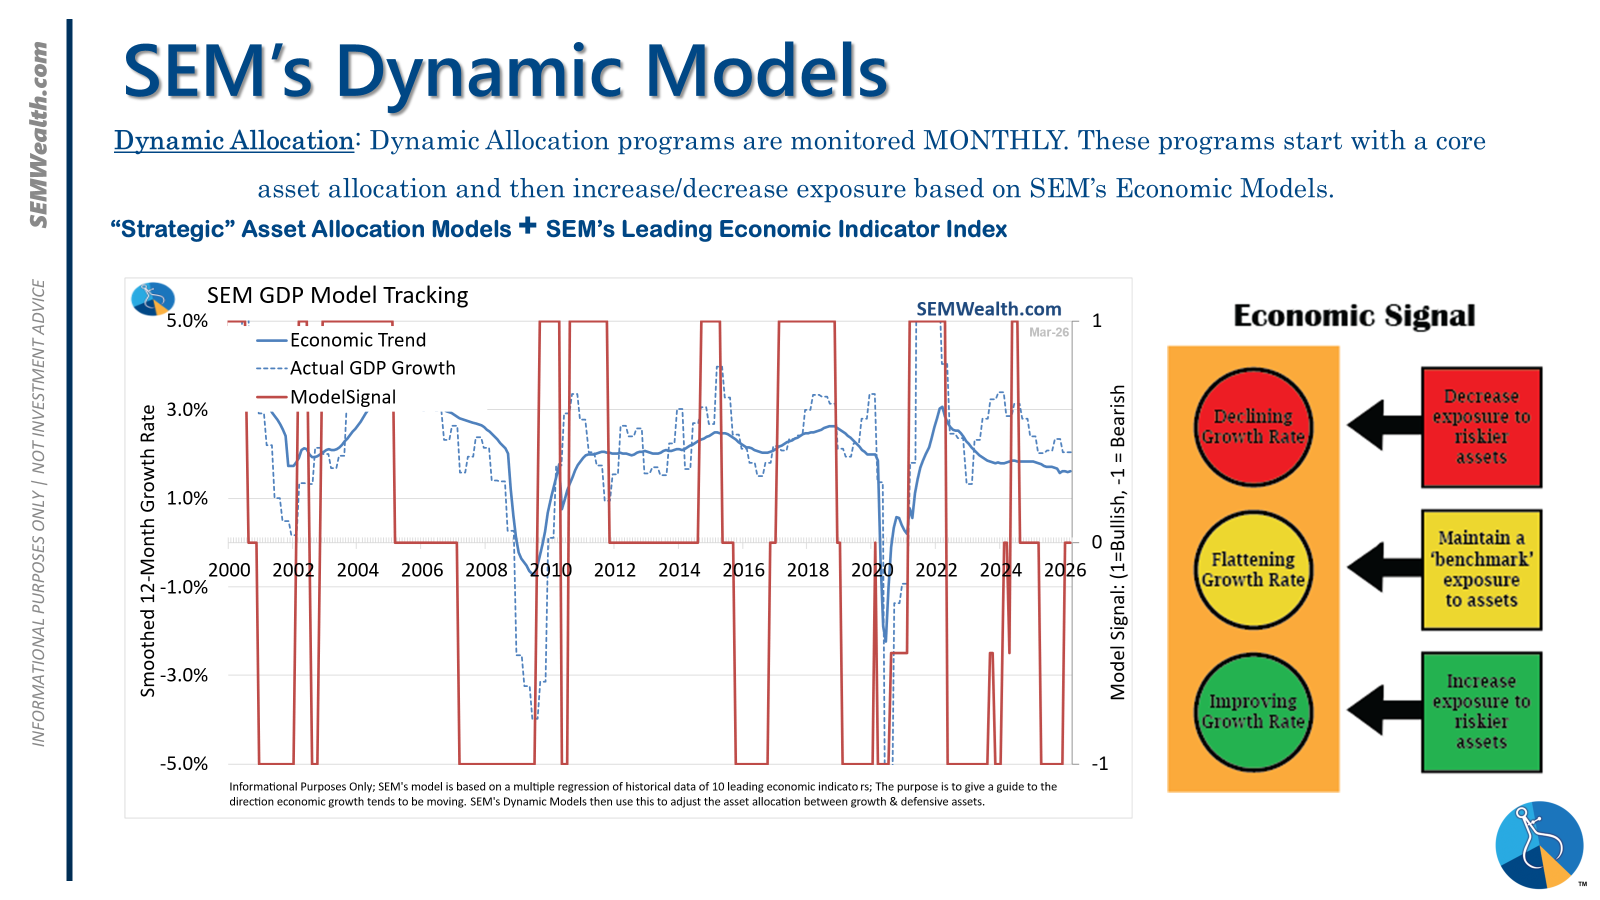
- Uses SEM's Quantitative Economic Model
- Designed to overweight riskier assets if economic trend is higher & underweight those assets if economic trend is lower.
- NEUTRAL signal issued February 15, 2026 (following BEARISH signal from July 2025)
Strategic (quarterly)*:
- Monitored QUARTERLY
- Models: AmeriGuard (Balanced, Moderate, & Growth) and Cornerstone (Balanced & Growth)
- Core Component: Quantitative Filter using 4 different time horizons across universe of asset classes
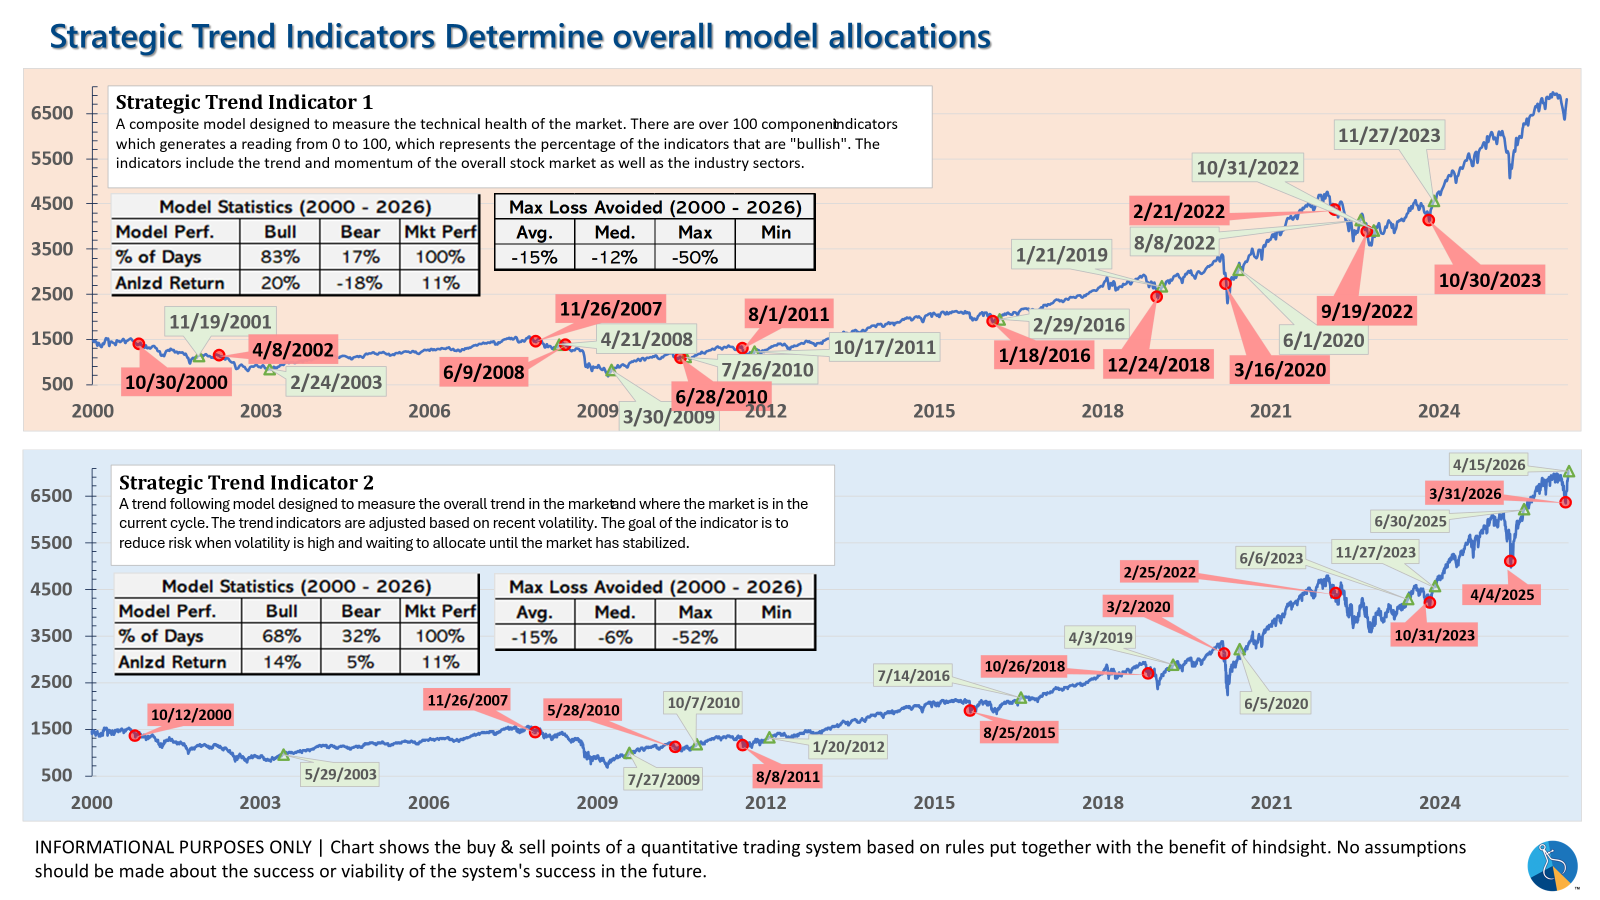
- Trend Indicator: Two different Quantitative Systems monitoring the intermediate-term trend, health of the market, and volatility
- CORE has been overweight small cap and international since October 2025 – overweight increased slightly in January
- Both TREND INDICATORS are BULLISH following 10% drop and "V-Bottom" reversal in early April
- AmeriGuard & Cornerstone Max DO NOT use the Trend indicator and are always 100% invested in stocks using our CORE rotation model.
The core rotation is adjusted quarterly. This quarter we saw half of our international positions reduced (we sold developed markets and kept our emerging markets exposure). We also saw the remaining share of mid-cap reduced in favor of more small cap exposure. We remain with a "barbell" core portfolio – about half in large cap and half in small cap as the models expect the market to "broaden".
The * in quarterly is for the trend models. These models are watched daily but they trade infrequently based on readings of where each believe we are in the cycle. The trend systems can be susceptible to "whipsaws" as we saw with the recent sell and buy signals at the end of October and November. The goal of the systems is to miss major downturns in the market. Risks are high when the market has been stampeding higher as it has for most of 2023. This means sometimes selling too soon. As we saw with the recent trade, the systems can quickly reverse if they are wrong.
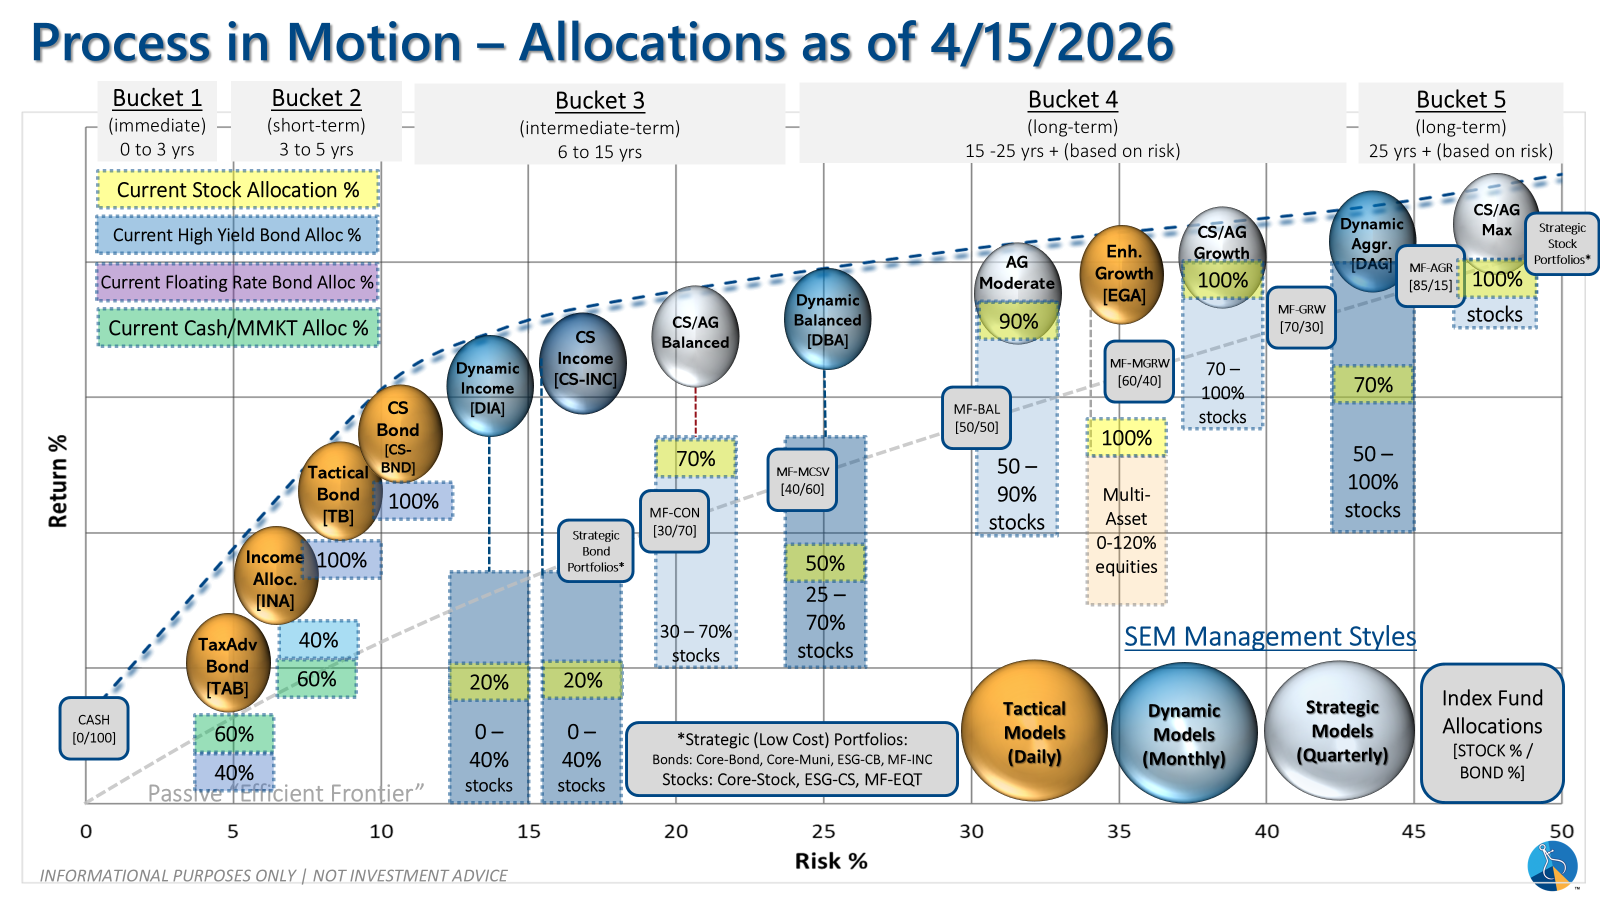
Overall, this is how our various models stack up based on the last allocation change:
Curious if your current investment allocation aligns with your overall objectives and risk tolerance?