Once again, I was on the road speaking at conferences, which seems to be when the most exciting things happen with the market! I had another keynote at an FPA annual symposium, again presenting our "AI: Boom, Bubble, or Both" presentation. To say it was timely would be an understatement.
Add to that the AI earnings reports, a Fed rate decision, a GDP release, and a big sell-off in technology stocks and we are going to again use the original, "musings" format (quick hits that tell the story with pictures).
For those of you who'd rather watch than read, we also recorded a short video update.
Before we get there, I wanted to highlight what was also a very busy week for the blog:
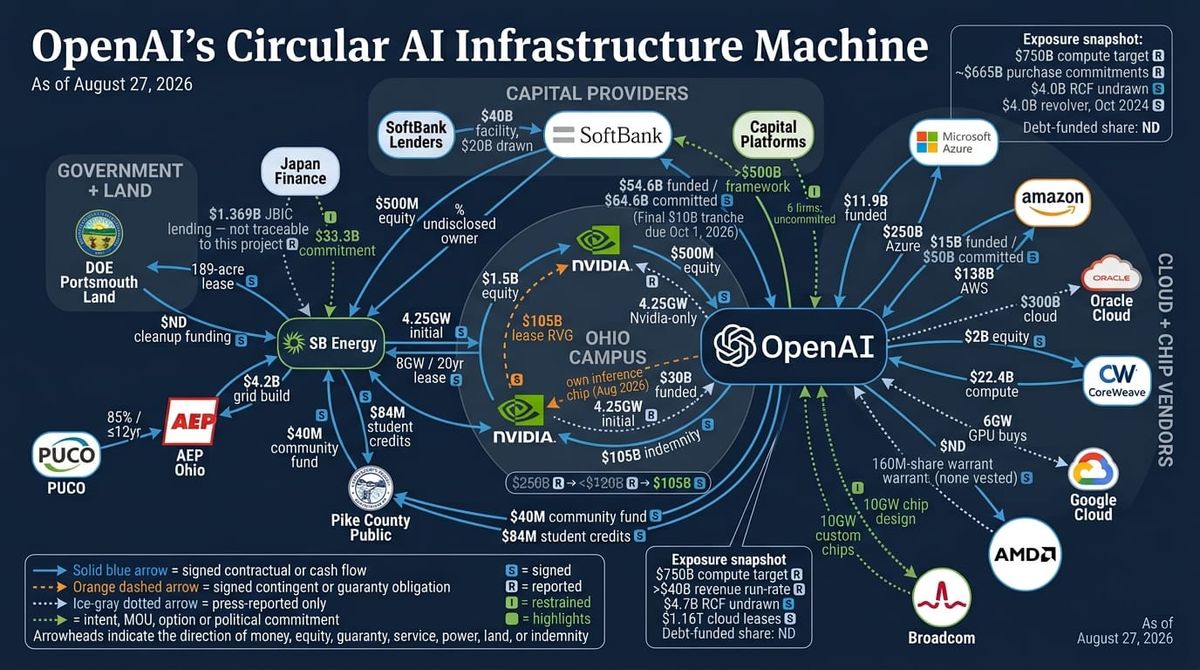
Anthropic's IPO filing led to an update of our "Everchanging" report as well as our AI Stress Test Tool:
 Jeff Hybiak, CFA
Speaking of AI, I posted a first hand account of the benefits and downside my AI "interns" have brought:
 Jeff Hybiak, CFA
Cody gave us a final look at what the mid-term polls are telling us:
 Cody Hybiak

In addition to all of this, Courtney posted a well-timed article talking about ways to avoid the "noise" in our world.
 Courtney Dent

Alright, here's what's on my mind as we kick off the week:
1.) This week's report cards
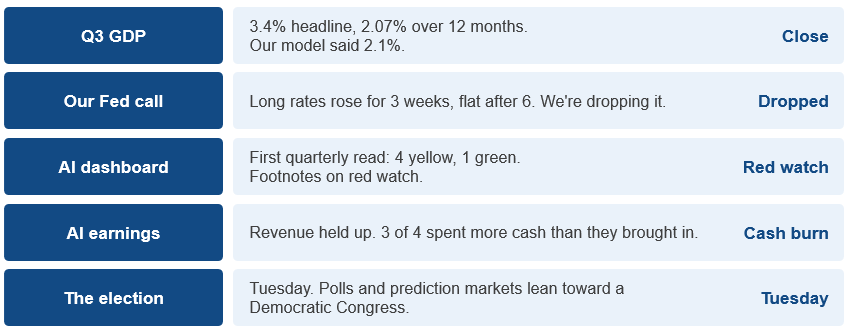
We had a bunch of reports to dissect, here's the summary (we'll talk about each below):
2.) Hyperscaler stocks fell on cash, not growth
The reports all showed "hyperscaler" revenue mostly beat or matched expectations. The star, and what everyone was focused on, cloud growth was strong (Azure +48%, AWS +39%, Google Cloud +103%). The stocks fell anyway, and the reason was CASH. Three of the four spent more on capital expenditures than they brought in from operations this quarter. Only Microsoft covered its spending, and the four together were about -$26 billion in free cash flow.
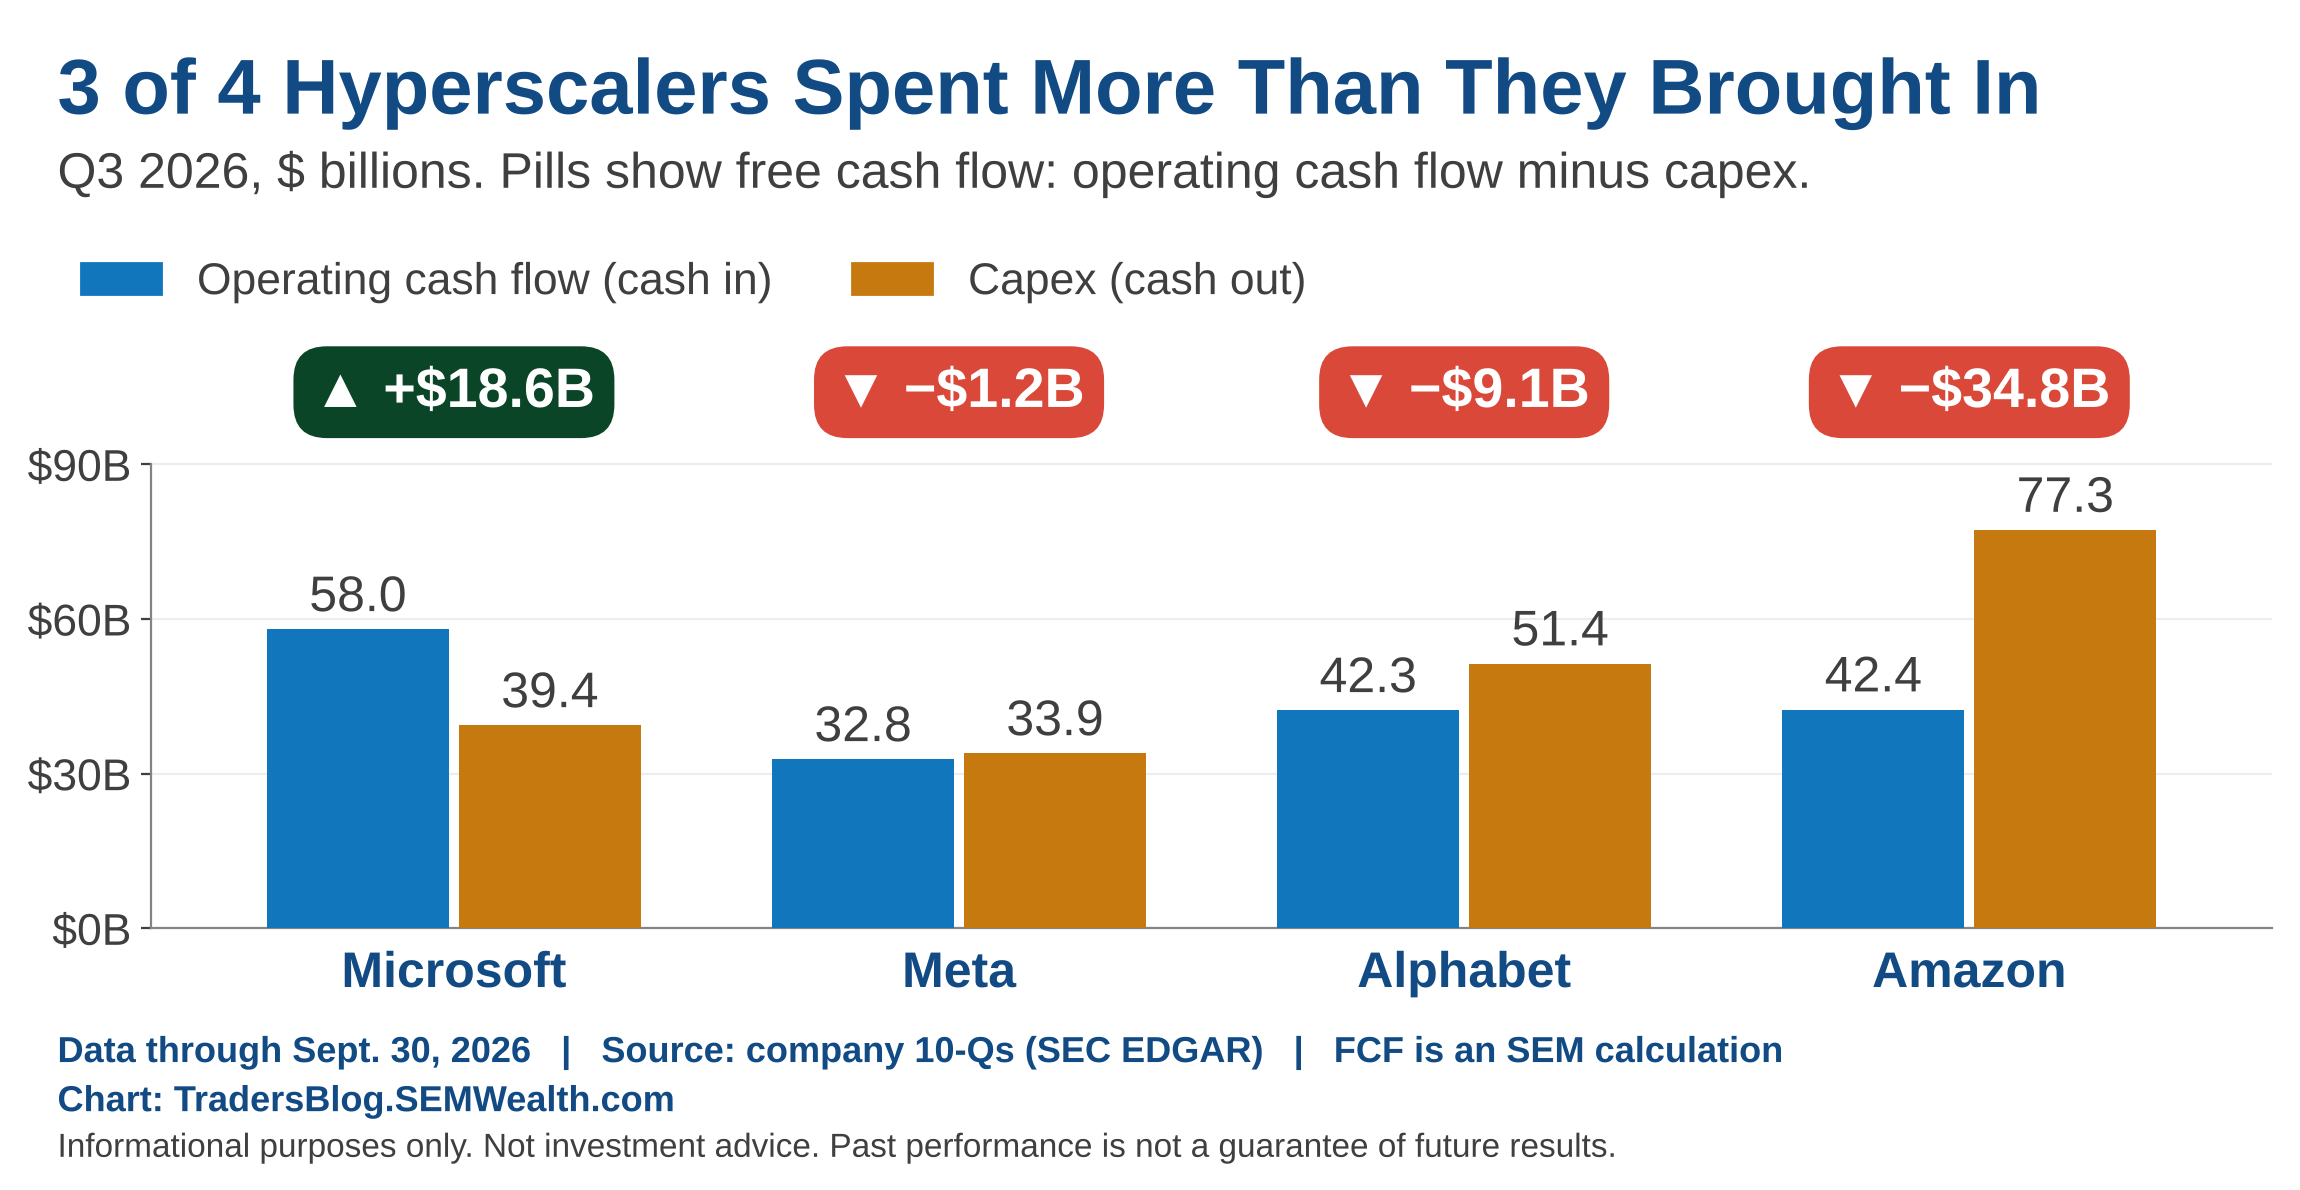
Last week I said lining up outside money historically happens late in a cycle. This quarter ALL four went to outside money: Meta sold convertible preferred stock ($12.5 billion) and set up a ~$25 billion forward stock sale, Alphabet sold $12.4 billion of stock, Microsoft priced $25 billion of bonds and Amazon took a $17.5 billion term loan.
(Side note: Microsoft's capex came in lower because more of its new capacity came through operating leases, which don't count as capex, not because of weaker demand. Its commercial backlog is up 73%. And Alphabet's $12.4 billion loss on its SpaceX stake is the SpaceX piece of our AI Network Stress Test showing up in a real income statement. Alphabet booked a gain of $3.0B on an unnamed private company (almost certainly Anthropic). The SpaceX "loss" wasn't the whole story at Google.....Search revenue also came in short on lower ad revenue, and earnings missed even with the loss added back.)
(Side note 2: While not a hyperscaler, Intel fell 29% on Friday, its worst day in decades, and it’s a similar story – earnings actually beat estimates, but their outlook didn’t. Intel's data center and AI business grew 78% from a year ago, but their CEO warned of an “unprecedented memory crunch” that is hitting PC sales. The company expects that business to drop more than 20% next quarter. The AI connection is what caught my eye. Memory makers are shifting production to the high-end memory AI servers need (Micron says making 100 bits of AI memory means giving up 300 bits of regular memory), so PC makers are paying more for less. In other words, the AI buildout is starting to squeeze the rest of tech. Intel was also one of the top 5 tech stocks at the end of 1999. I had highlighted this in our AI keynote including the fact it didn't recover its 2000 peak until earlier this year. Well, based on Friday's close it is back BELOW the 2000 peak. This highlights one reason we don't pick individual stocks as well as the danger of investing in the "best" or "biggest" companies rather than a diversified portfolio. As of Friday's close, Intel is down about 53% from its all-time high just 4 months ago.)
3.) The AI dashboard's first quarterly read
The colors in our dashboard remain the same as at launch (four yellow, one green, no red), but three of the needles moved toward red. The dashed needles show where each one sat in June.
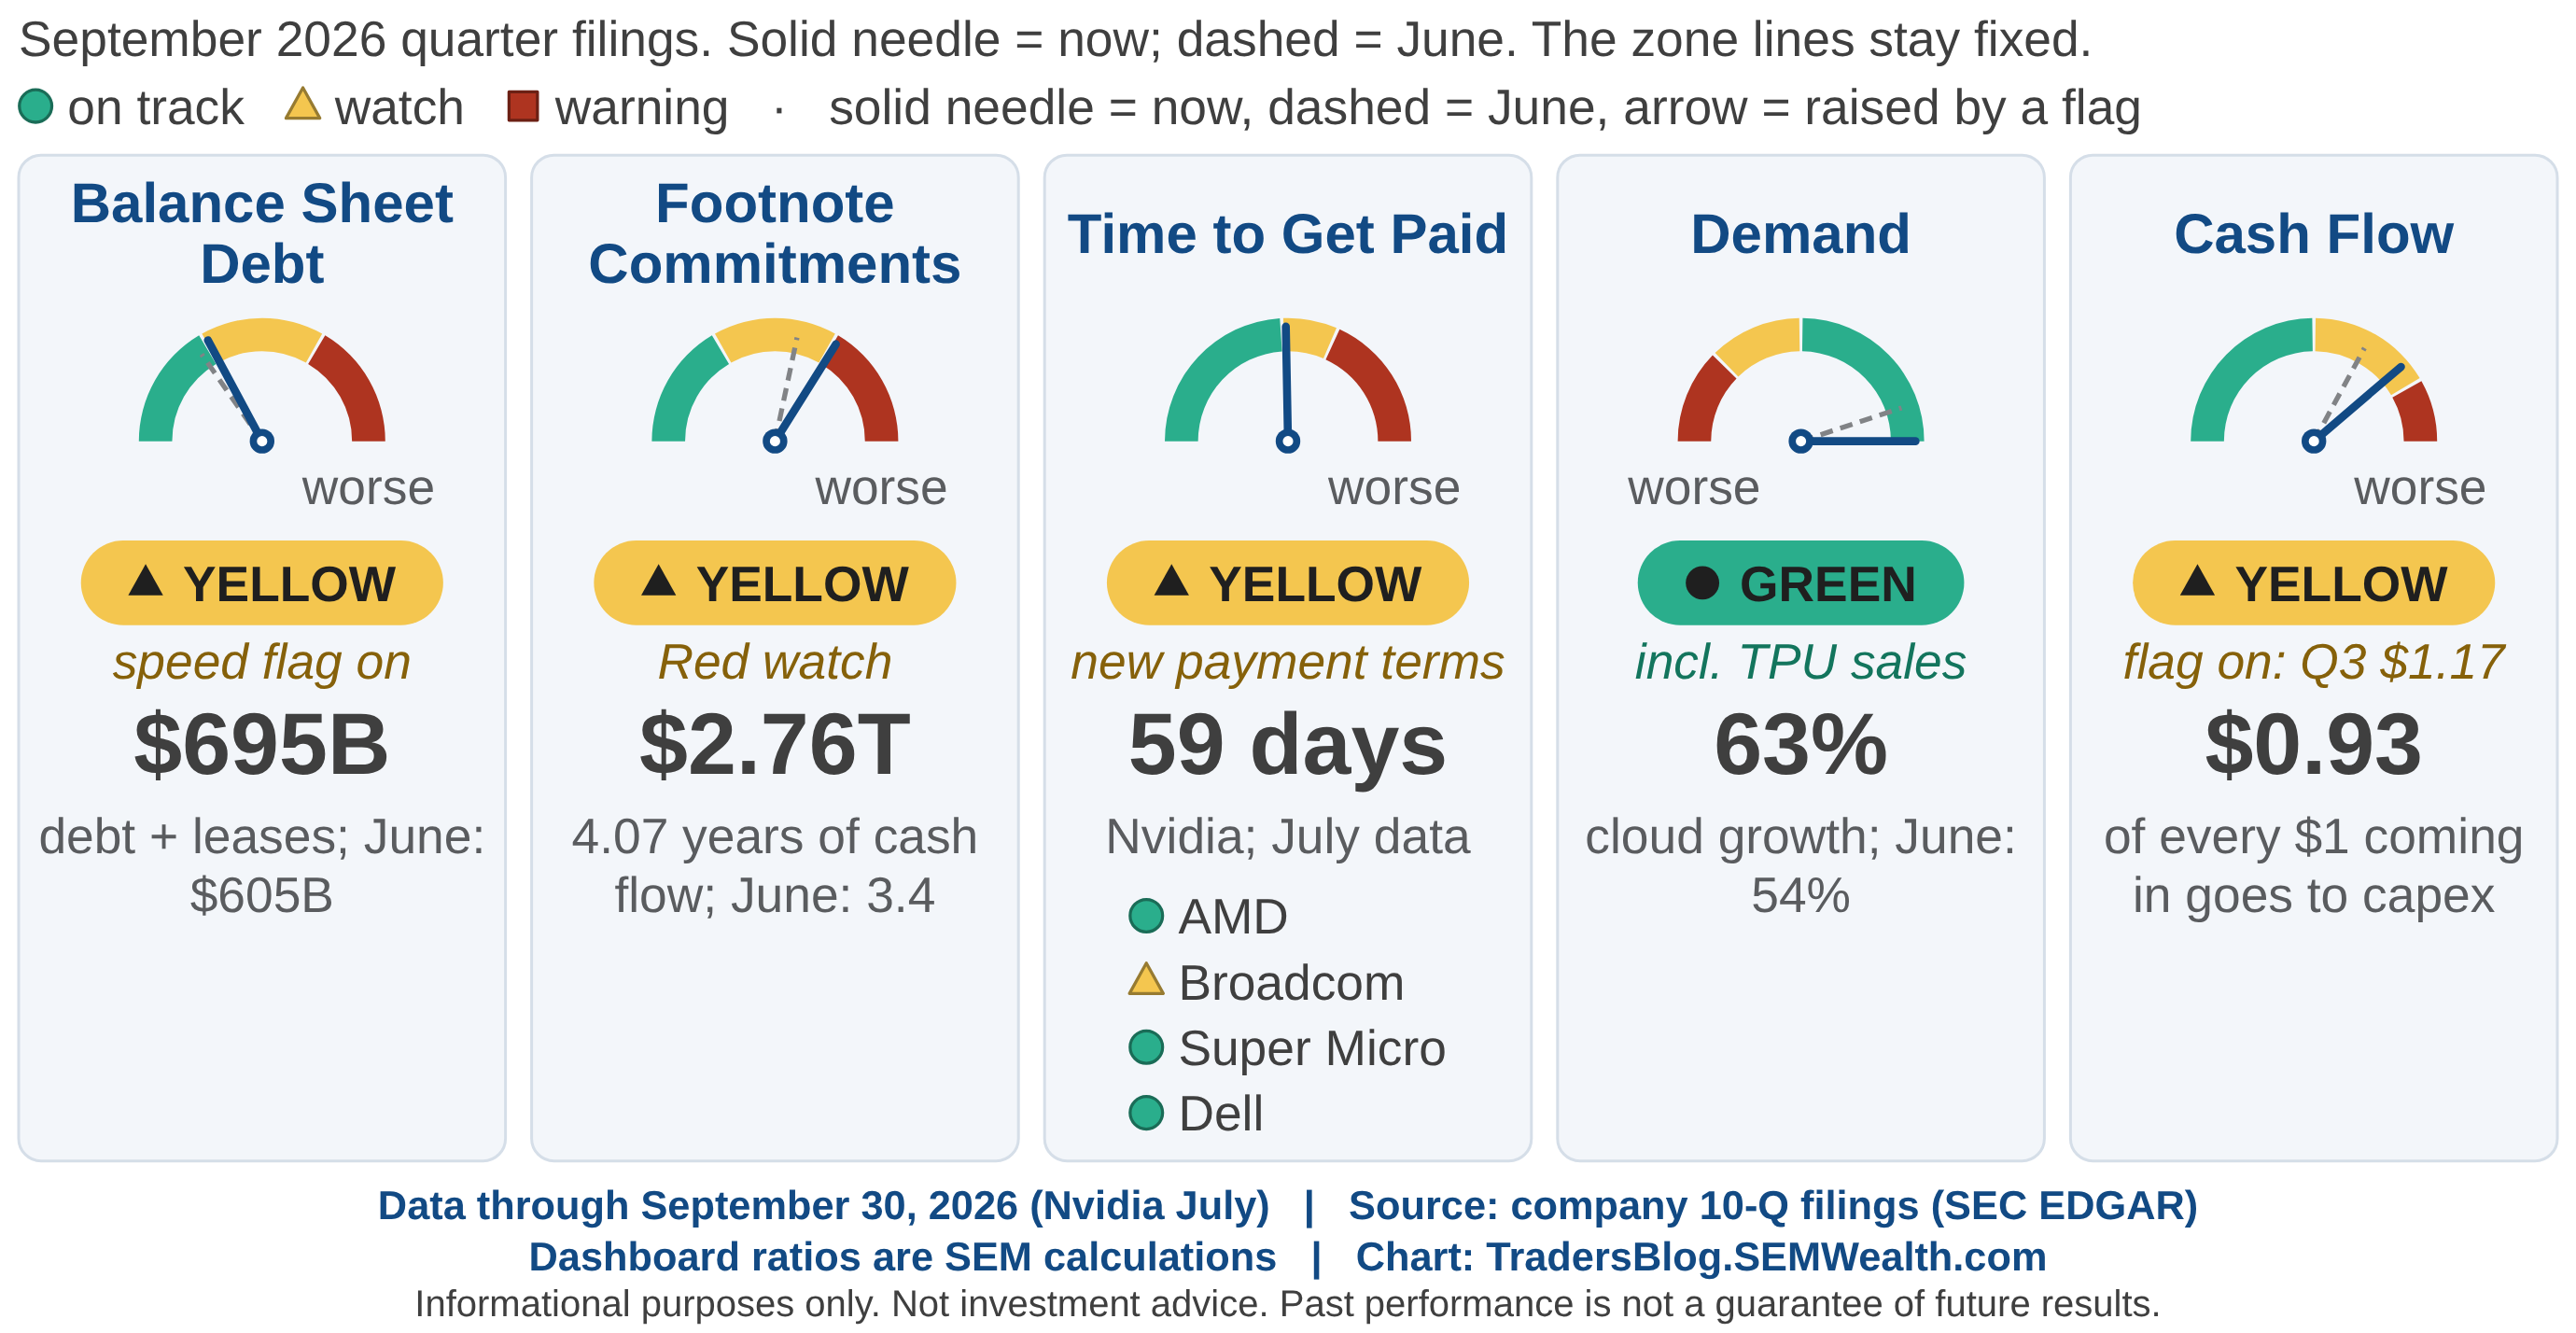
- Debt: about 1.03x, yellow, but up 90% in 1 year!
- Footnote commitments: $2.76 trillion, 4.07 years of cash flow (3.4 in June). First quarter above our red line, so it's on "red watch" (still yellow).
- Time to get paid: yellow, waiting on Nvidia in mid-November.
- Demand: cloud growth averaged 63%, green.
- Cash flow: 93 cents of every operating dollar went to capex over 12 months (79 in June). Q3 alone was $1.17, so the warning flag is on.
There's one "rule" change you should know about. Red on the footnote gauge now takes TWO quarters in a row above 4 years, so a single accounting change can't flip the light. If Q4 is also above 4, it turns red in February. We also counted a new line Amazon started reporting this quarter, which is the conservative choice (without it, 3.8 years). [Note: our "4 year" line in the sand was based on what S&P considers a warning when they evaluate companies.]
We are doing our best to track an everchanging ecosystem, the size and pace of which we've never seen. Adding to that are accounting rules that allow for judgment and different interpretations. Microsoft and now Amazon have changed how they structure and report things. I'm not saying they are doing anything wrong, but it is something we need to watch. We'll report it as we see it.
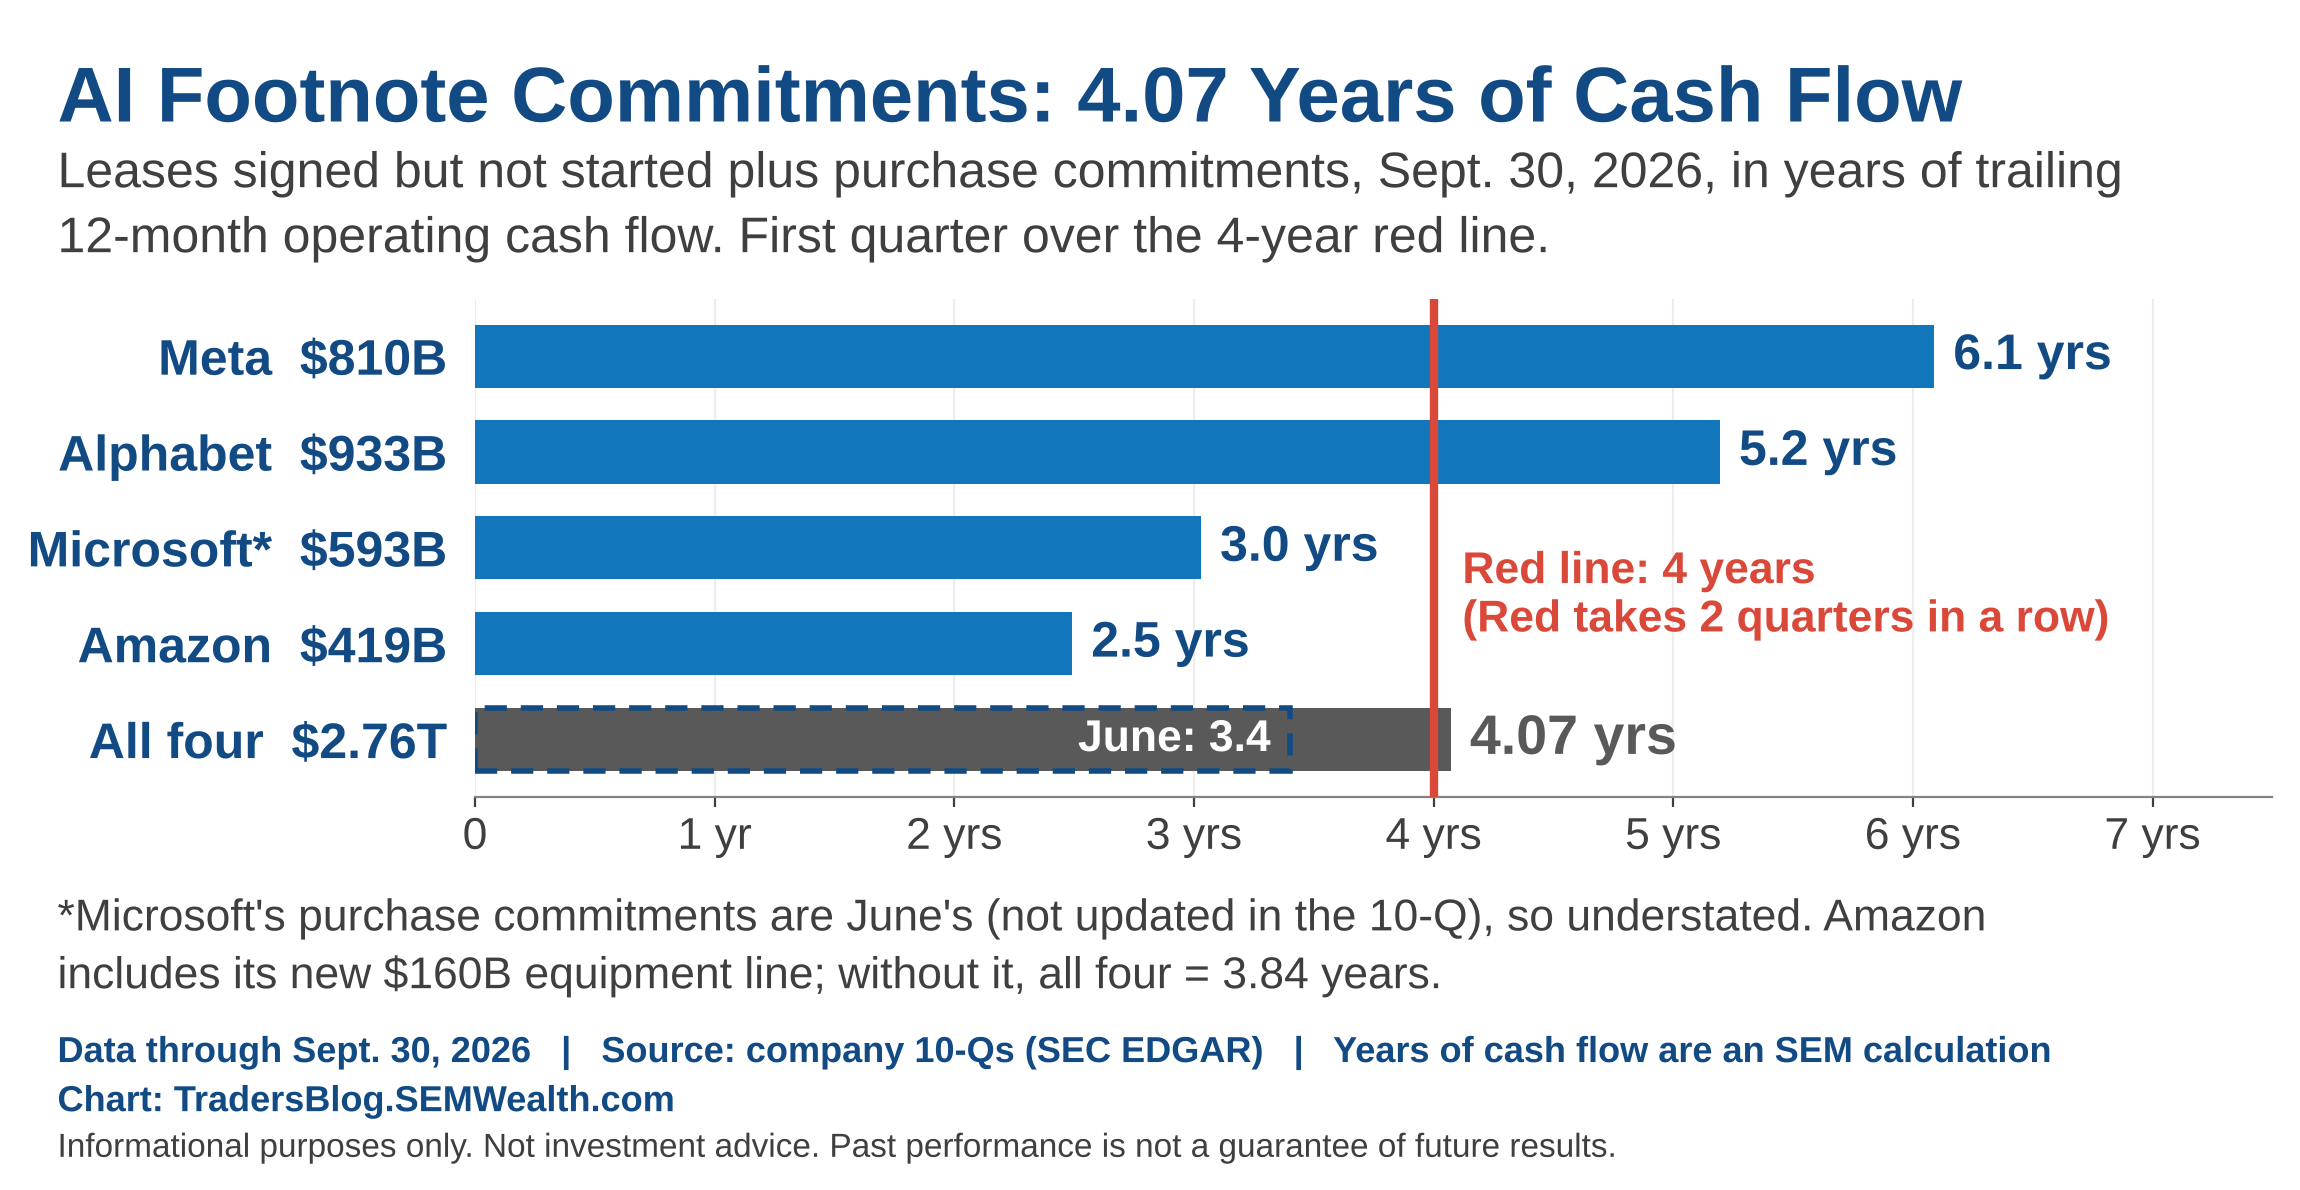
Meta (6.1 years) and Alphabet (5.2) push the total past the line by themselves. Microsoft's number is, if anything, too low because its quarterly report doesn't update its purchase commitments.
4.) 3.4% sounds big. It isn't.
Everyone knows my pet peeve when it comes to the GDP report – the headline GDP number takes ONE quarter and compounds it 4 times. The 3.4% replaced last year's 3.9%, so growth over the past 12 months actually DECLINED, from 2.19% to 2.07%.
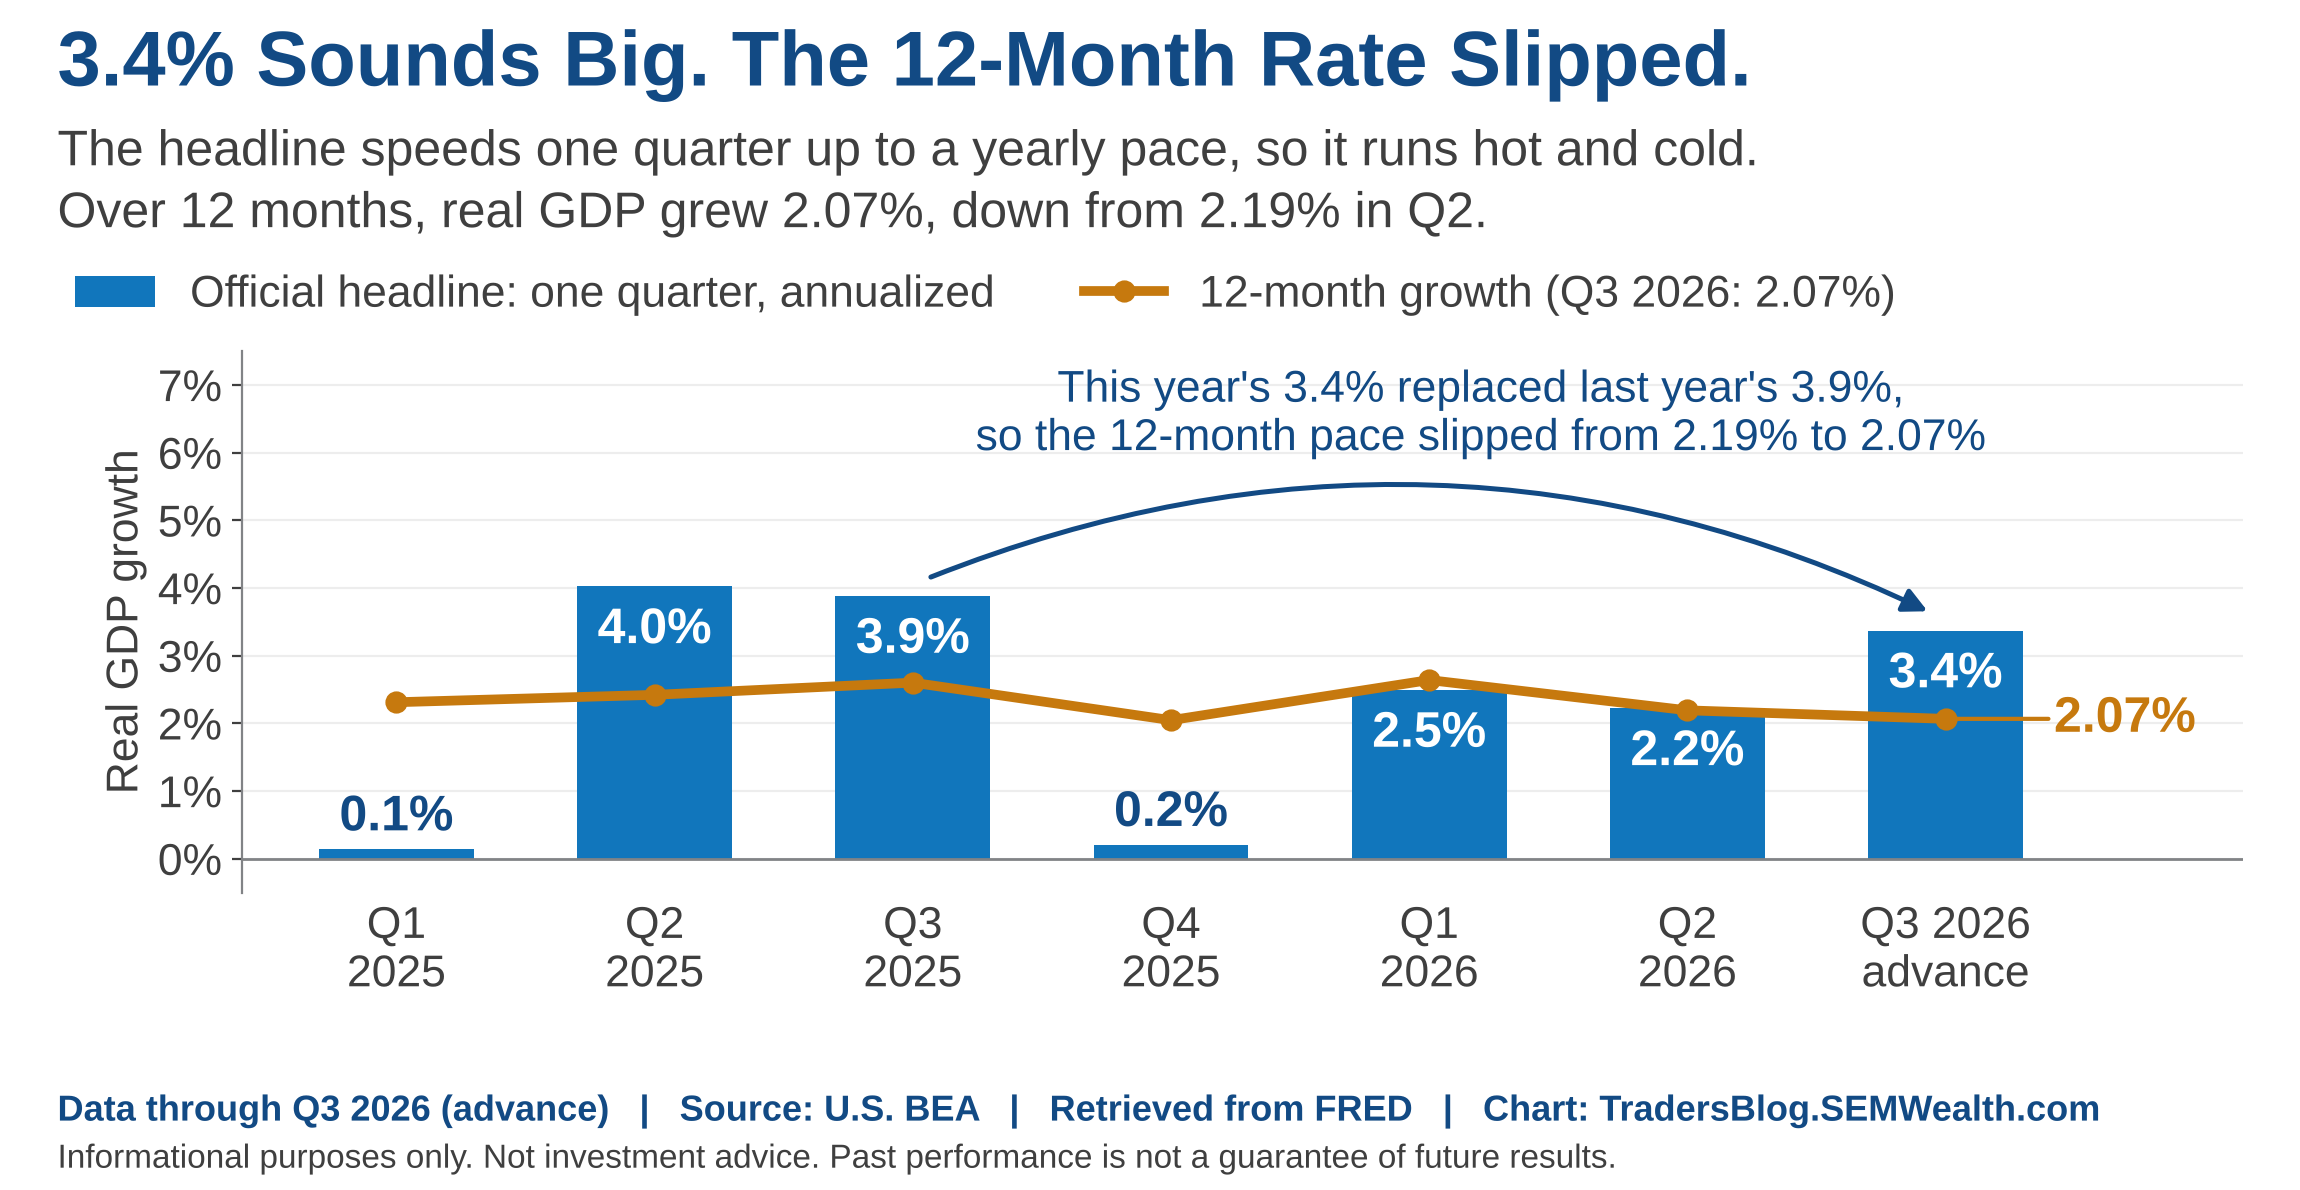
Inventories added 1.6 points (they tend to borrow from the next quarter) and "final sales" grew only 1.7% annualized. To be fair, the strong part was real – private domestic demand grew at a 4.9% annualized pace.
This is where everyone using this data needs to be careful. If you are celebrating the "strong" 3.4% growth rate this quarter, you have to be ready to acknowledge a "weak" (and possibly negative) 4th quarter. (Again this is why I HATE the way the government reports it and how I seem to be the only person in finance that points out the issue with using this method.)
Here's what is about to happen.....Last year's 4th quarter was weak (+0.2% "official" or annualized), so if the economy keeps growing around a 2% ANNUAL (not annualized) rate like our model is saying, the Q4 headline could print close to ZERO when it comes out in late January. Our model is currently at a 2.1% rate, which would be around a 0.3% "official" number. If the model slips to 2.0%, the "official" number would be slightly negative (-0.05%). Q4 2025 included the long government shutdown. We won't have that impact this time (hopefully – the government is only funded through December 11)!
5.) Scoring our economic model
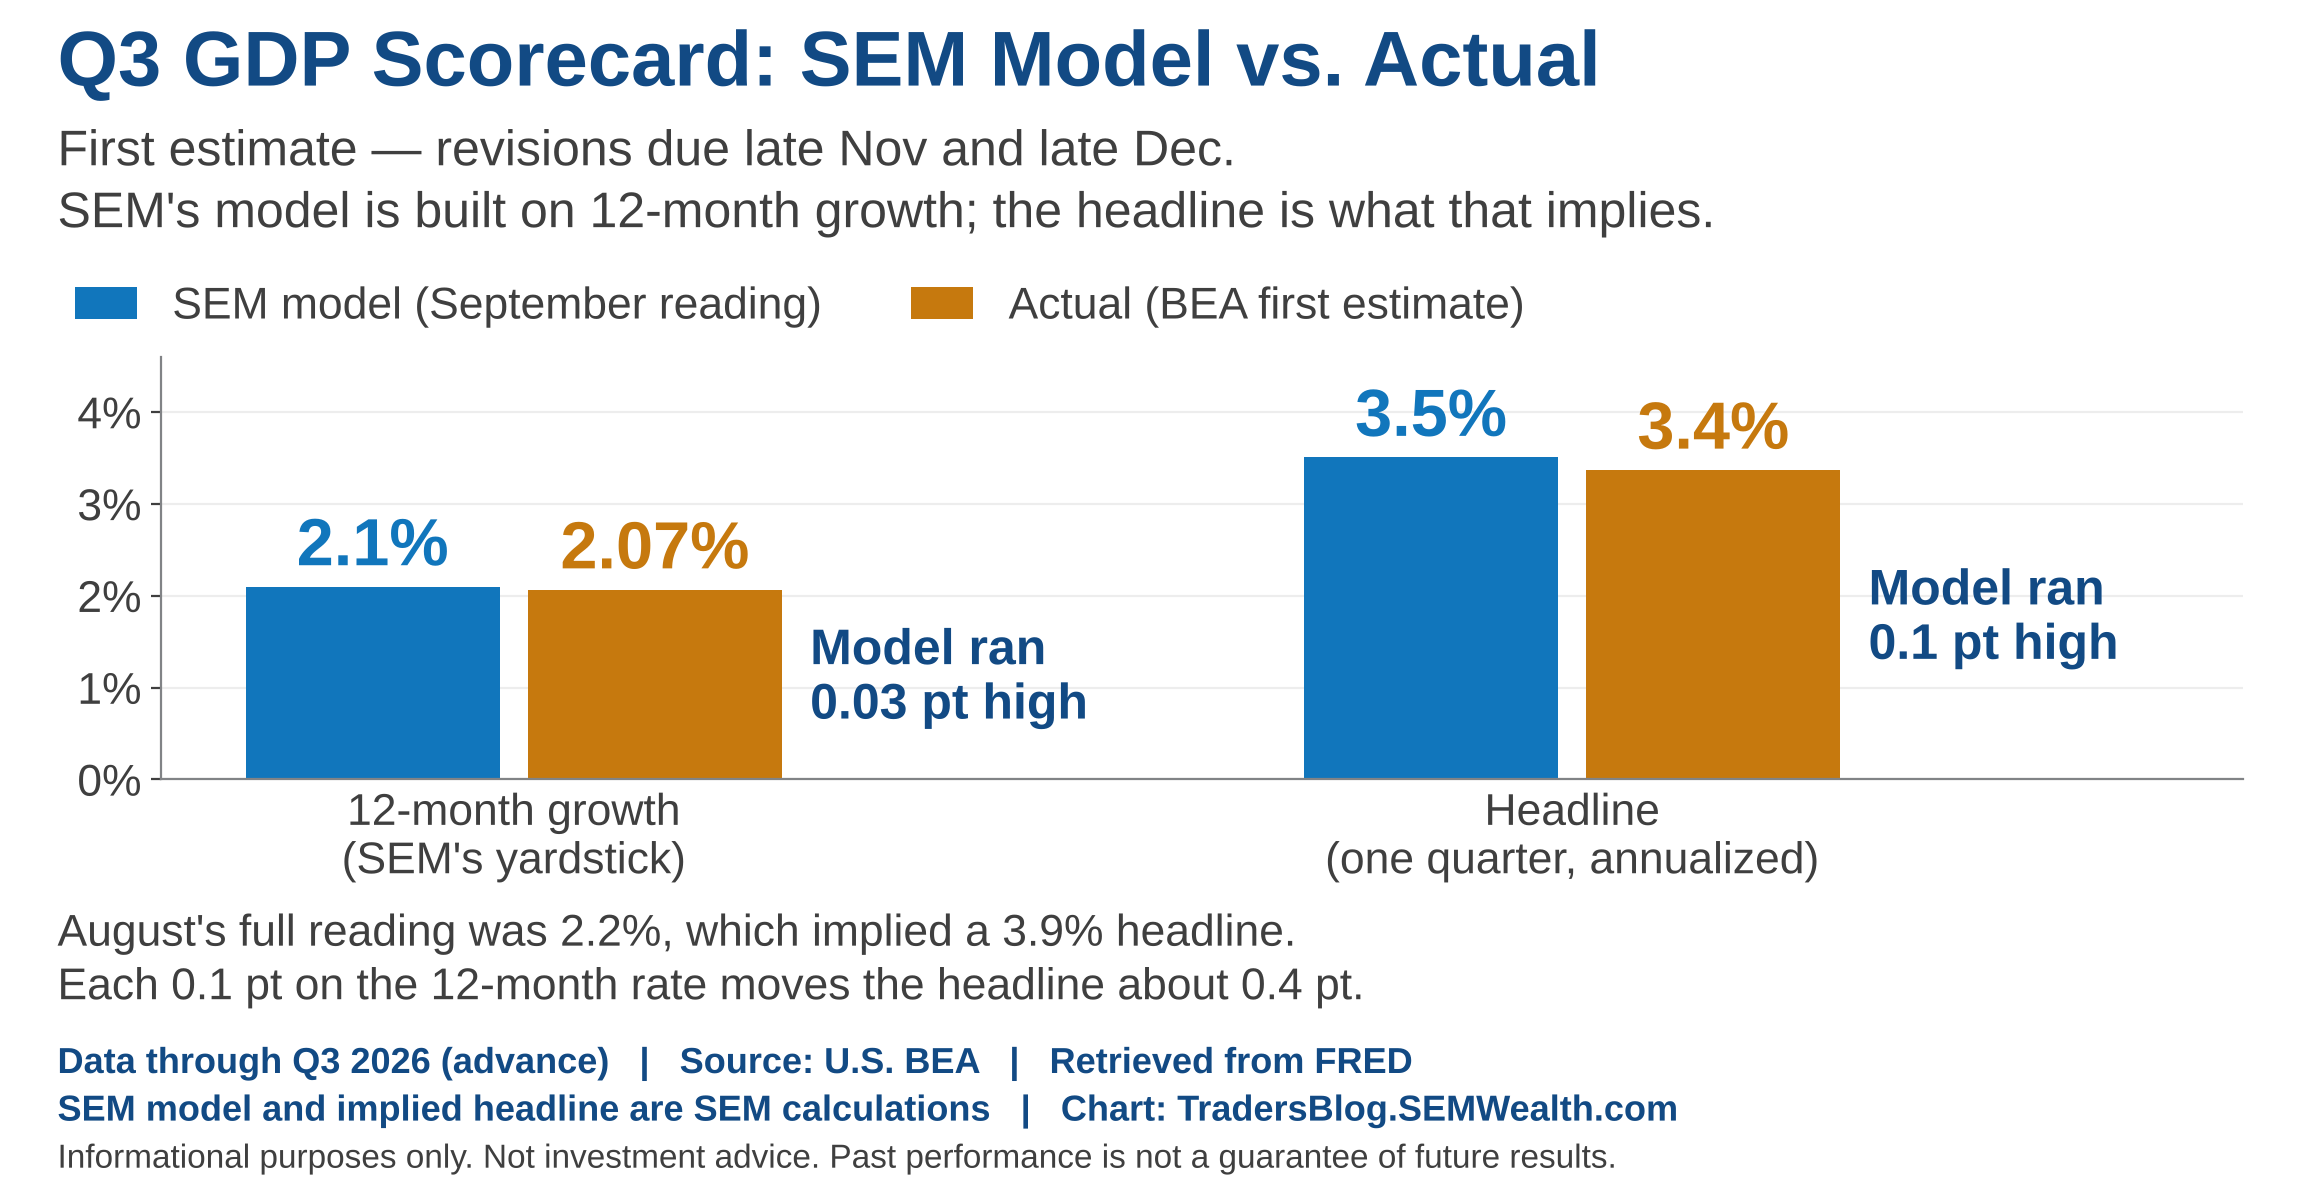
Our model said 2.1% over 12 months, which implied a 3.5% headline GDP number. The actual numbers were 2.07% and 3.4%. That's pretty dang close on the FIRST estimate. Revisions come in late November and late December and can move the headline several tenths either way, so we'll re-score it after the third estimate. Like the economy, our model slipped a bit in September (August's full reading was 2.2%).
6.) A lot of the AI money is spent overseas
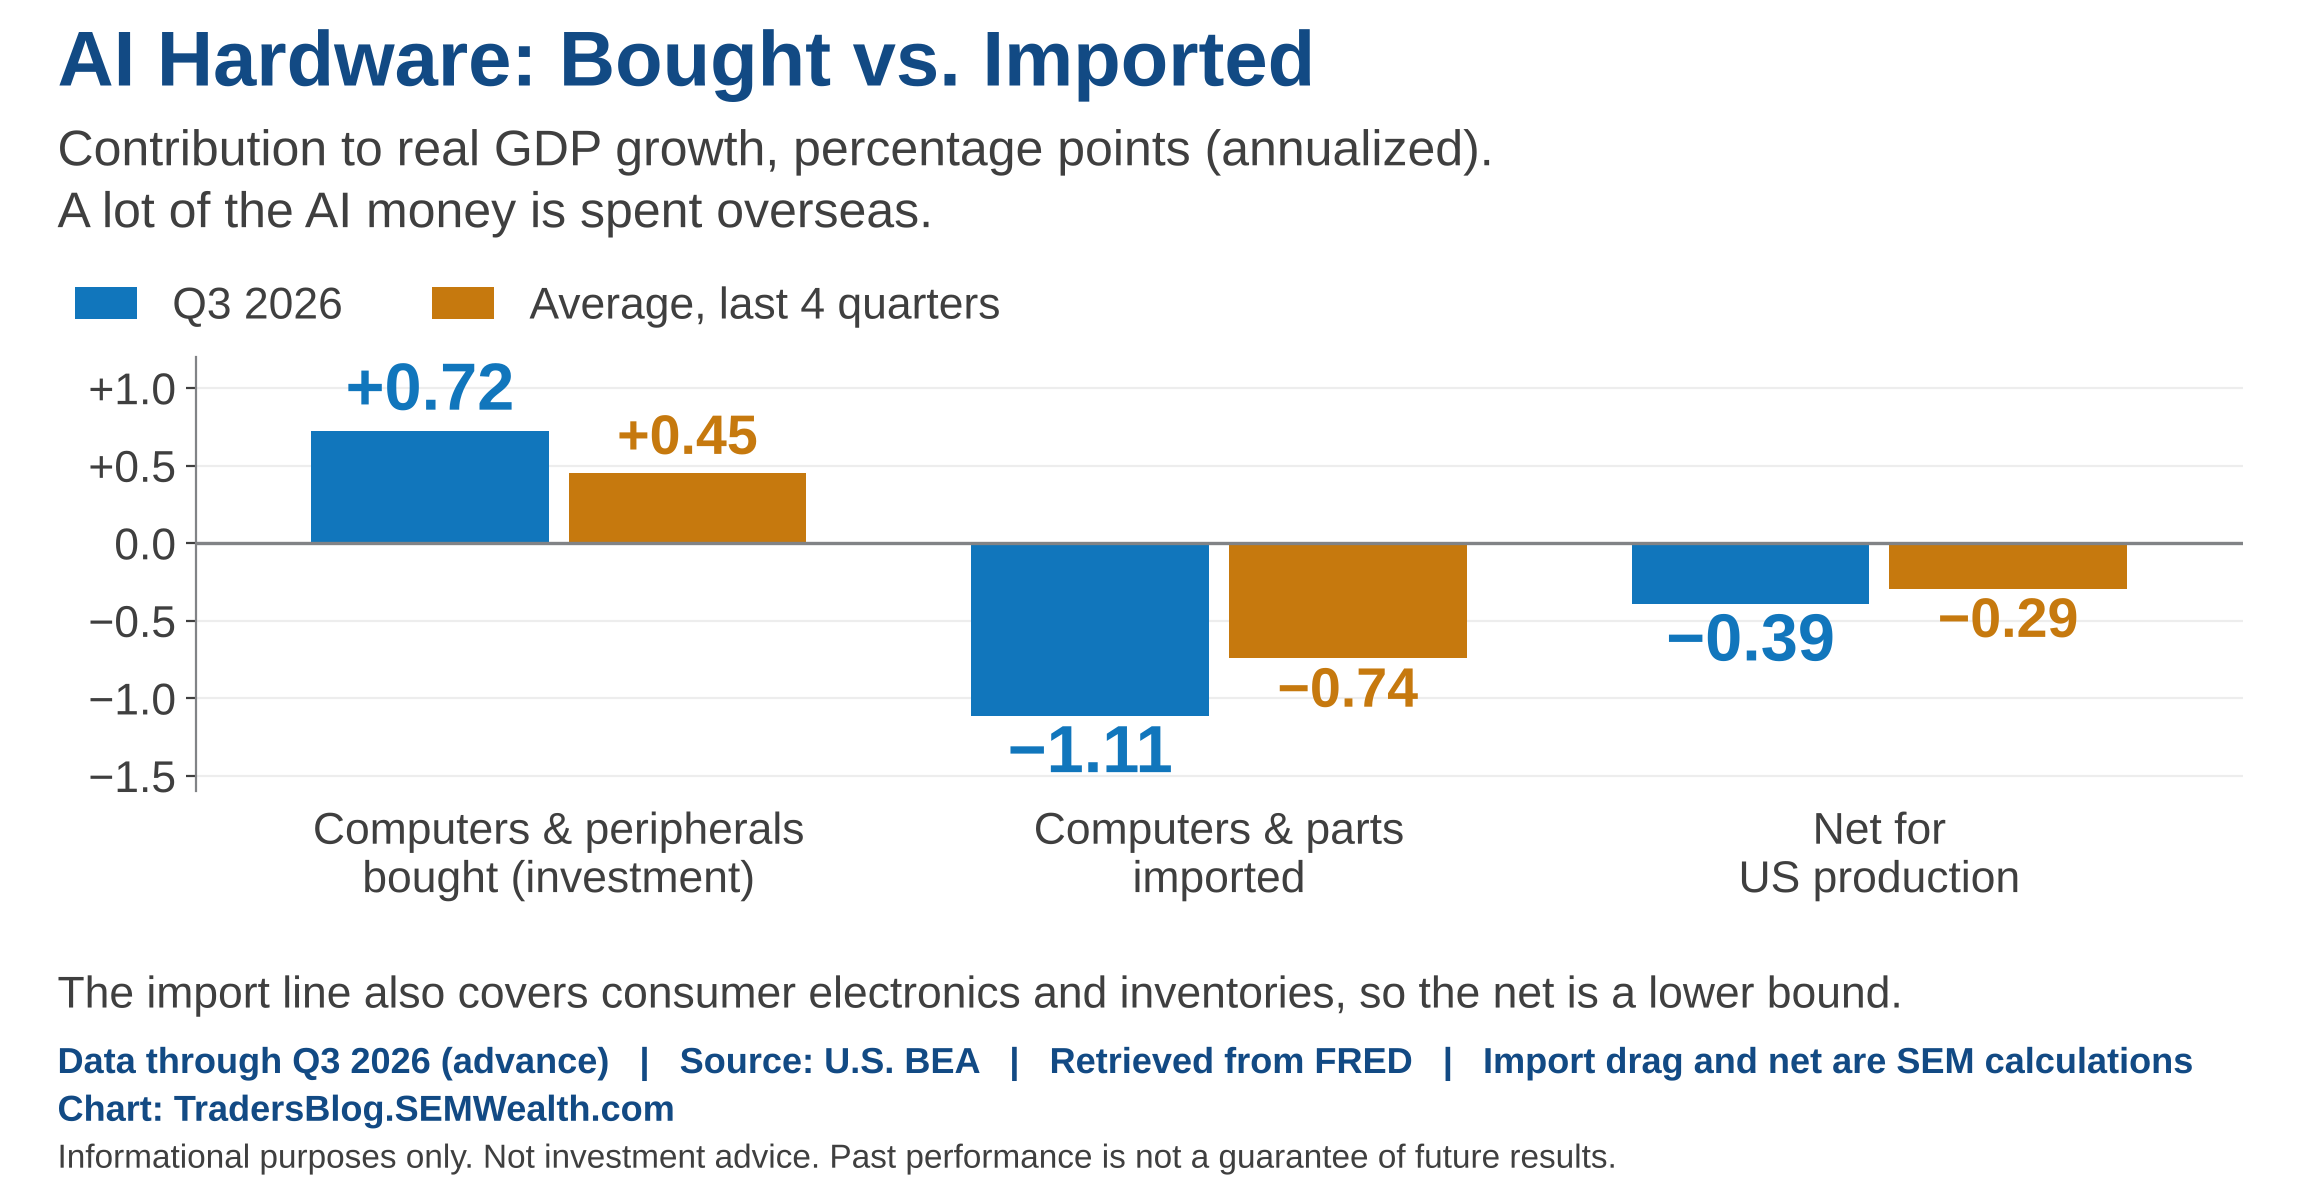
AI had been a big driver of growth in our economy. That wasn't the case last quarter, at least on the hardware side. The computer components we bought added 0.7 points to GDP growth last quarter, but computer imports took out 1.1. This means that net, net, AI hardware took away about 0.4 points for US production. GDP measures what's produced here, and a lot of the AI hardware is built somewhere else.
7.) Close to the "strong" line, but breadth is thinning
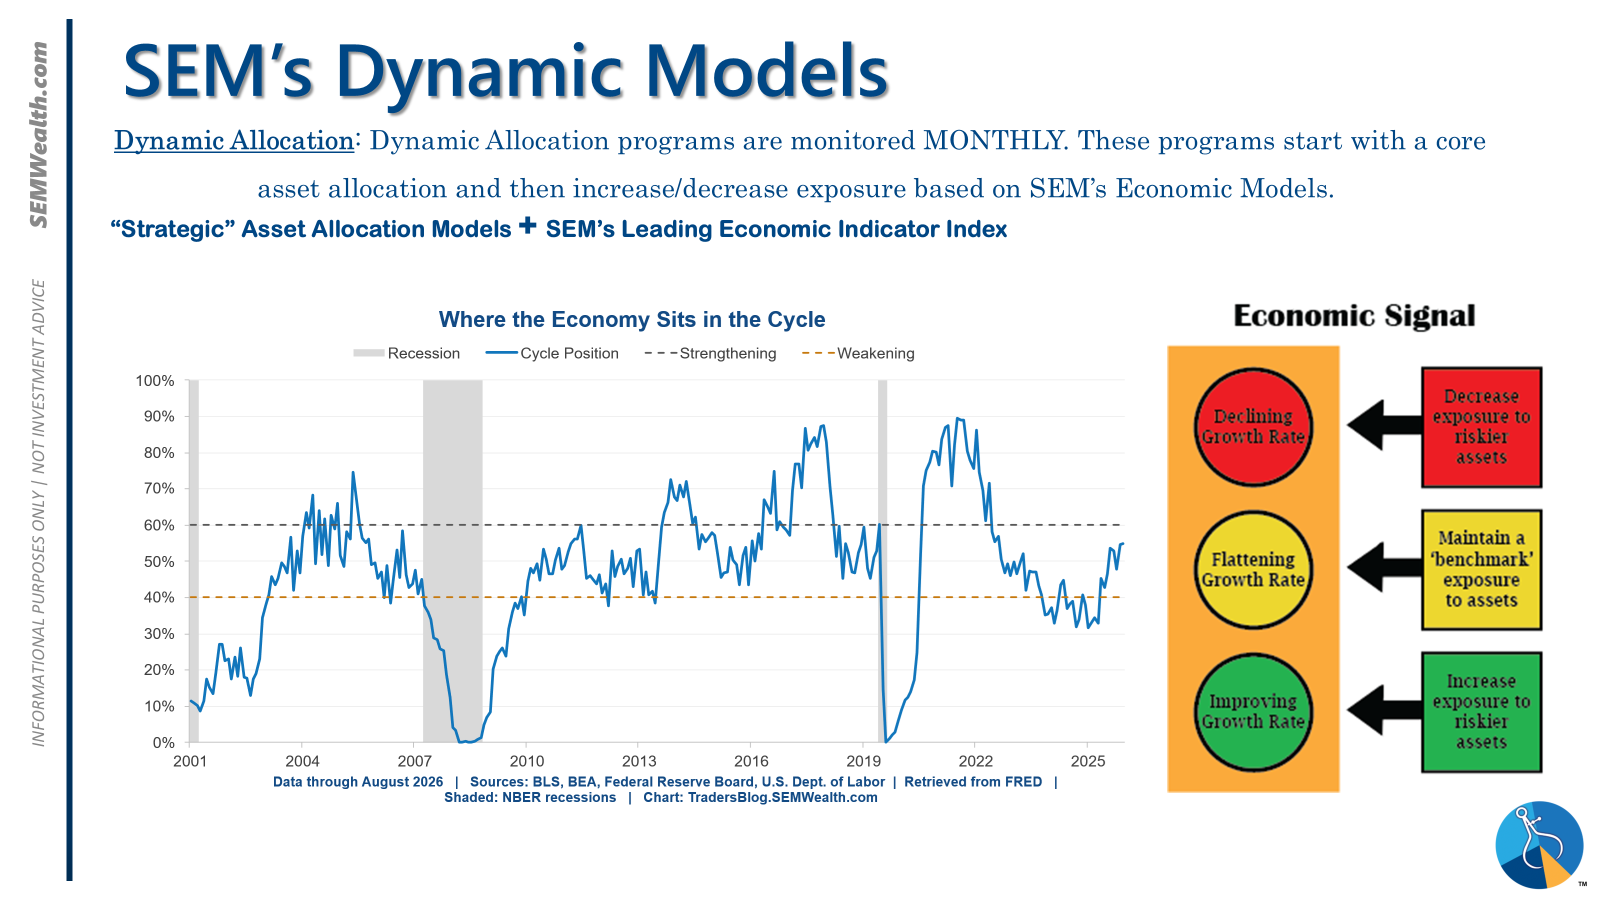
Our economic model's Cycle Position rose to 58.8%, just under the 60% line. That sounds bullish, but in our models "strong" means a MATURE cycle, and crossing it would take small caps to zero in our Dynamic Aggressive Growth allocation. That's less risk, not more. The model would need two months above 60% to confirm, so nothing will change before December at the earliest.
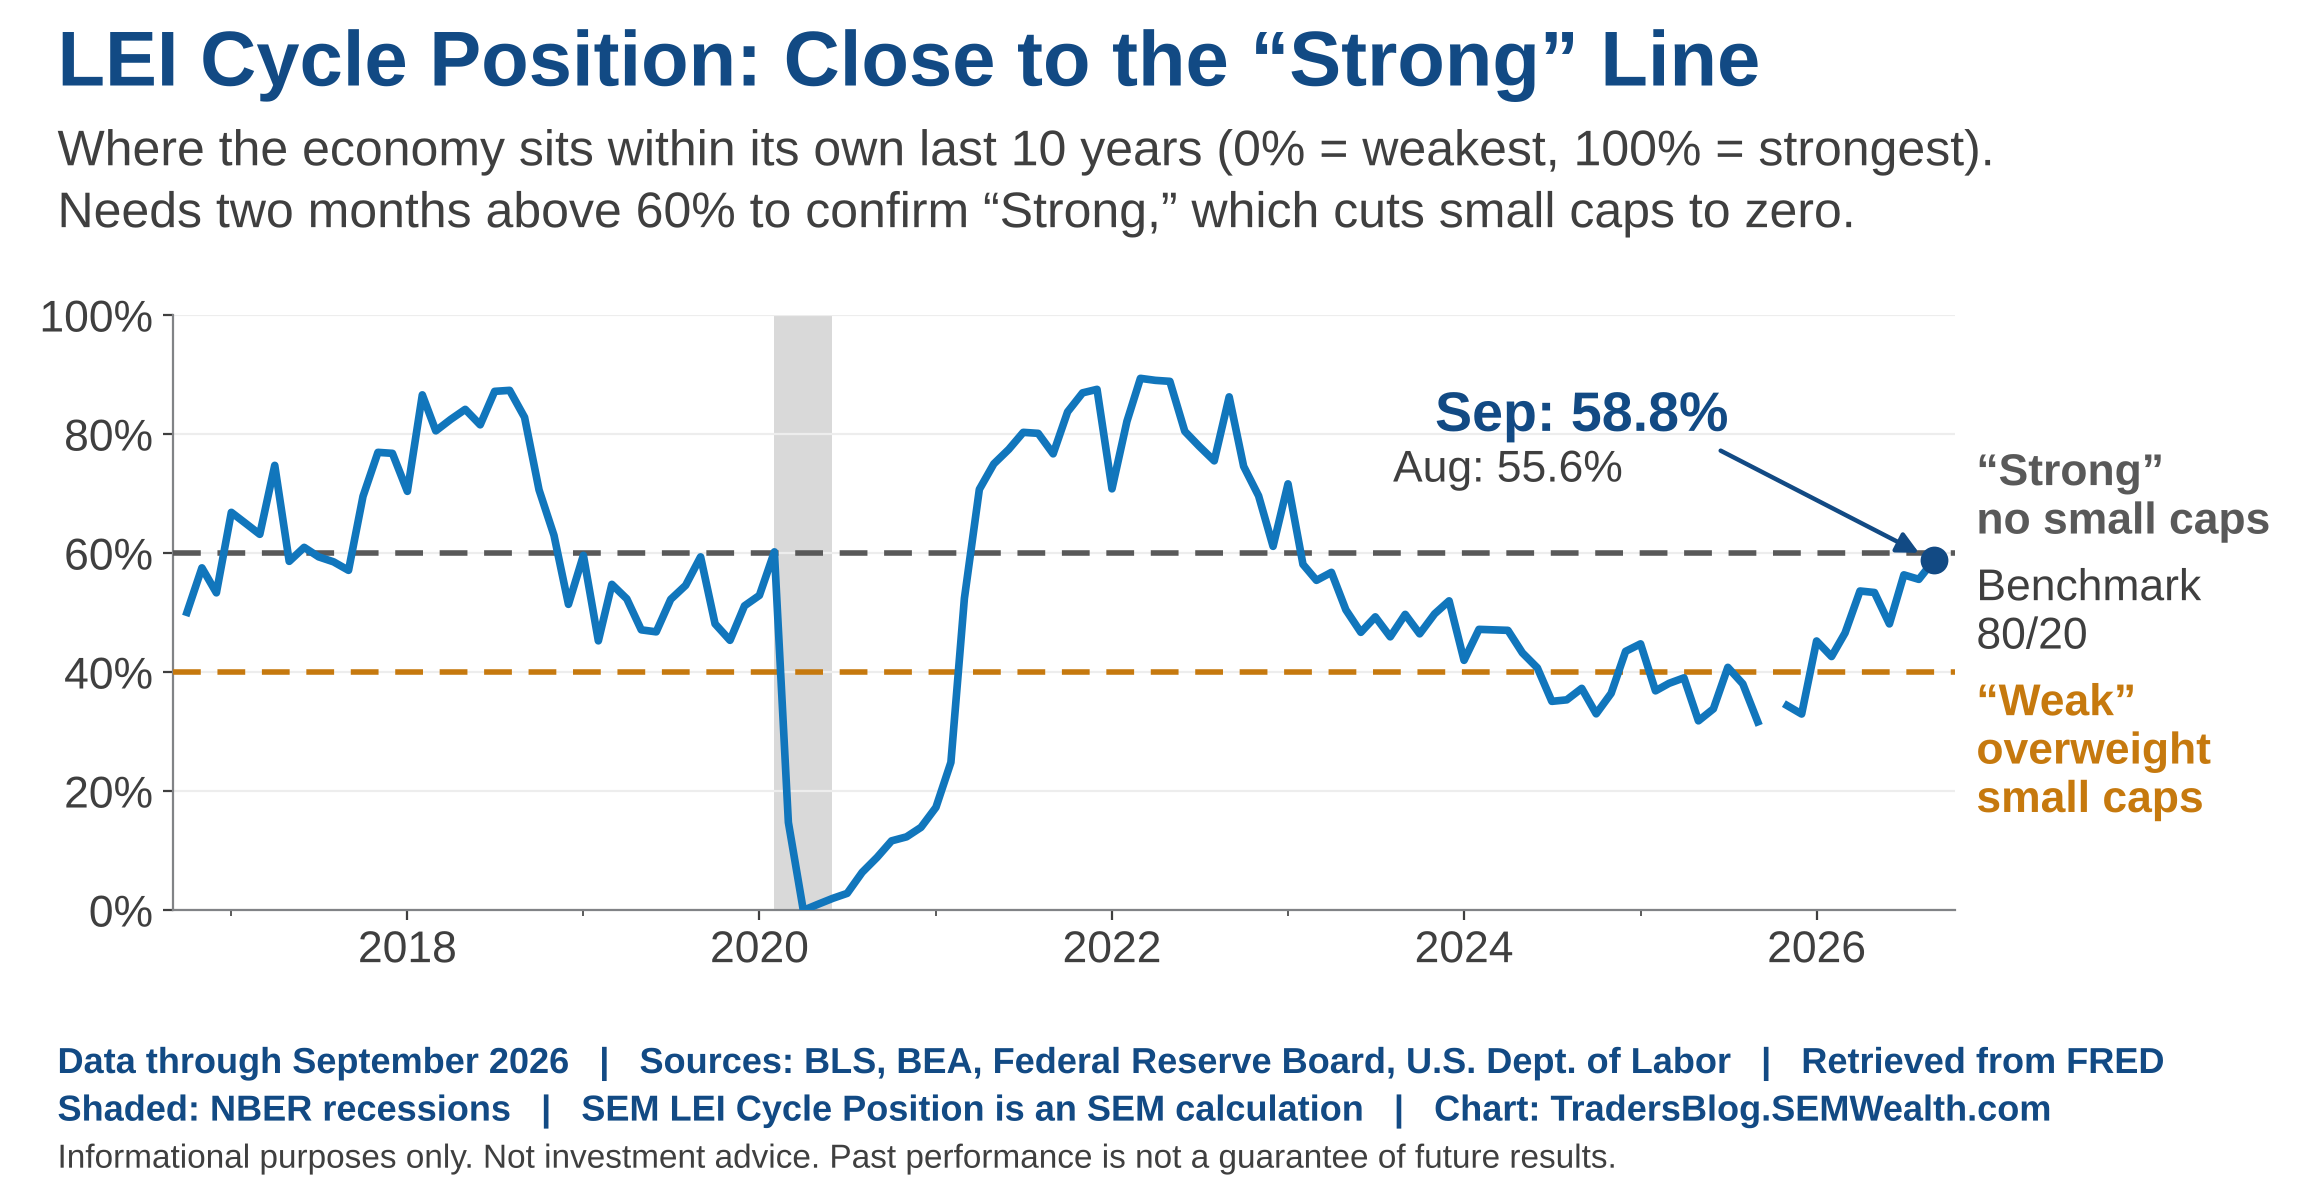
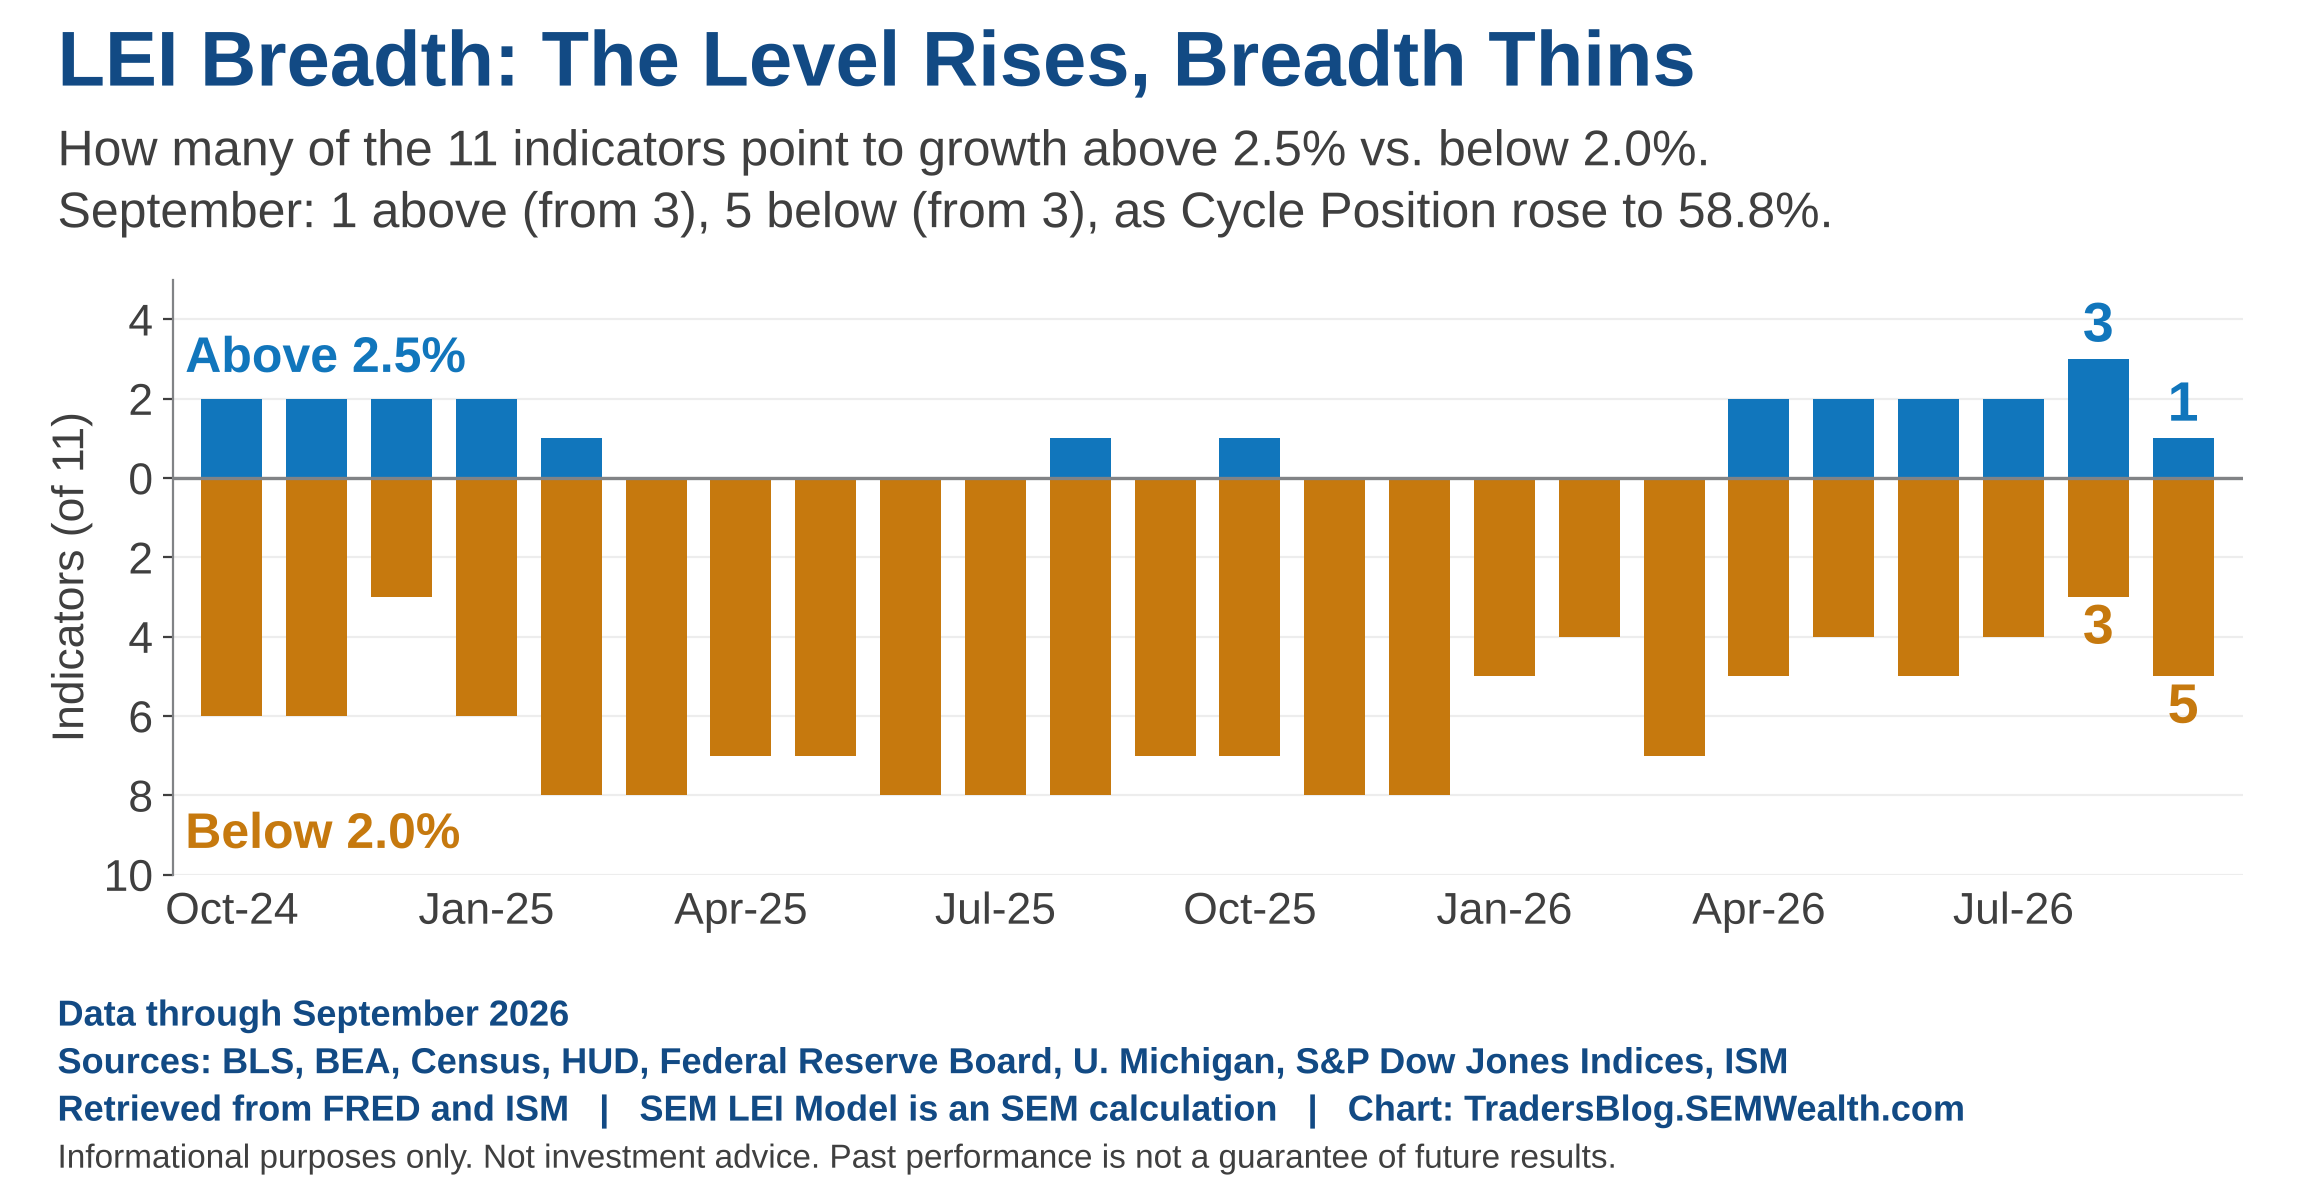
The level is rising, but fewer pieces are carrying it. Only 1 of our 11 indicators is above 2.5% (it was 3 in August), and 5 are below 2.0%. Overall growth is 2.1% and flat. As mentioned in point #4 above, that's not the "strong economy" the headlines describe.
8.) Grading my Fed call
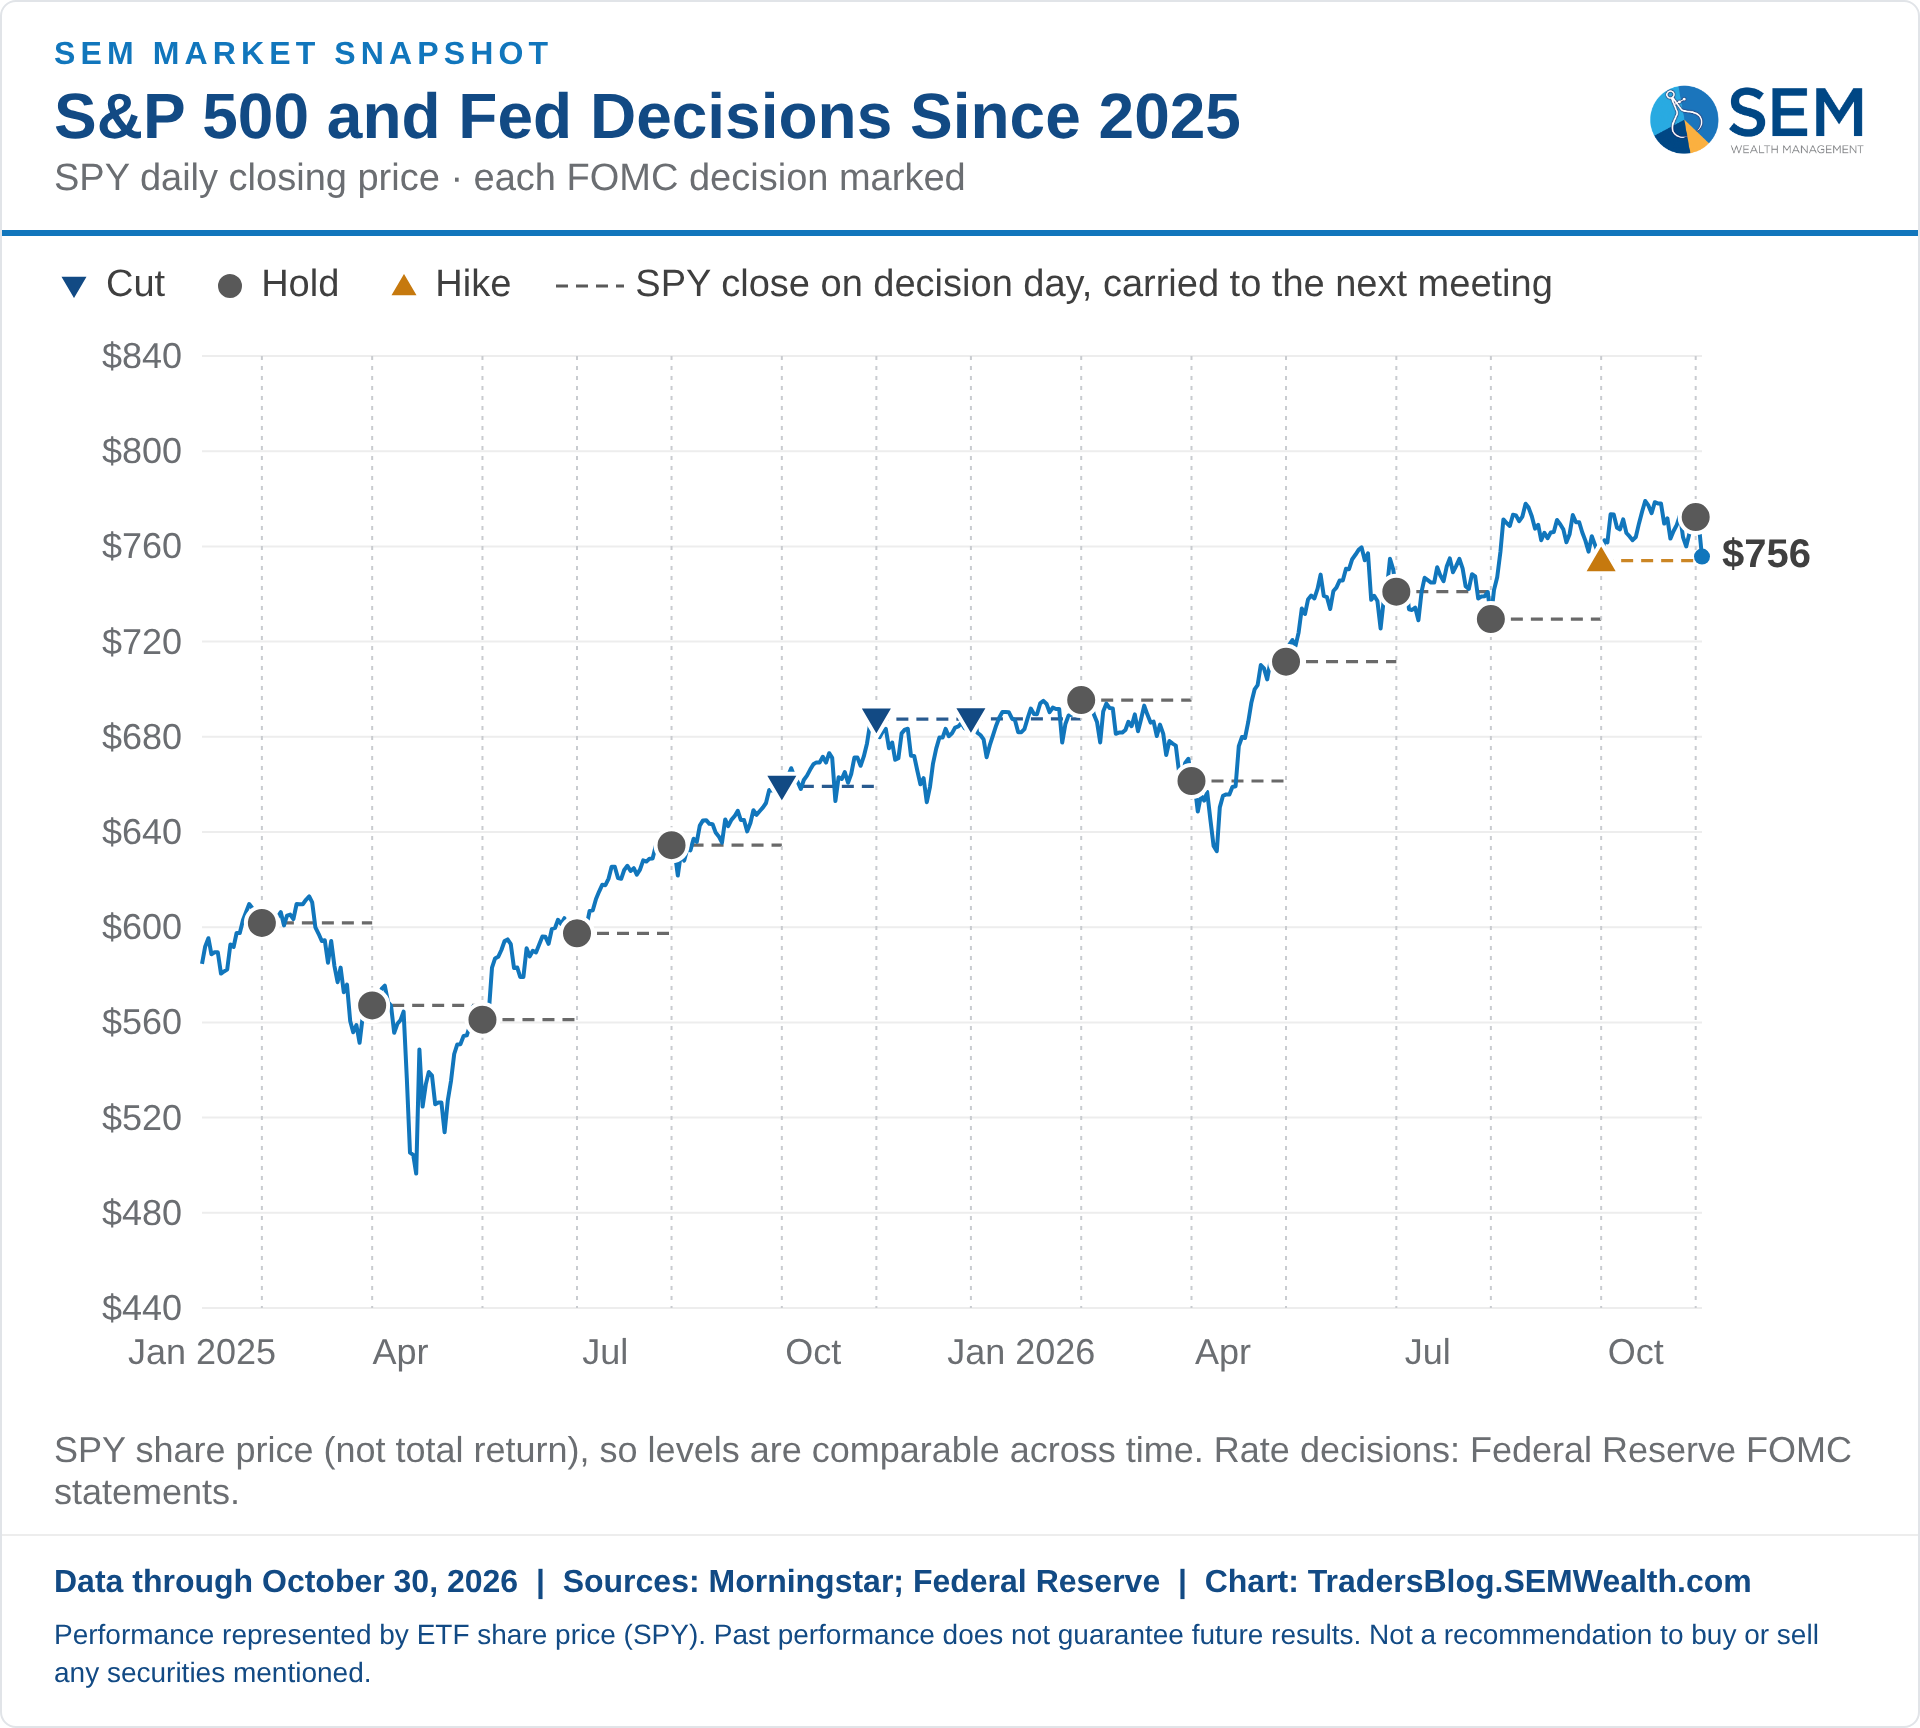
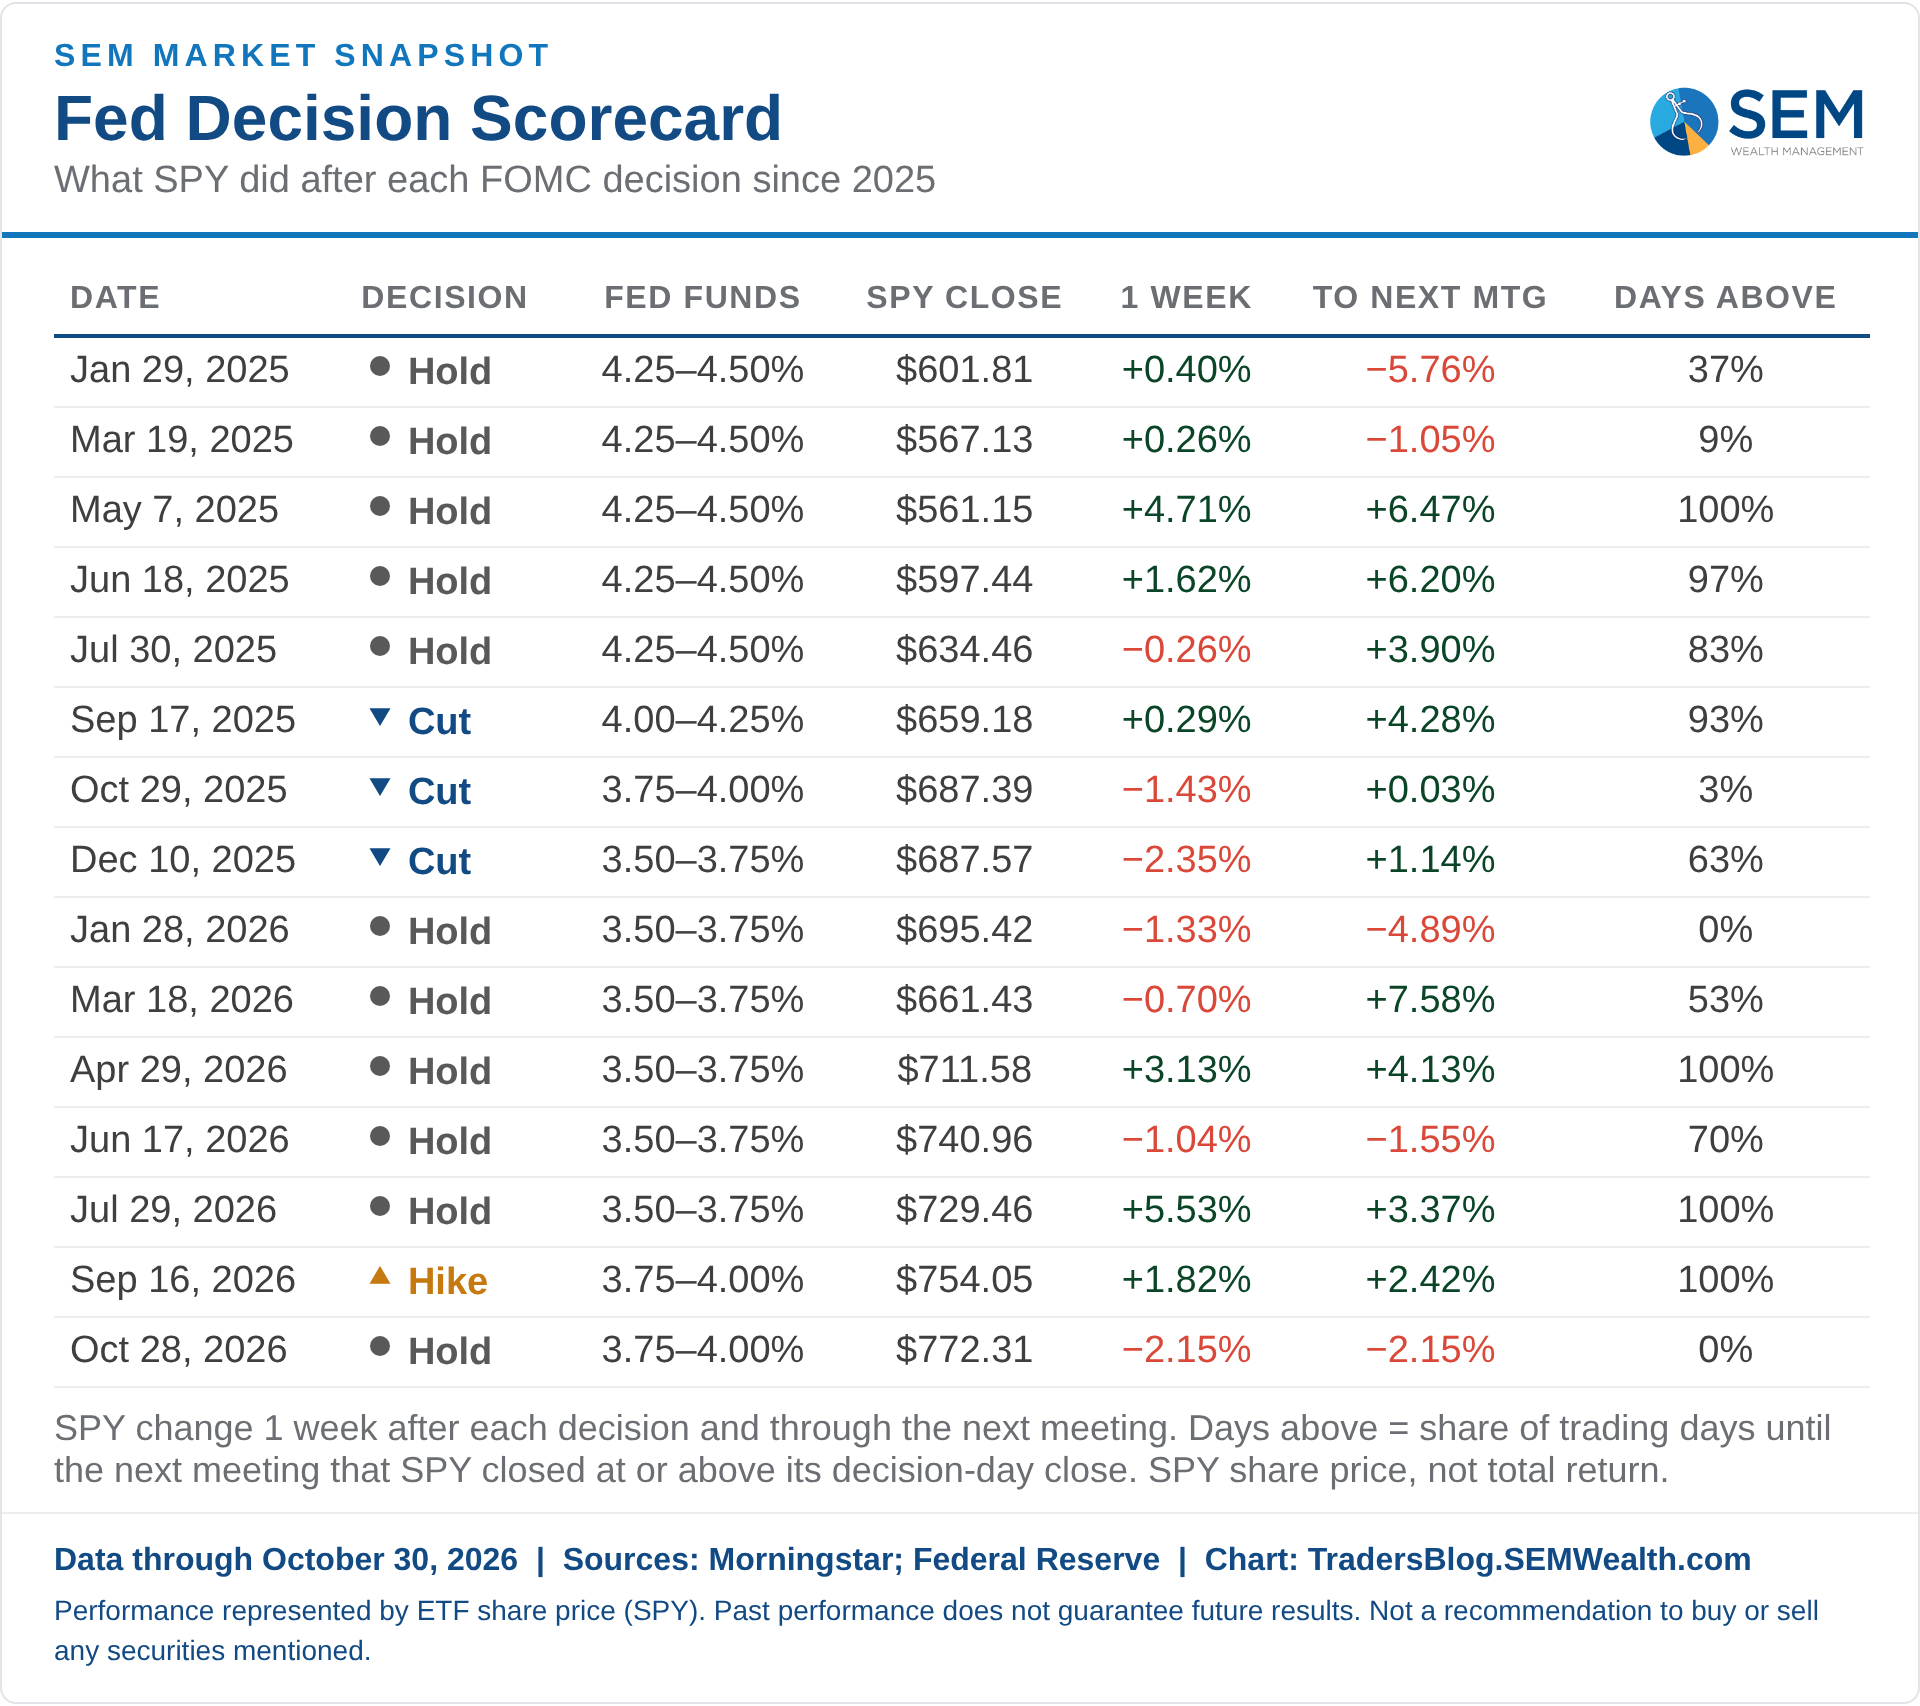
On Wednesday, the Fed held rates at 3.75-4.00% on a 10-2 vote, and both dissenters wanted a HIKE.
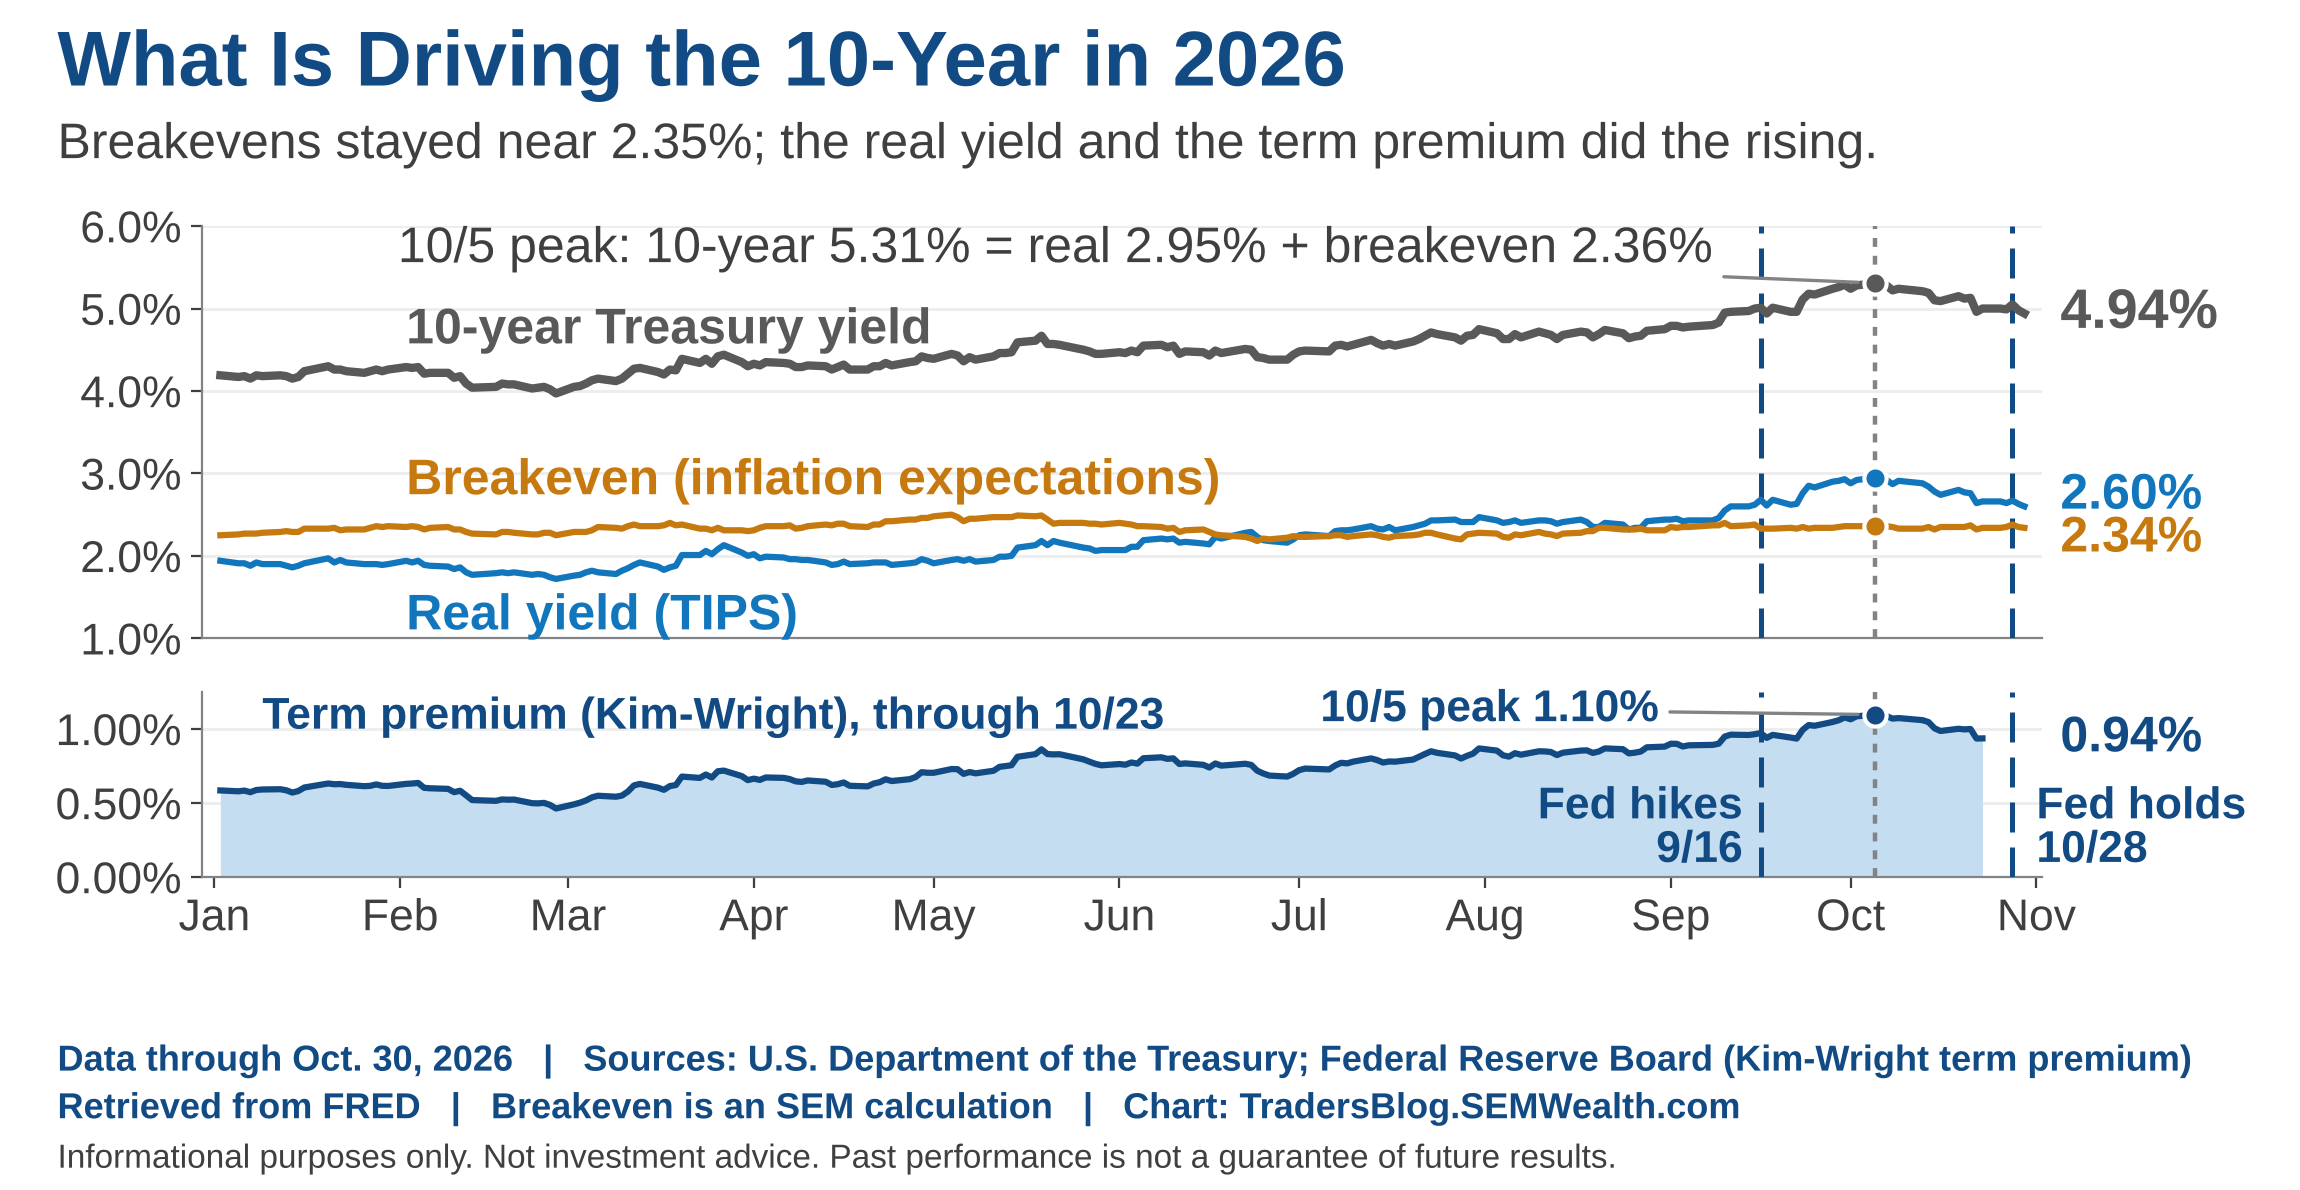
My call throughout the spring and summer was that once the Fed got "serious" about fighting inflation, long-term rates would fall. Since that time we've seen mixed results – wrong for three weeks, roughly flat after six, still too early to score. The 10-year went from 5.01% on the day of the September hike to 5.31% on October 5th, and was back to 4.94% on Friday.
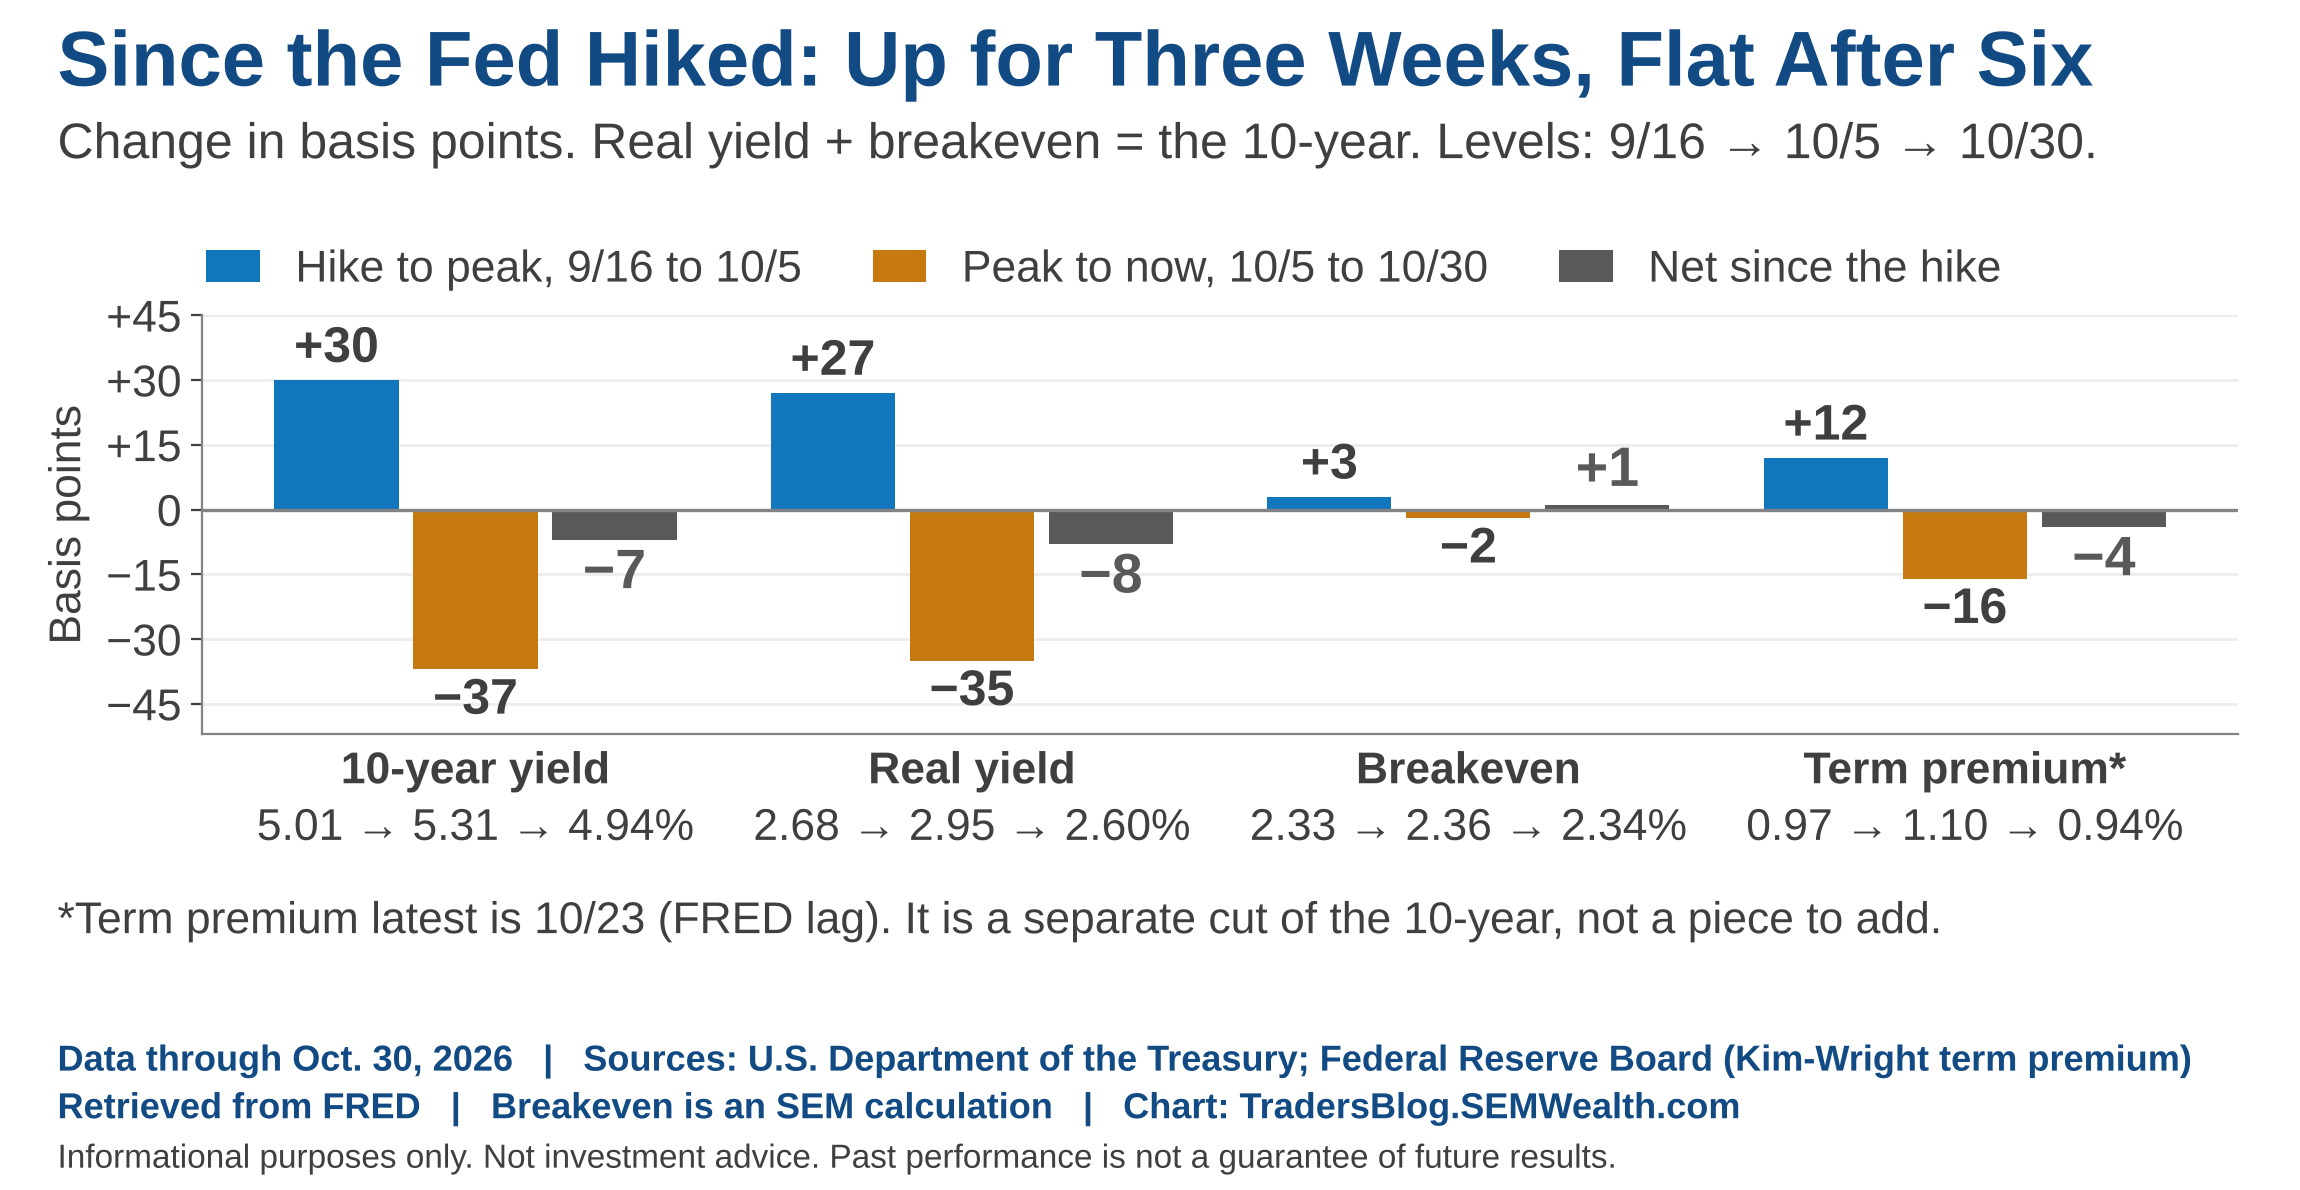
Here's where I probably went wrong – I trusted Chair Warsh's words before seeing how they'd turn into actual policy. I called him the most hawkish Fed chair of my career. That was certainly premature. The Fed funds rate minus core inflation is only about +0.6% to +0.9%, which is roughly "neutral," definitely not restrictive. I'm going to drop the call on what will happen with long-term rates based on the new Fed chair's actions.
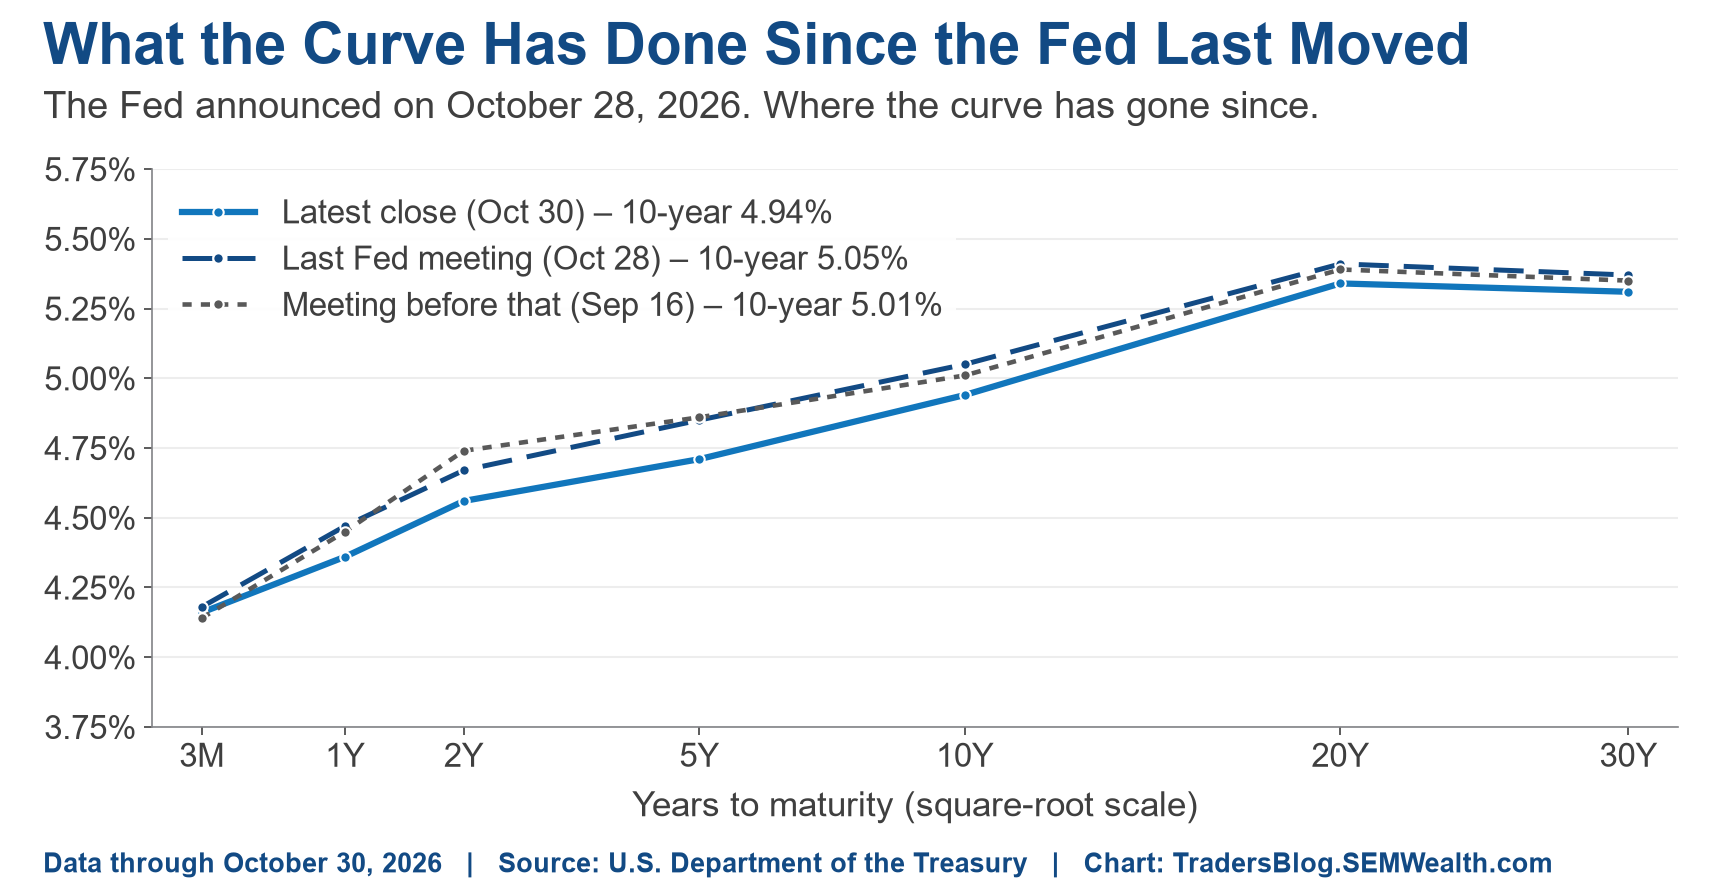
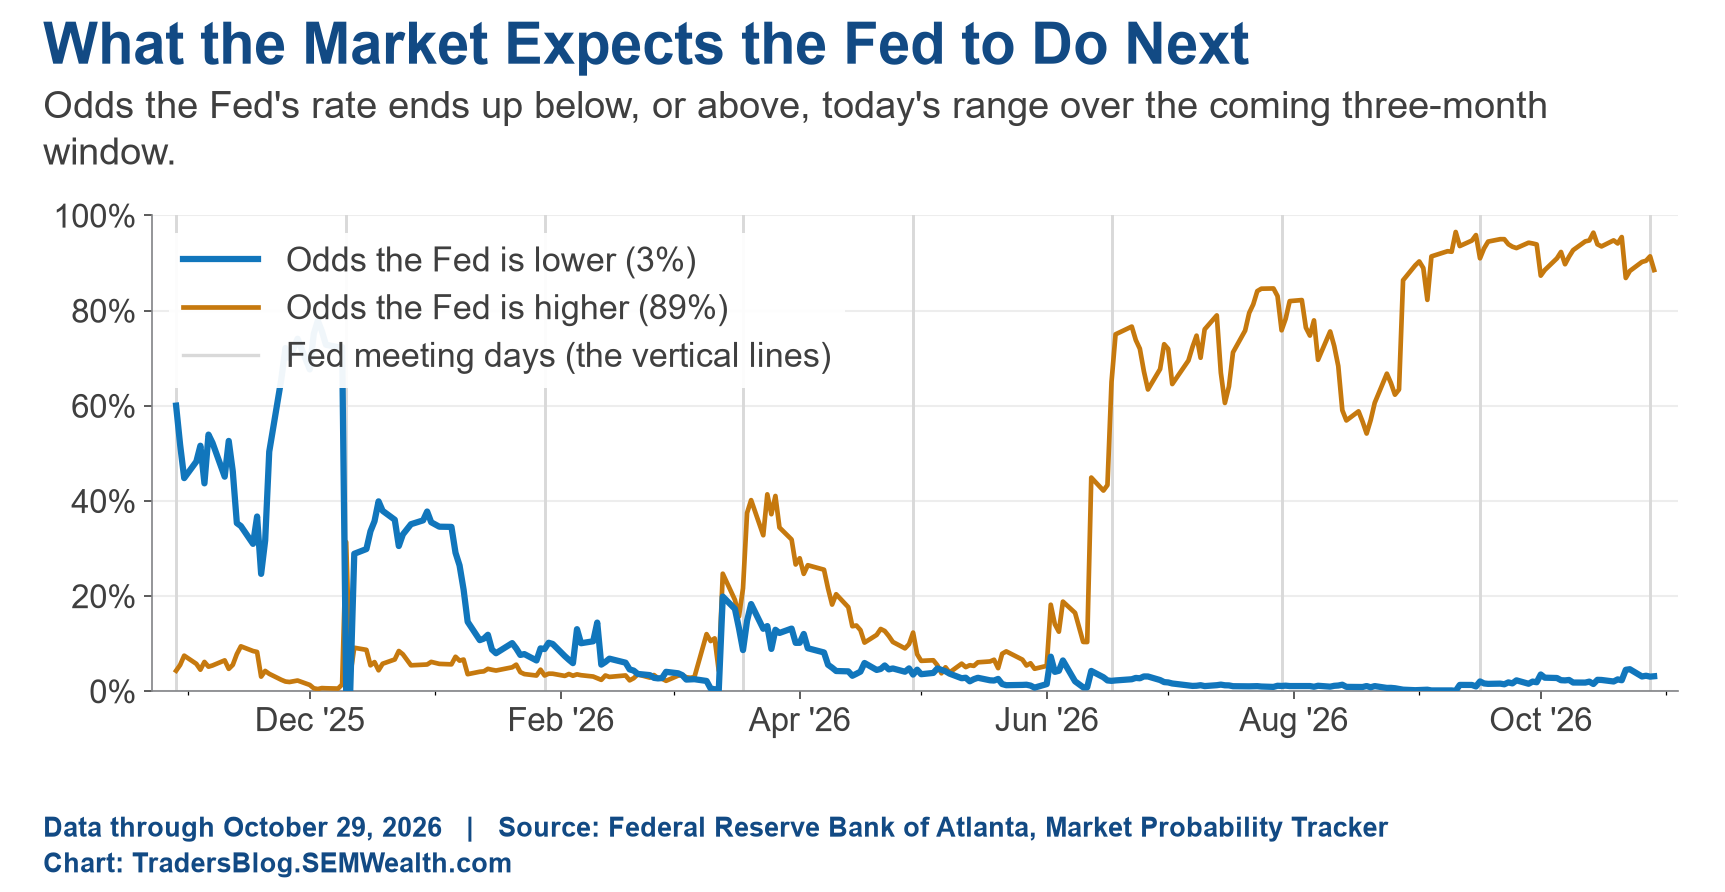
To be fair to Mr. Warsh, he told us not to grade him on words, most of the rise in inflation is oil, and a December hike (futures still price it at roughly 76% in December and 89% by January) would make him "gradual," not "not serious."
9.) Inflation is difficult
Instead of a prediction on long-term rate reactions, I'll simply watch and report on what's actually moving the 10-year. This year, inflation expectations have barely moved (+0.09%). The real yield (+0.66%) did the rising, and the term premium (the extra return investors demand to hold a long bond) hit its highest level since 2010 in early October.
September's PCE inflation was 3.65% (headline) and 3.12% (core), both higher. Energy is up 20% from a year ago, and that's an oil supply shock short-term interest rates can't fix. With Brent around $113, the upside risk is an escalation with Iran after the election. The good news for us is core inflation over the last 3 and 6 months (about 2.9%) is running BELOW its 12-month pace.
10.) The average stock beat the index
In October, the "average" stock (the equal-weighted S&P 500) gained 4.9%, while the S&P 500 fell 0.9%. Nine of 11 sectors were up. But look at WHAT led: energy and the defensive sectors (staples, utilities and health care), while small caps lagged and technology and communication services fell sharply.
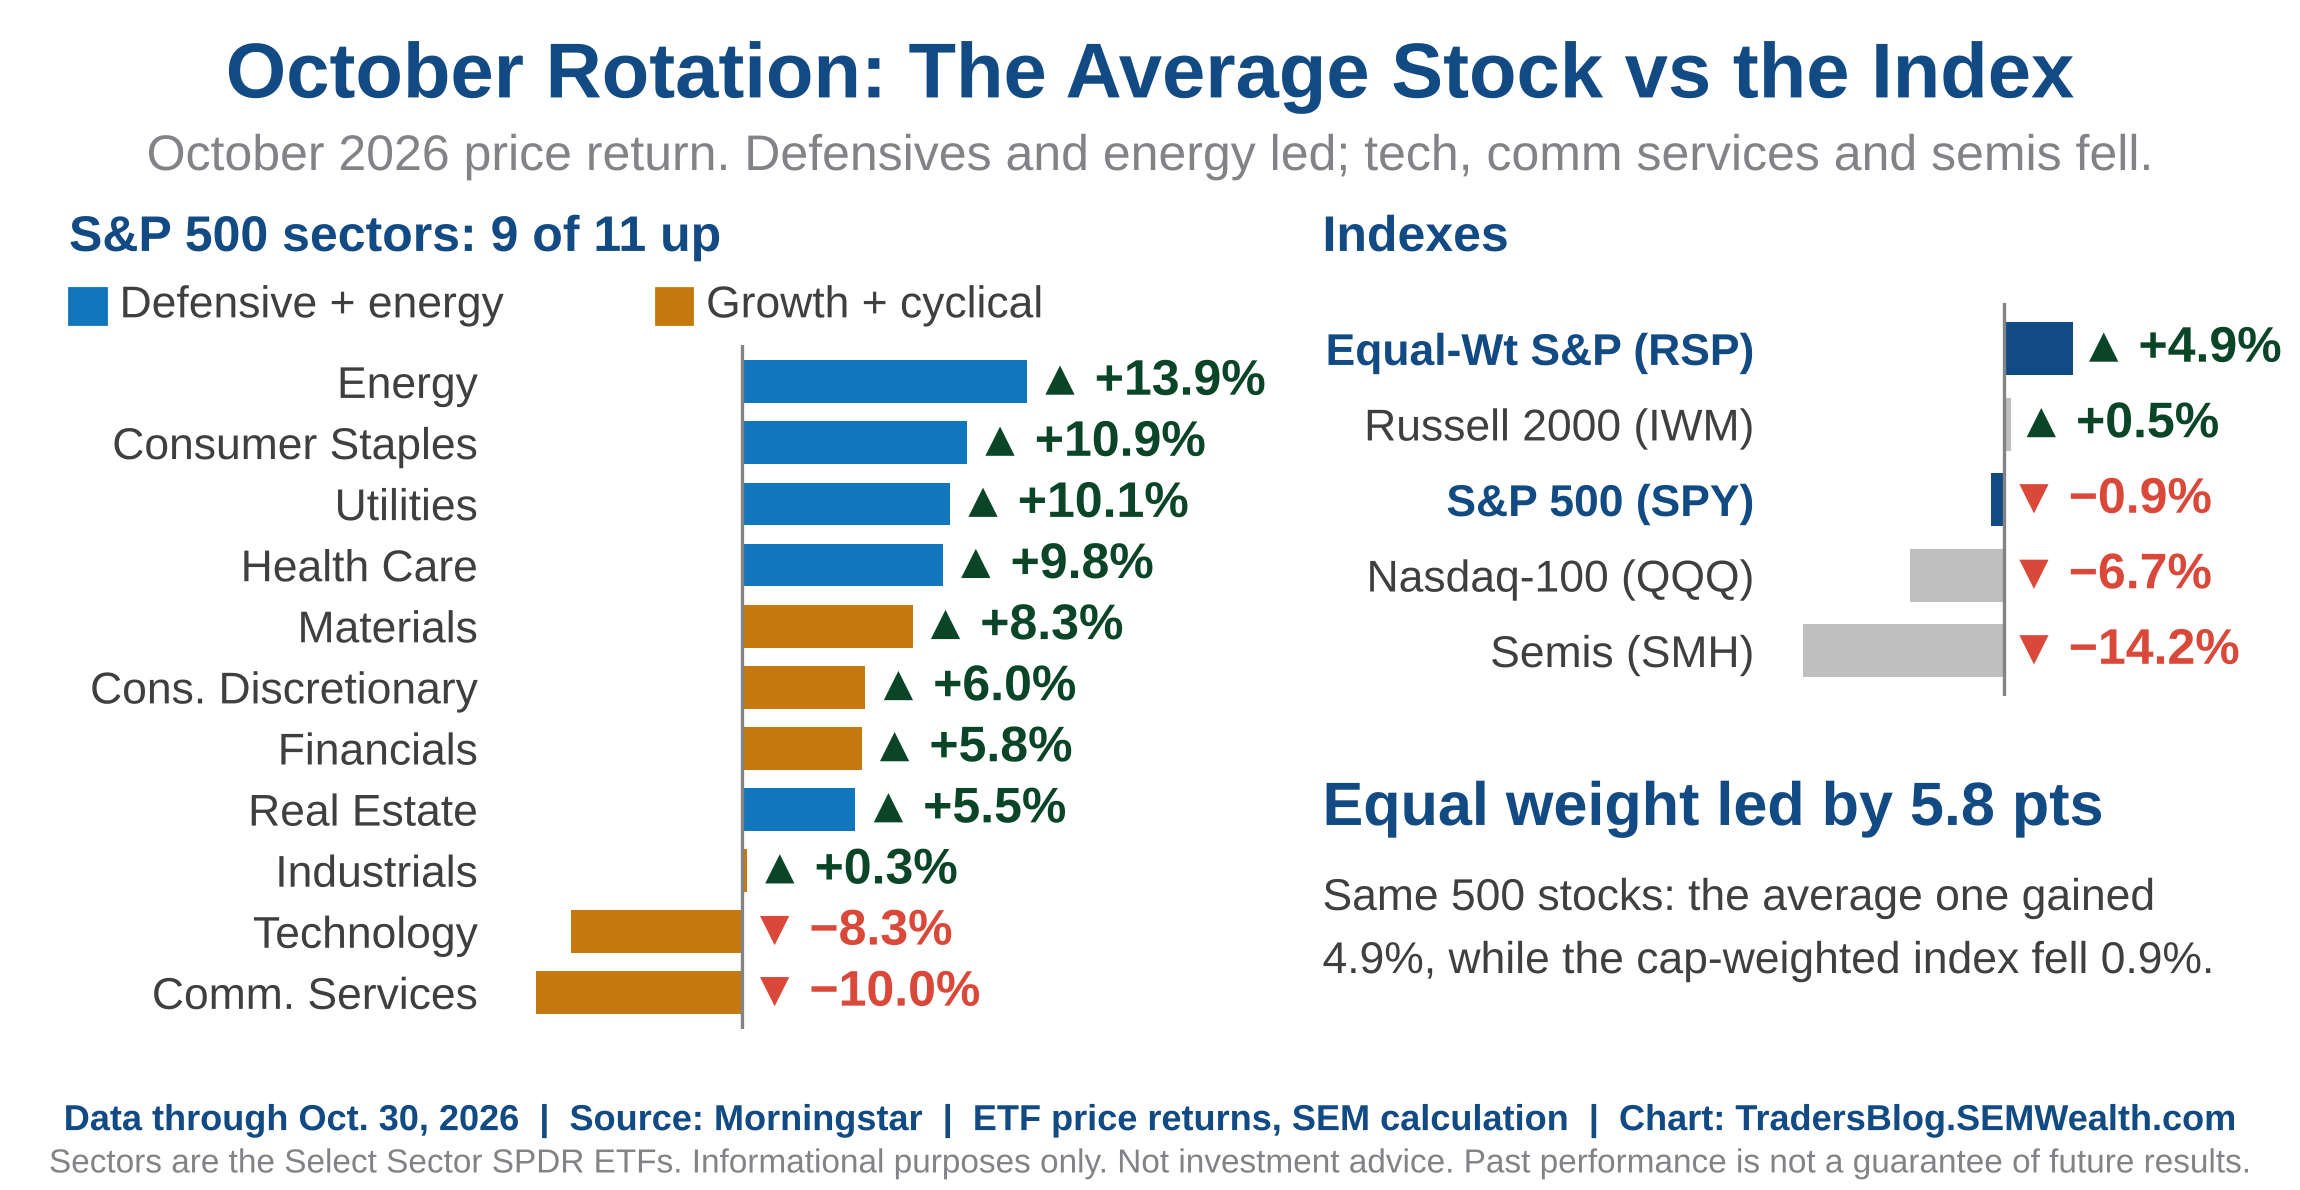
That looks like a late-cycle rotation, and it matches our models stepping back from small caps. But it's one month, and there are simpler explanations (oil at $116, and defensive stocks act like bonds when the 10-year falls back under 5%). The S&P's fear gauge (the VIX) is only about 19, near its long-term average, while Nasdaq volatility jumped to 28.5 (versus an average of 24.6). The fear (for now) is in the leaders, not the average stock.
11.) The election, and a "perfect" record
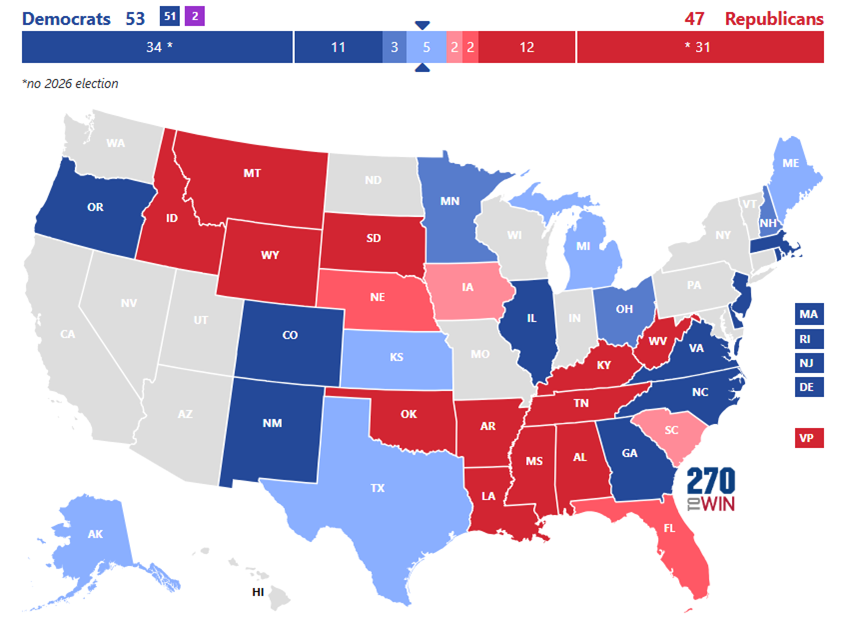
Cody's Senate map shows how the Senate would look if every current poll held: Democrats 53, Republicans 47. The majority sits in the five "lean Democrat" states (Michigan, Maine, Texas, Kansas and Alaska). Democrats need 3 of those 5. Prediction markets put a Democratic sweep at about 70% (based on Polymarket as of Saturday morning), and the forecasters are a little less sure. Polls and prediction markets can both be wrong, and markets tend to overpay for long shots, not favorites.
(see the "Election Update" below for more)
The first test after Tuesday isn't a policy agenda, but instead it's the December 11 government funding deadline. The new Congress isn't sworn in until January, so the outgoing Congress handles it either way. Punting to the next Congress seems to be the only thing the politicians are consistently good at. That doesn't mean they won't expose us all to some drama ahead of time (or that we won't see politicking in protest of the election results.)
Something you may have heard lately is that the stock market has a "perfect" positive record following the midterms. The data agrees – the S&P 500 has been up 19 out of 19 times since 1950, with an average gain of about 15%. But it's rarely smooth. In 2018 it fell 14% first and still finished up 12%.
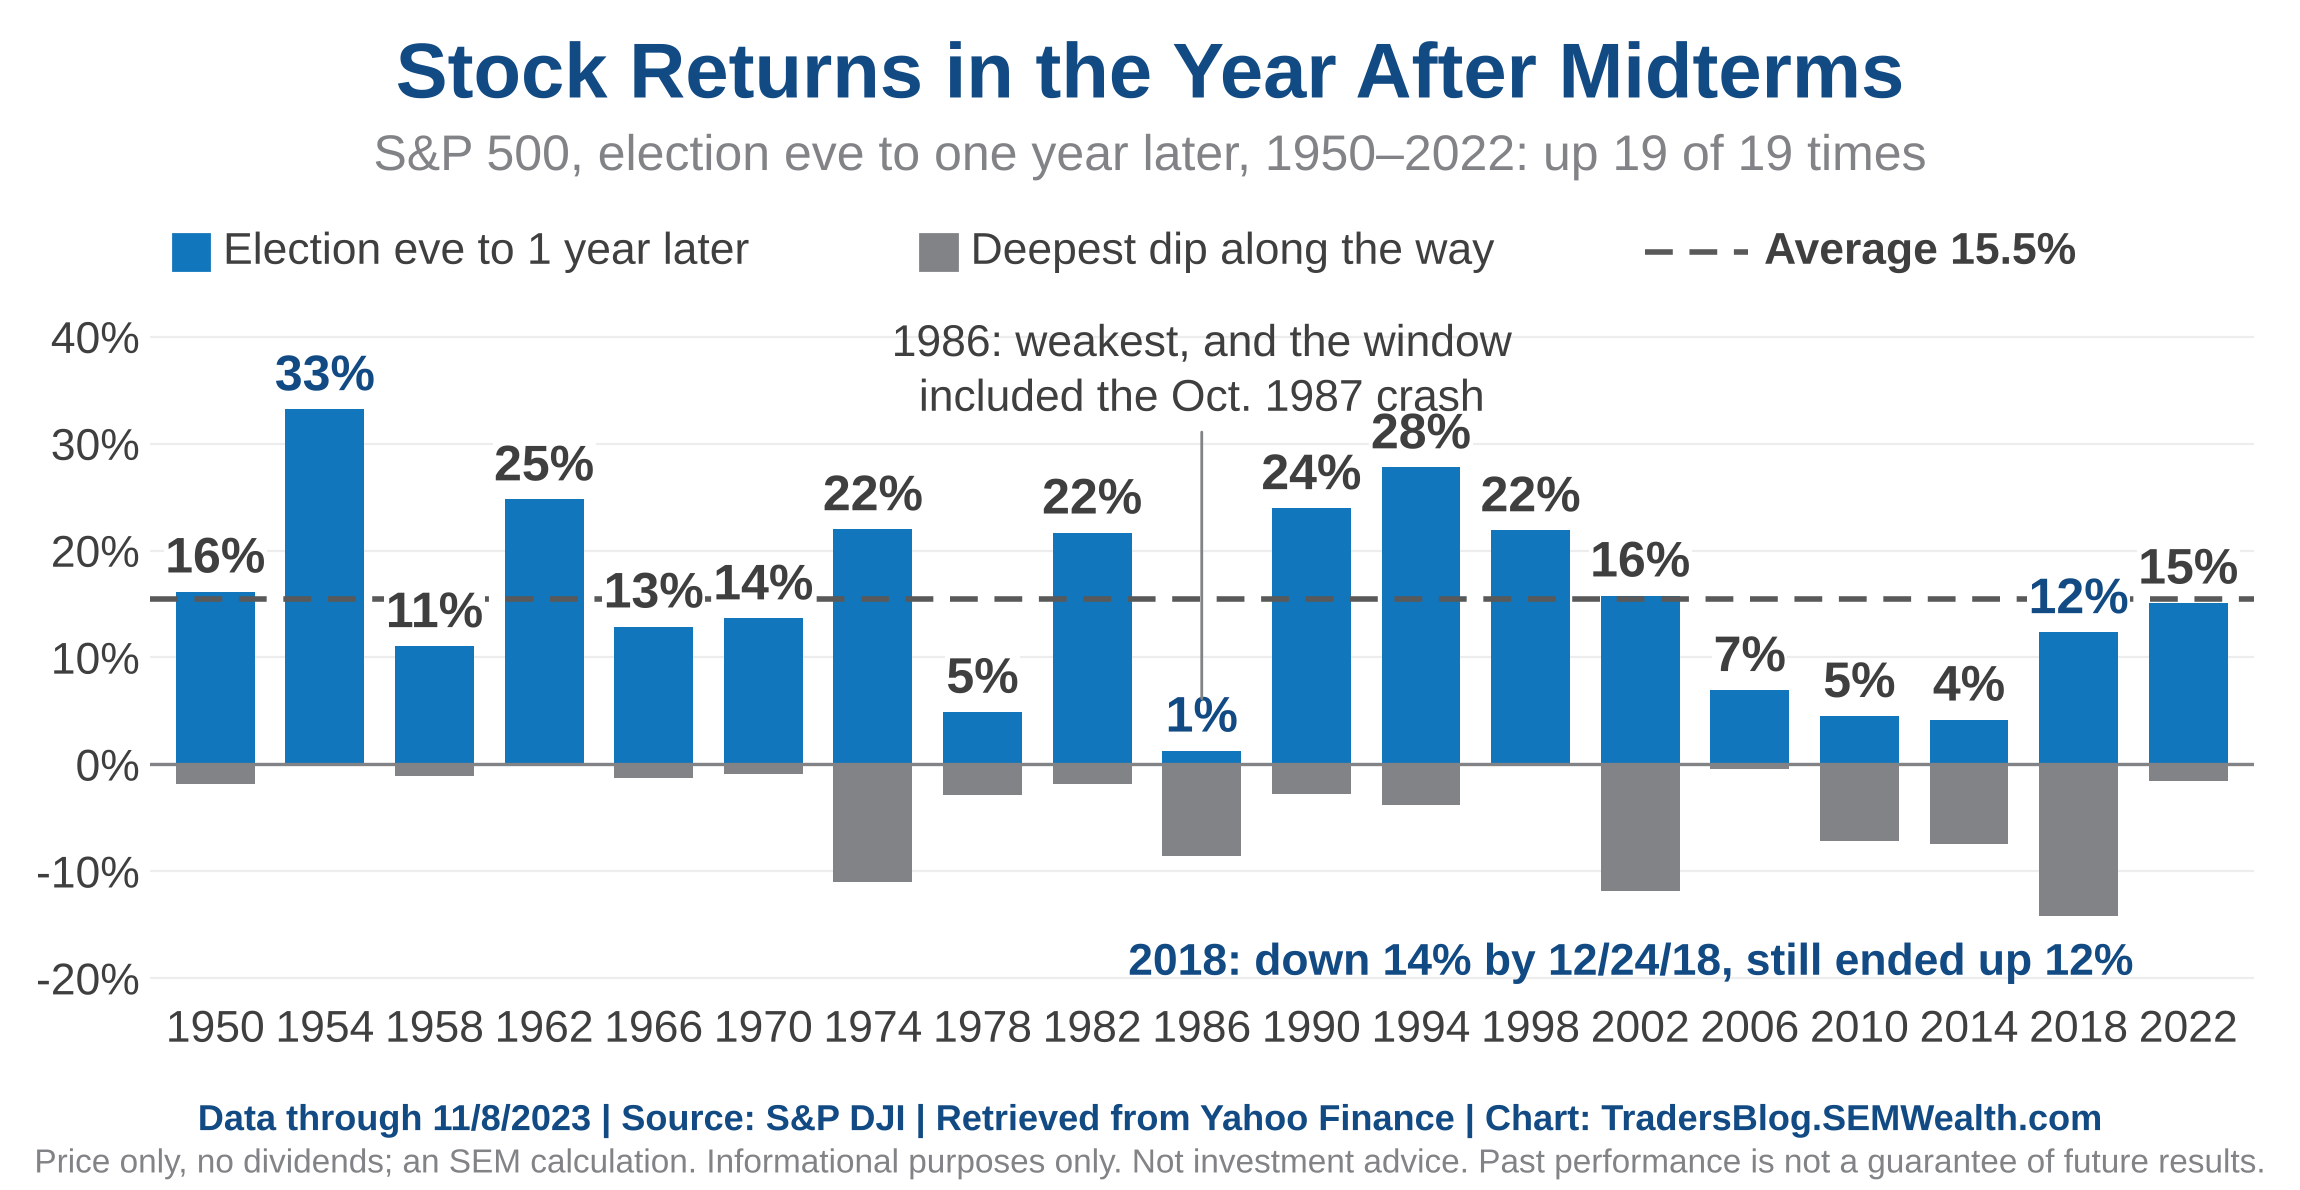
It's also a small sample, mostly from an era of falling interest rates. One other thing that's not similar – this year we never got the usual midterm-year selloff to set up the rebound.
12.) Melt-up before melt-down?
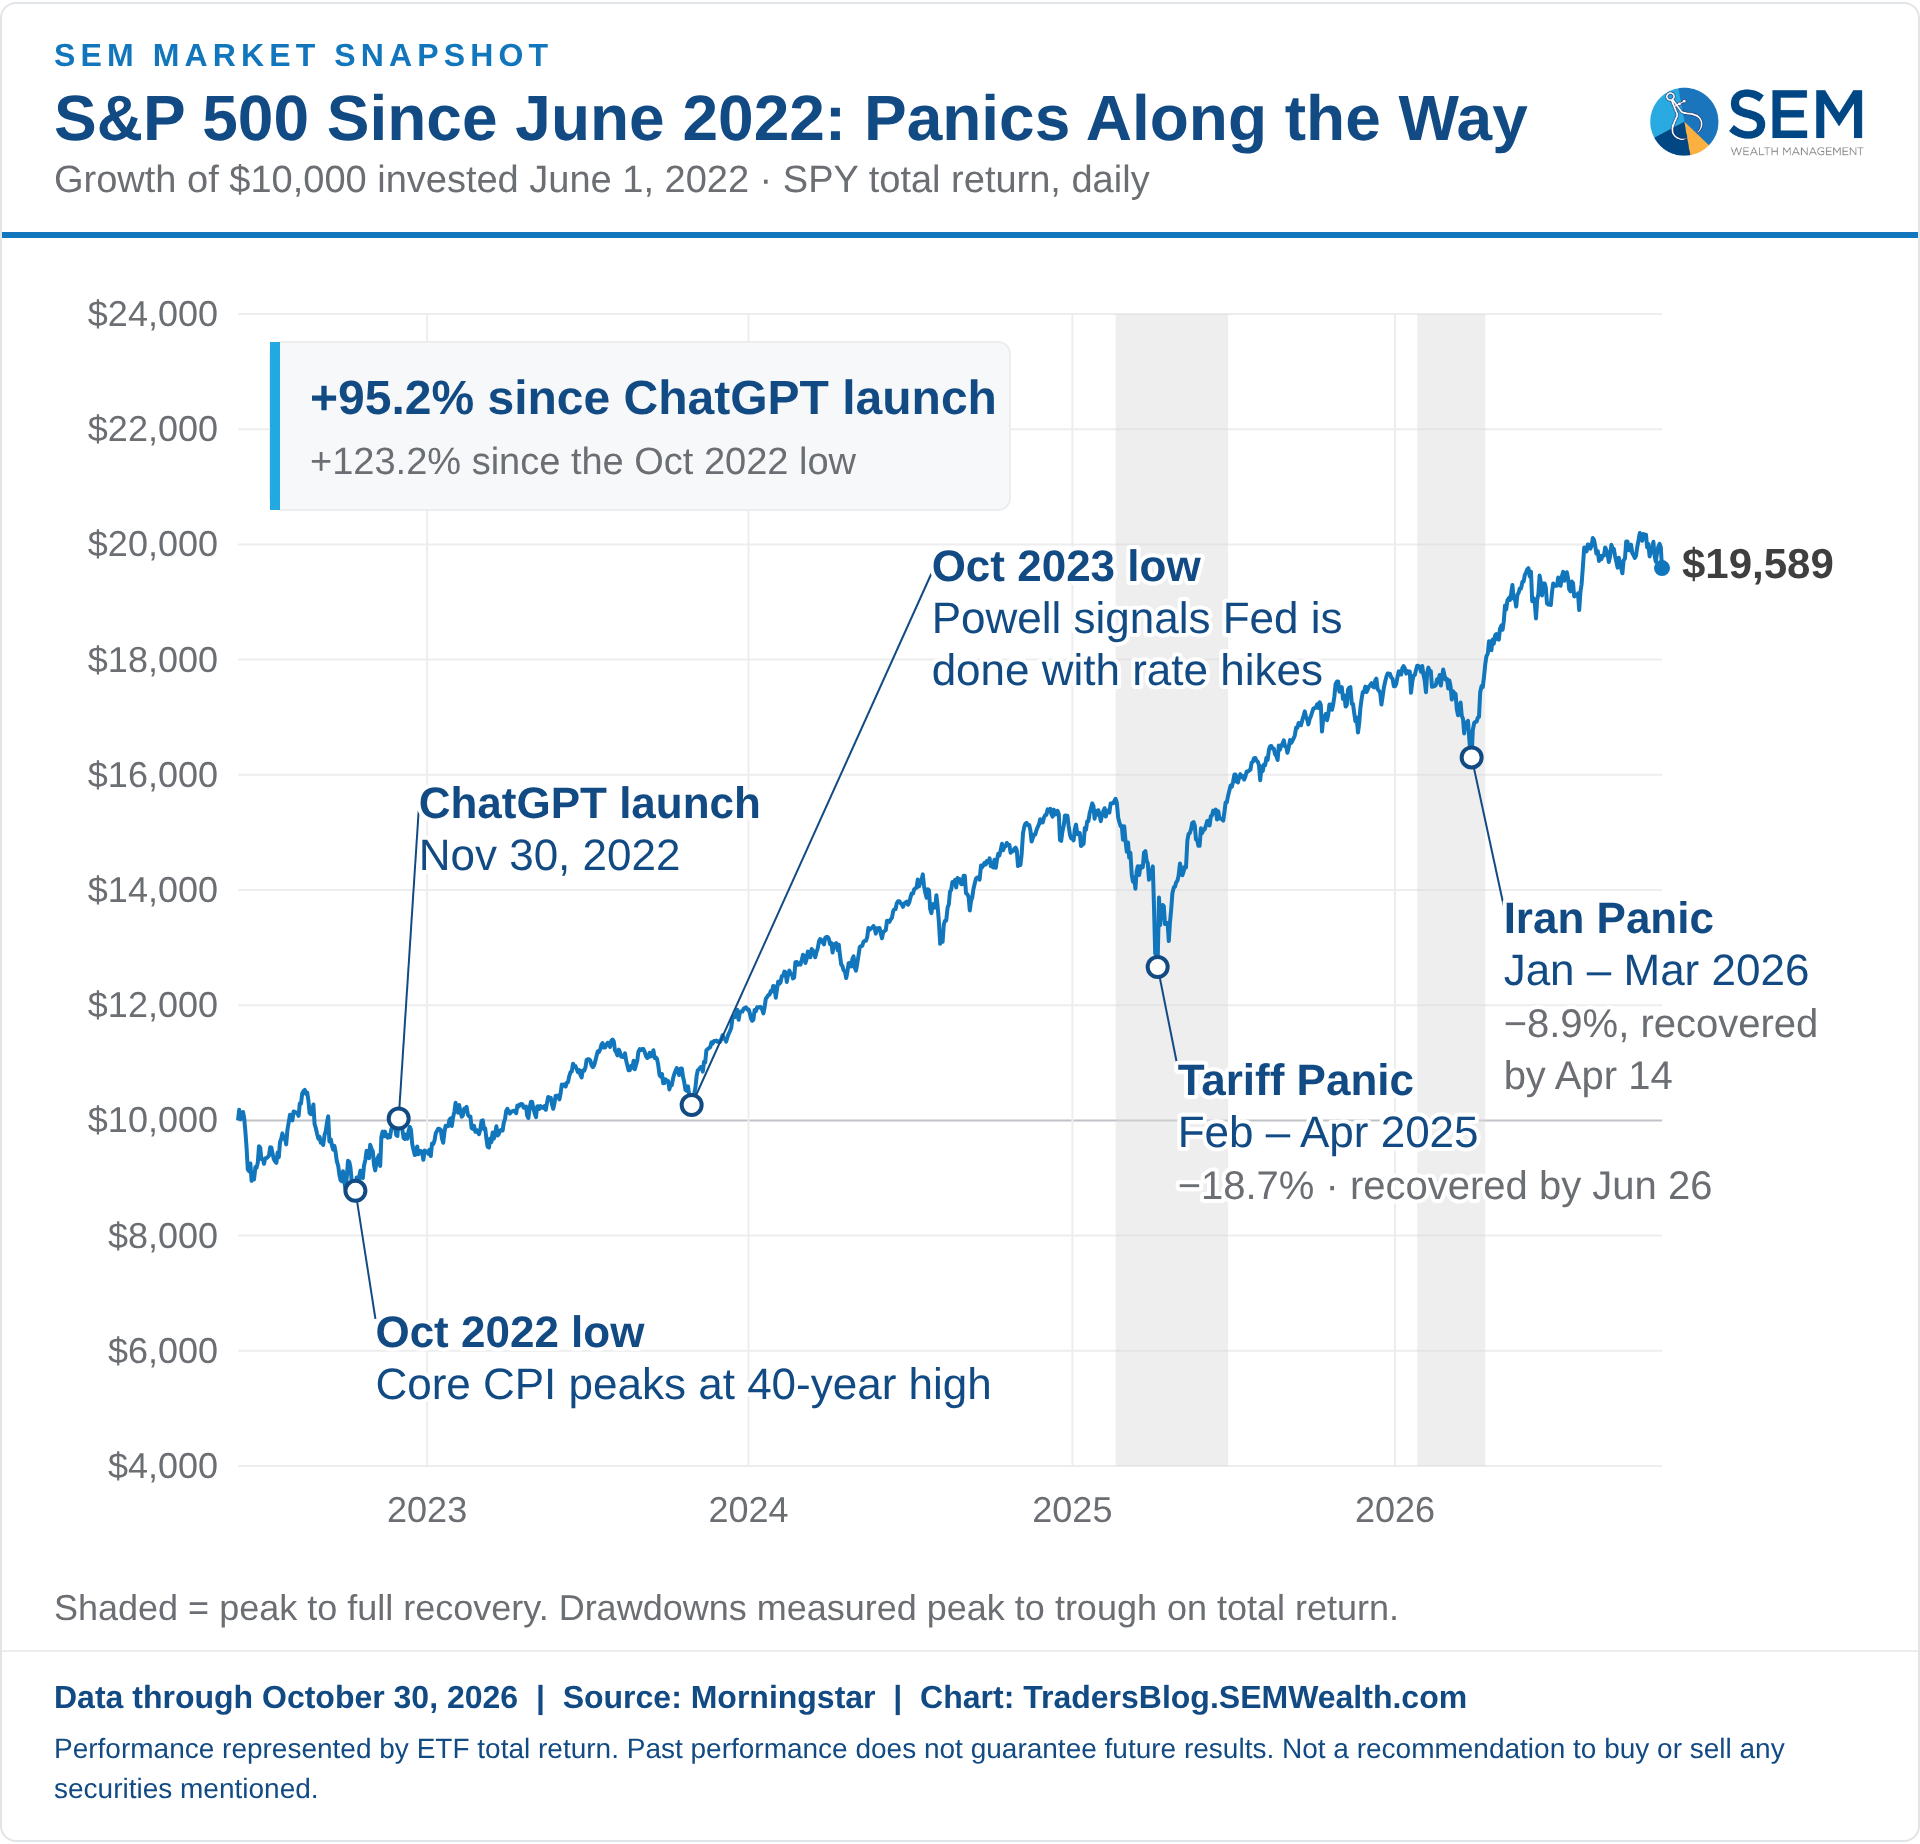
The most common question at our conference booths the past 4 weeks was "when does the AI 'bubble' burst?" The honest answer is we don't know. We could easily see a "melt-up" first. In 1998, Russia defaulted and Long-Term Capital Management had to be rescued (technically the banks who were overexposed to LTCM had to be rescued). The S&P fell 19% and the Nasdaq 30%. The Fed cut three times in seven weeks, and the Nasdaq then gained 256% to its March 2000 peak.
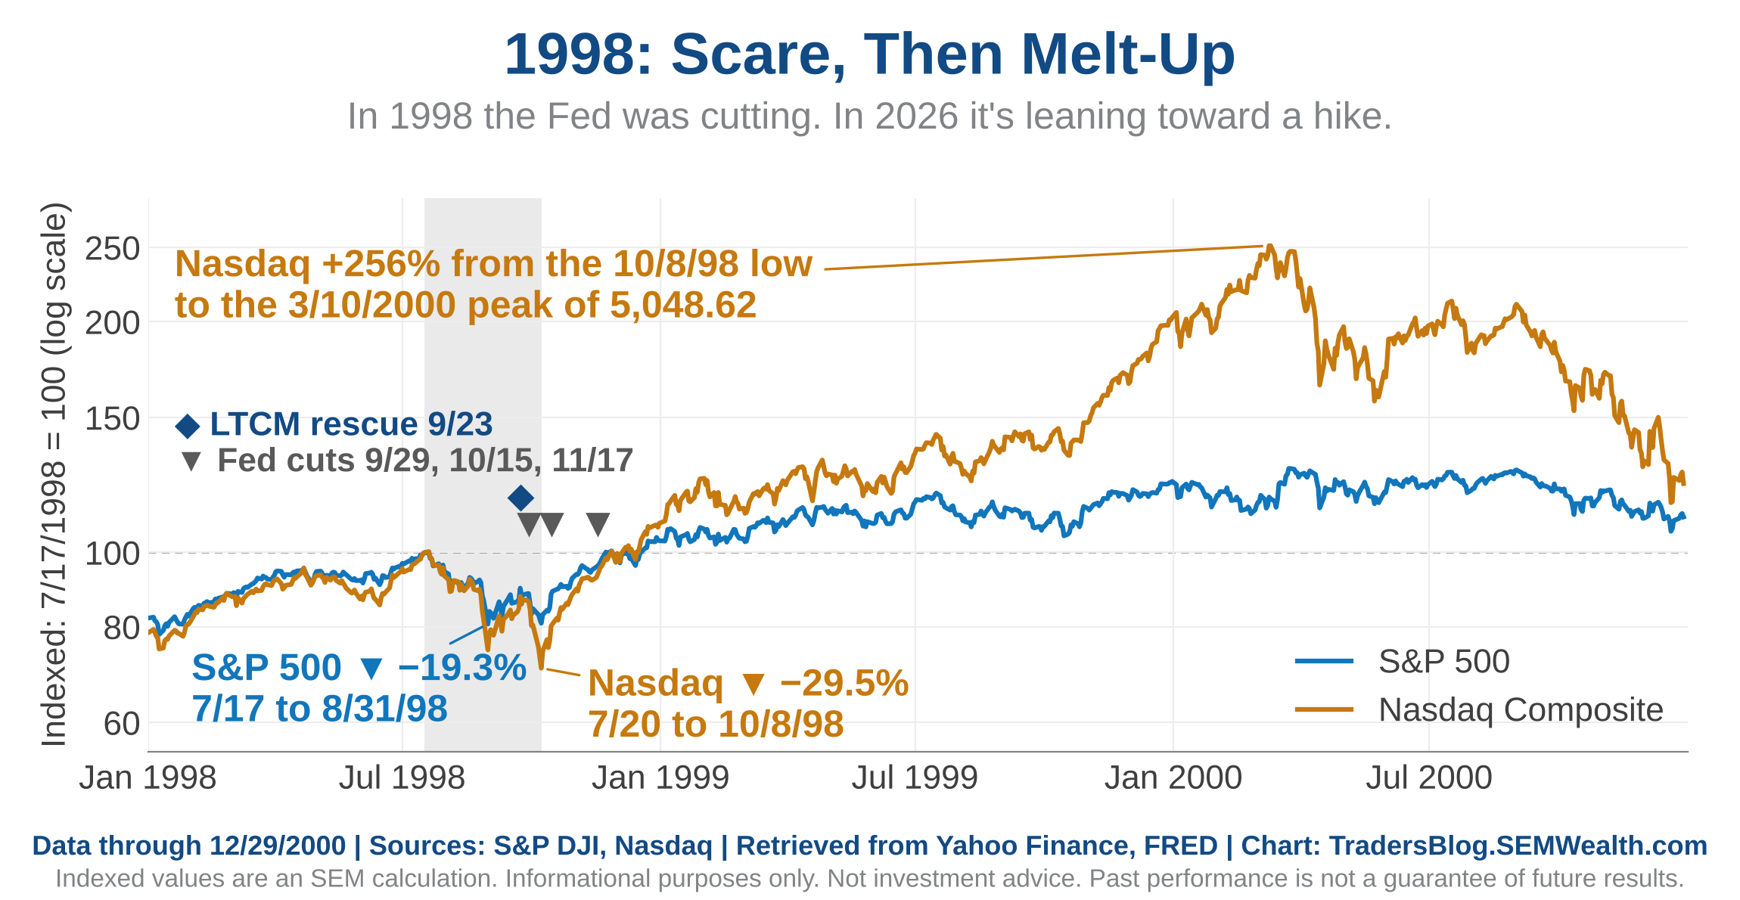
One difference could matter here – in 1998 inflation was low (core PCE was 1.2%) and the Fed had room to cut rates. Today PCE inflation is 3.6% and the Fed is leaning toward hiking rates. It would likely take a bigger scare, and the Fed would likely try emergency lending first (remember in March 2023 it opened a lending facility for banks and still hiked a week later).
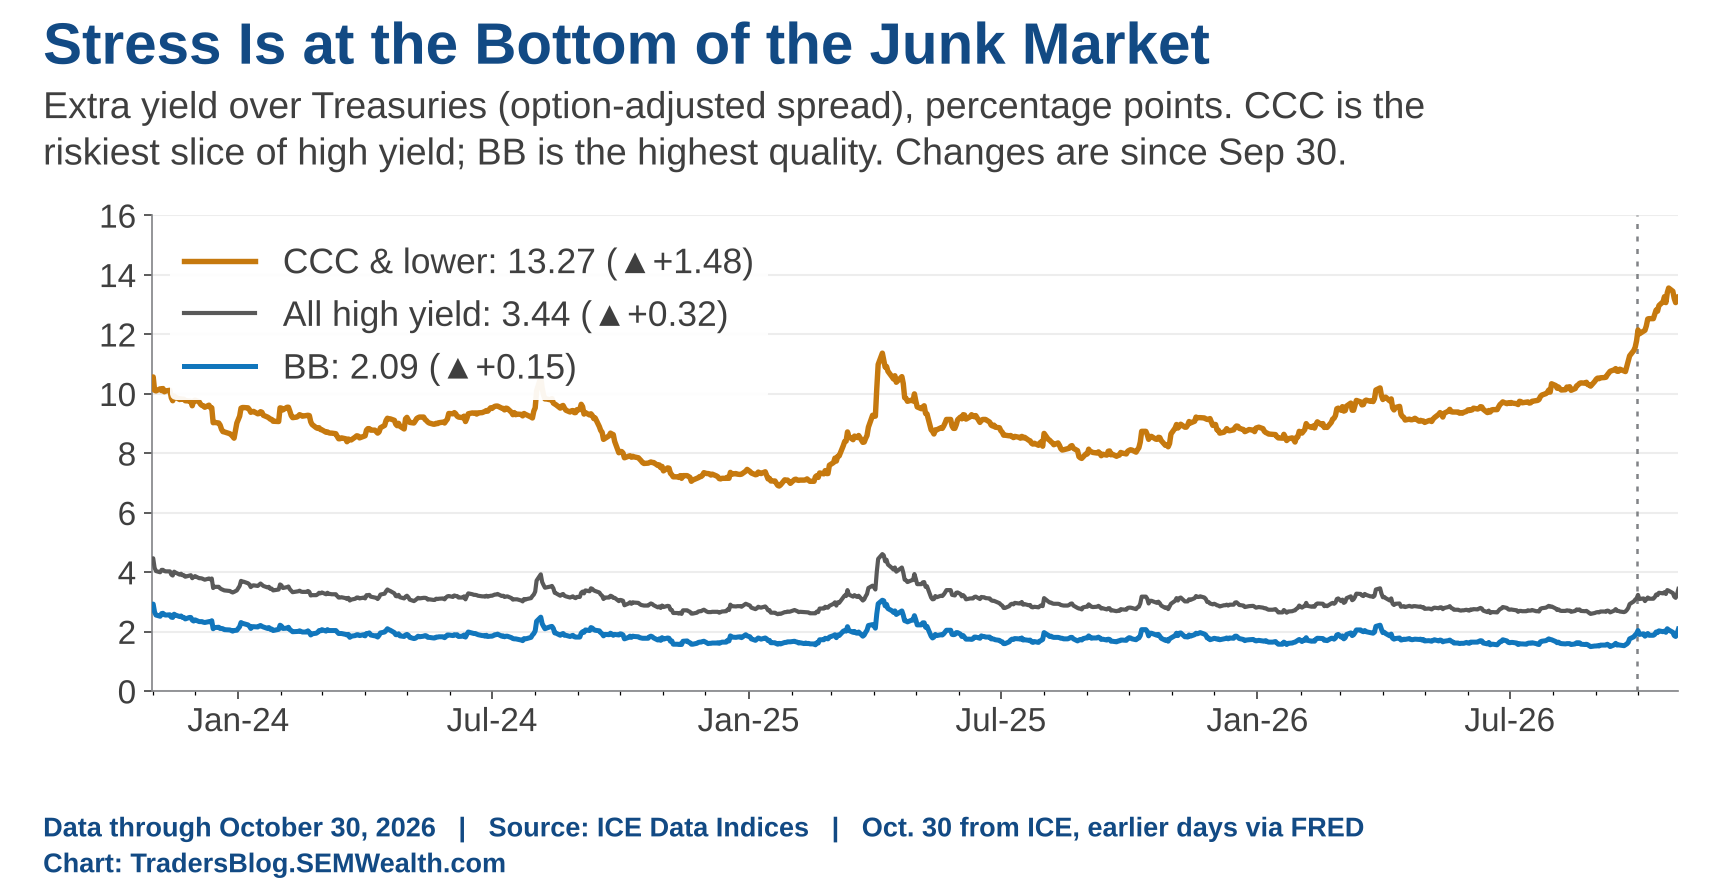
One place I'm watching is the riskiest junk bonds (rated CCC, about 9% of the junk market) which now pay 13.27 percentage points over Treasuries, up from 11.79 at the end of September. The peak last week at 13.56 is the highest spread since at least 2023 and above the long-run average of about 11. Meanwhile the highest-quality junk (BB) spreads only moved up 0.15%, and the overall junk index spread (3.44) is nowhere near our 7.5 warning line. That's stress at the bottom, not across credit.......yet.
13.) A Crypto Hack
Possibly lost in this chaotic week – Binance, the largest crypto exchange, was hacked Thursday through a compromised employee laptop. About $6.3 billion was affected, with about $3 billion was frozen, mostly by the two companies that issue the stablecoins, Tether and Circle. In other words, the "decentralized" money was frozen by two companies. That's custody risk, and it's the opposite of how crypto gets sold as a debasement hedge.
Analysts from TRM Labs and Chainalysis attribute the hack to North Korea. Binance has said it will cover any losses. This is a developing story and one that will be watched closely by the crypto enthusiasts.
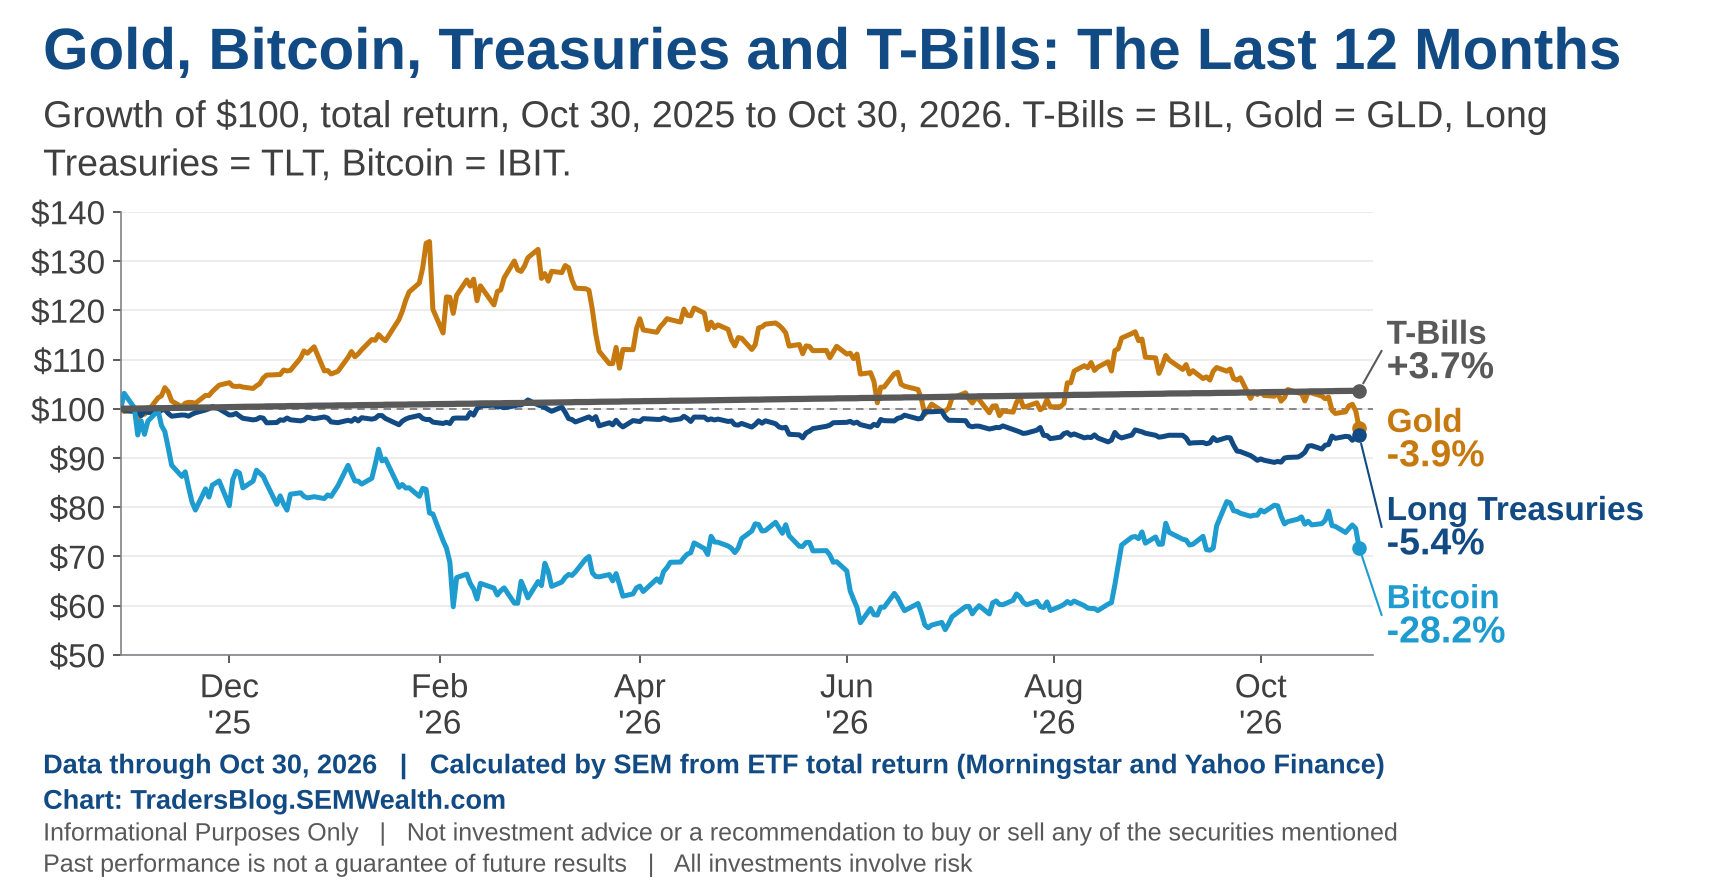
Another casualty last week was gold and silver, which you might expect to be rallying with inflation going up. However, they also hate high real yields and a strong dollar both of which they have right now.
What We're Watching
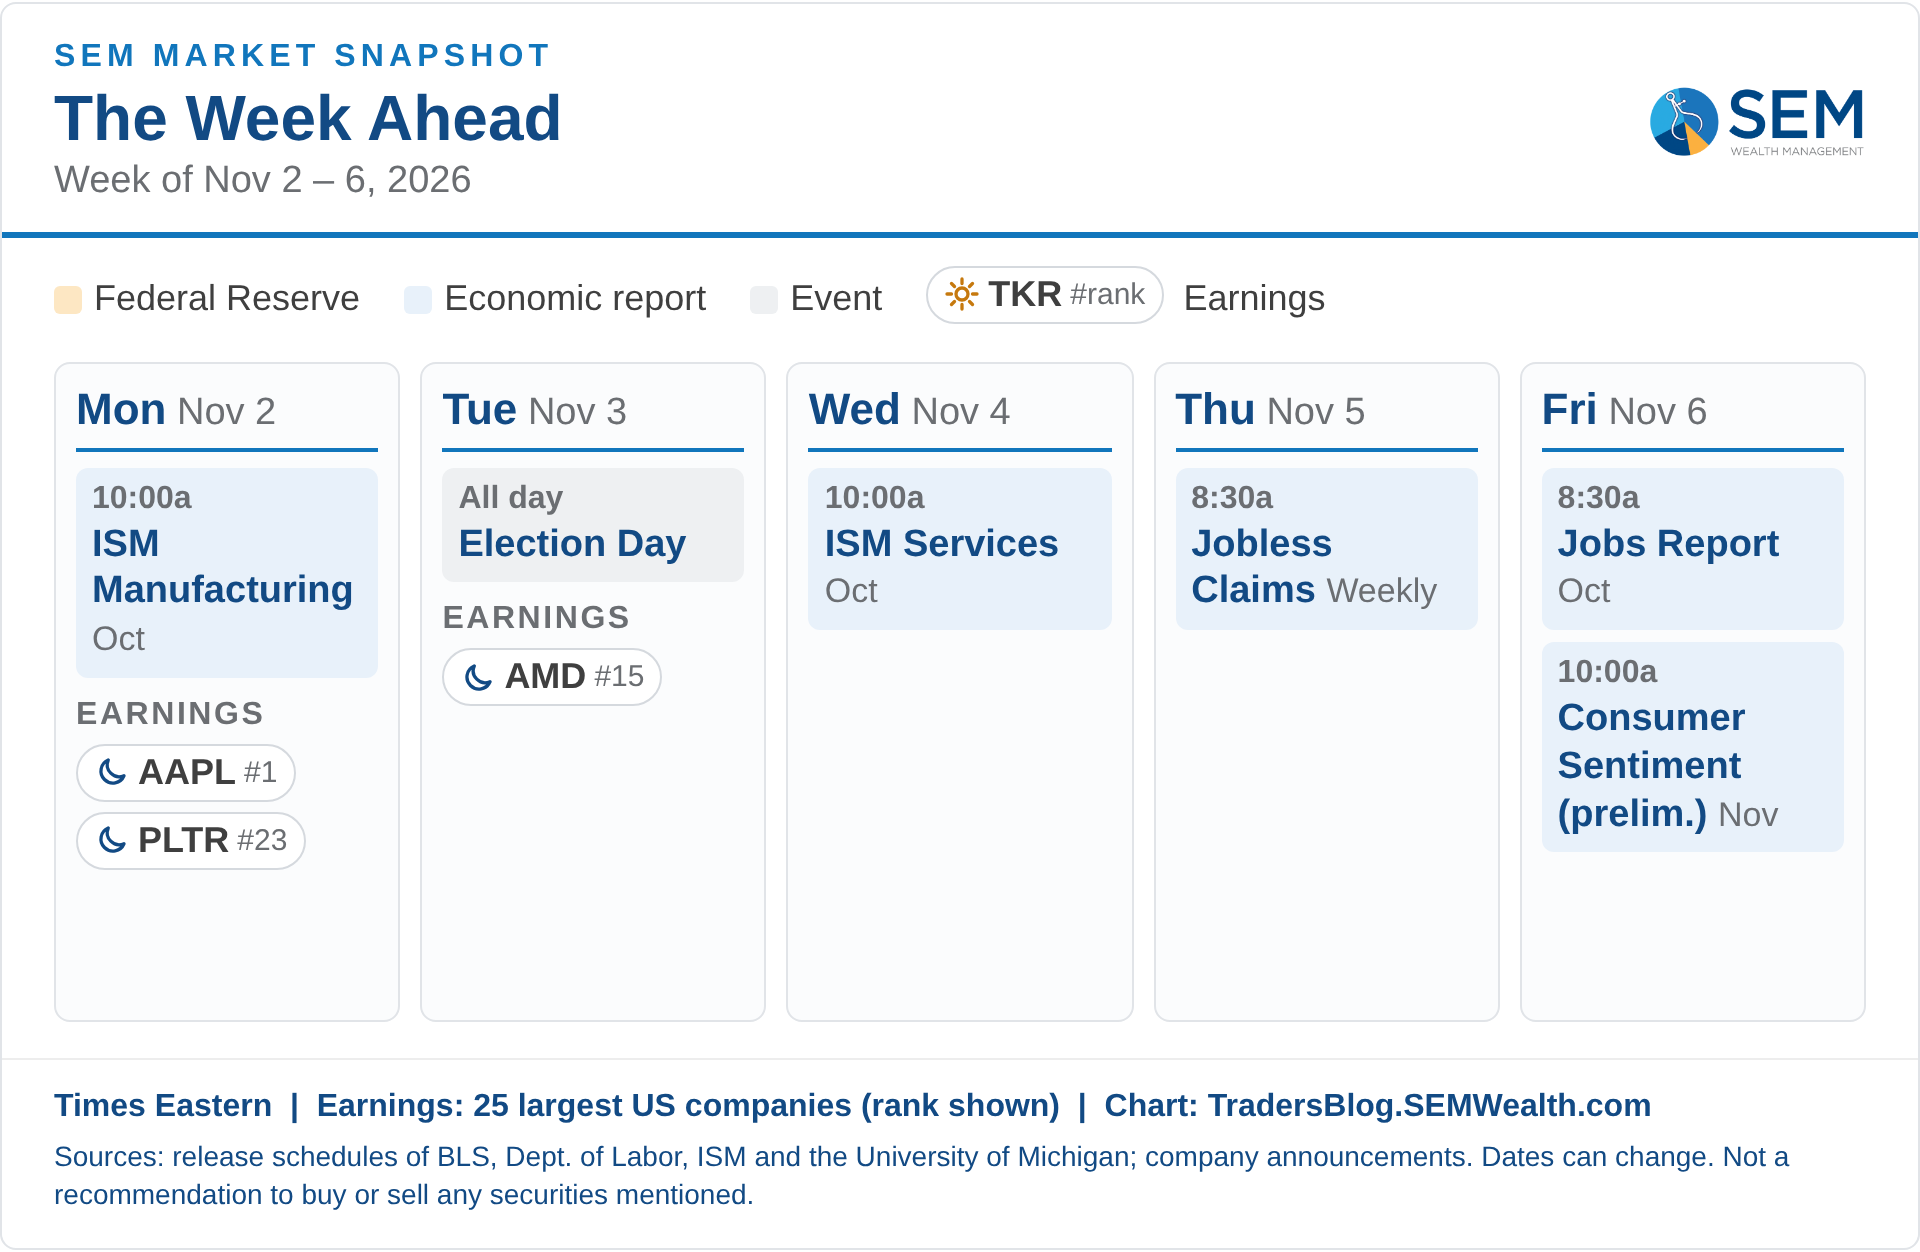
It's going to be a very busy week once again. Here's a quick summary:
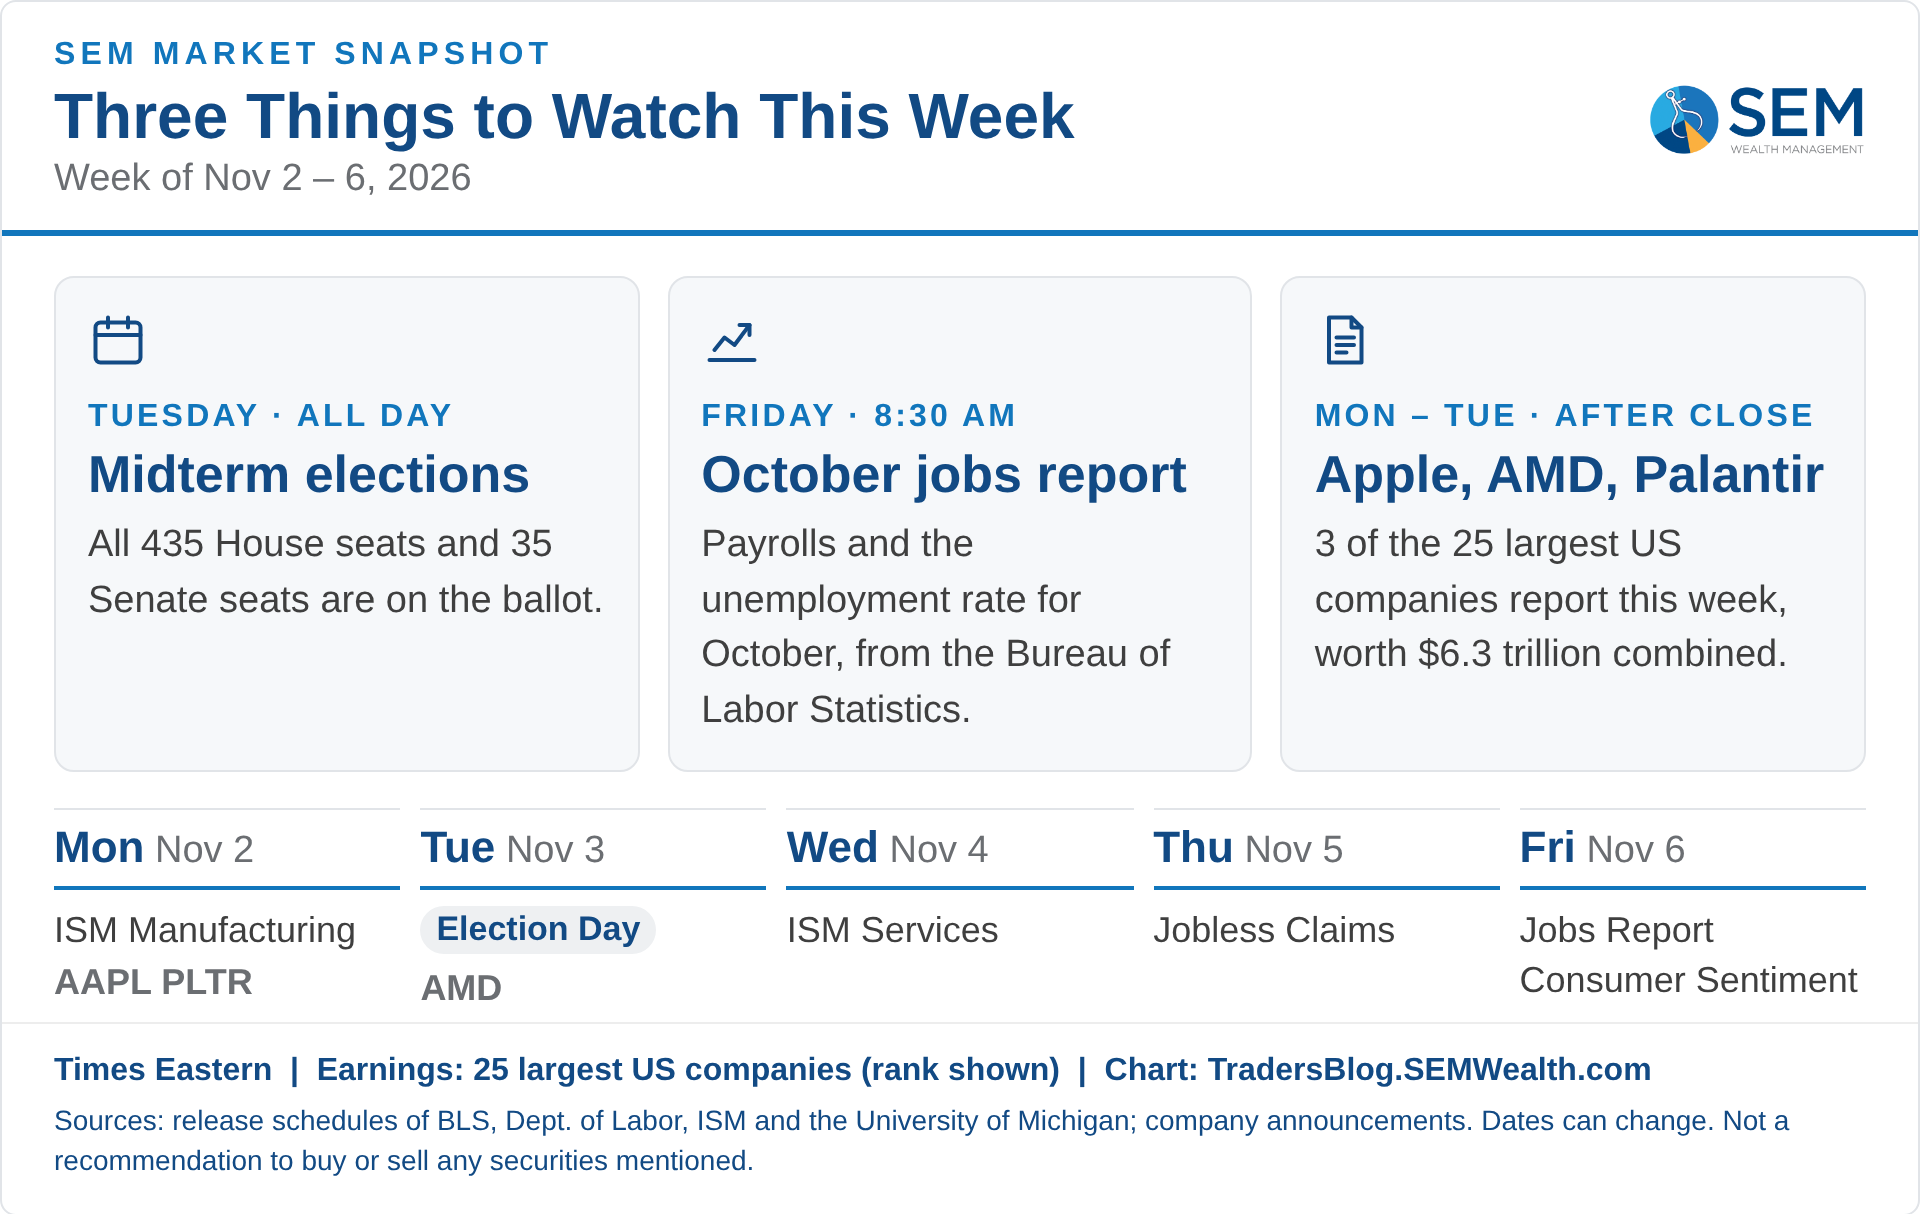
We typically only show the top 25 largest US based companies on the earnings calendar, but there are a few other AI-related earnings reports which might move the markets.
- Tuesday: Arista (data center networking)
- Wednesday: Qualcomm
- Thursday: Cloudflare
Nothing major triggered last week in any of our models, but another week like this past one could lead to some adjustments. As always, we are here watching and adjusting so you don't have to.
Election Update
By: Cody Hybiak
Welcome to the last days of this election cycle! If the constant ads, fear, and anger have left you exhausted, you’re not alone. Even if Tuesday doesn’t go the way you hope, remember this isn’t going to be the end of days. Our country is going to survive, and the emotions those ads are trying to get out of you are likely extremely exaggerated. Also, as Jeff likes to say, "don't let your political opinions influence your investment decisions." Things don't always move the way you might expect!
The Senate is where things will be interesting. The final polls point to an uphill battle for Republicans, with several competitive races putting control of the chamber in play. But we have to be careful about treating polls as results. We still need to count the votes. Some states could take longer, but that doesn’t mean something fishy is going on. In case you missed it, last Friday I posted a blog walking through the key races, the best-case scenarios for both parties, and where I think the results could land.
 Cody Hybiak


Where AI Risk Really Sits in Your Portfolio
Five charts follow AI's trillion-dollar bet from Big Tech's balance sheets to Americans' retirement savings and the job market.
A question we hear more and more from investors: is AI a bubble, and what would happen to my portfolio if it popped? This week we look at Brace for Impact, a new report from the Open Markets Institute and Americans for Financial Reform Education Fund. Both are policy advocacy groups, so we read their conclusions with that in mind. The data they pull together, much of it from mainstream sources like Goldman Sachs, Moody's and company filings, still deserves attention.
The authors don't predict a crash, and neither do we. Their argument is that the conditions for a painful one are in place. Our short version: there is no reason to panic, but there is good reason to check how much of your portfolio depends on AI. The five charts below show where the risk sits and who would feel it.
1. The market has never been this big
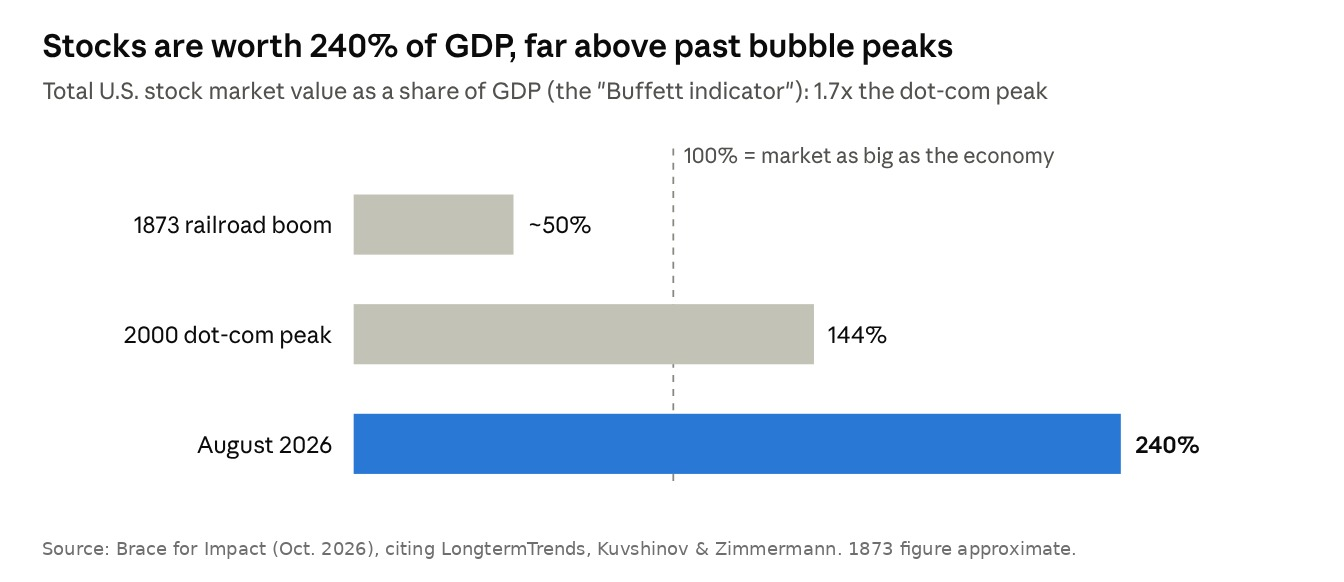
By this classic yardstick, U.S. stocks have never been more expensive relative to the economy. On its own that isn't a timing signal, since the ratio can stay high for years. What concerns us more is concentration. The ten largest S&P 500 companies now make up about 40% of the index, up from 16% a decade ago, and nine are tech firms. An investor in a plain S&P 500 index fund has more riding on AI than they may realize.
2. Spending is racing ahead of revenue
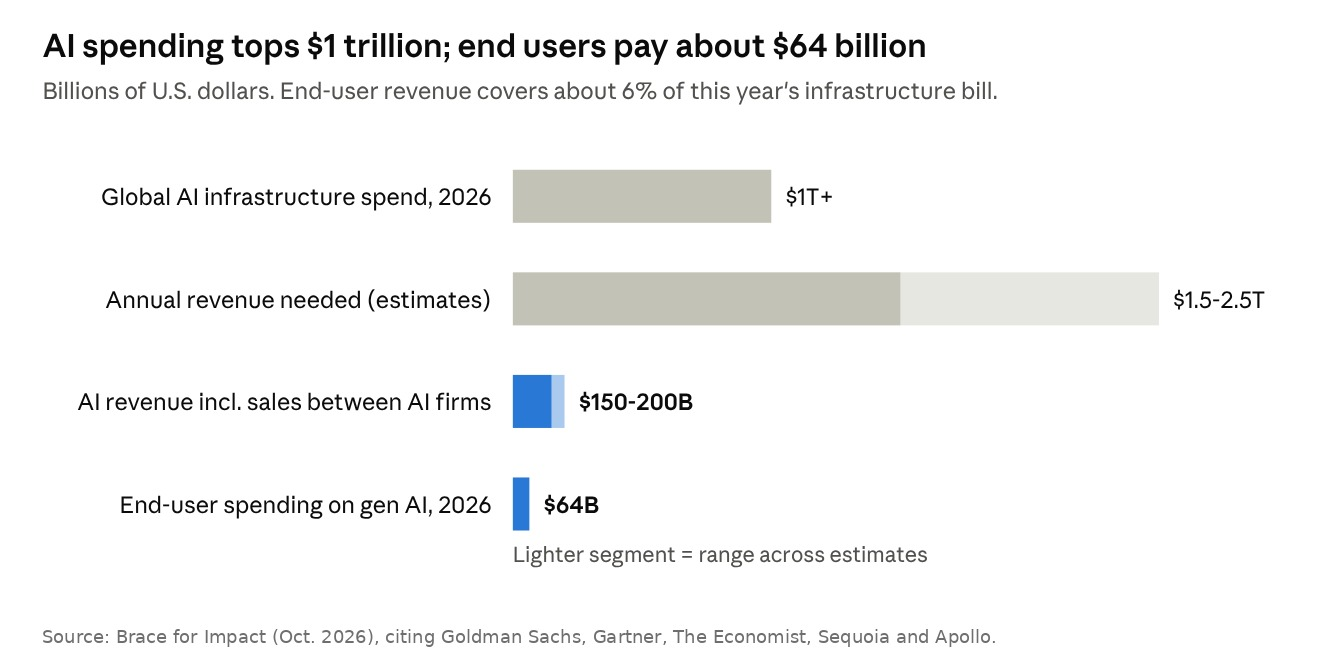
This is the core question for AI investors: will the revenue arrive in time? The four largest "hyperscalers," the cloud giants Alphabet, Amazon, Meta and Microsoft that build AI data centers, expect to spend $745 billion on capital projects this year, five times their 2023 level. The report estimates that revenue from customers outside the AI industry covers at most 20% of that, and possibly under 10%.
Much of the rest is "circular": AI companies investing in each other, then booking each other's purchases as sales. That flatters reported growth, and it is something we watch closely in earnings reports.
3. Most of the debt is off the books
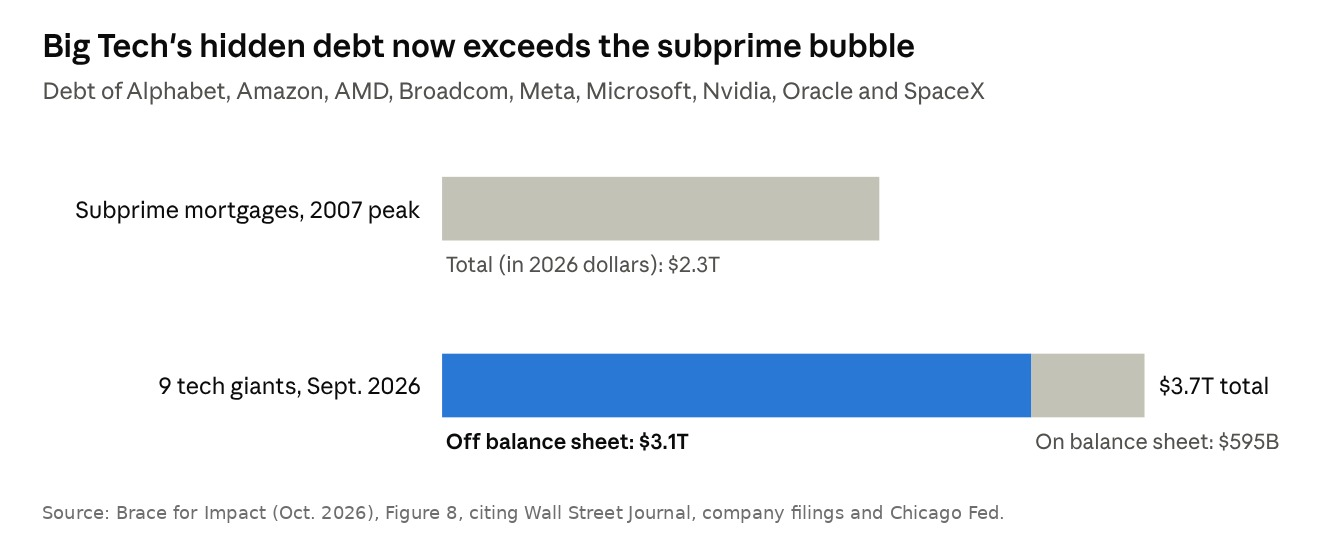
For investors, this chart may be the one that matters most. Much of the industry's obligations are future lease and chip-purchase commitments, or loans held in separate entities, so they don't appear as debt on balance sheets. The report says most can't be cancelled. With free cash flow at the four largest hyperscalers projected to turn negative by early 2027, companies long prized for generating cash are leaning more on borrowing.
4. Life insurers, and the retirees behind them, are loading up
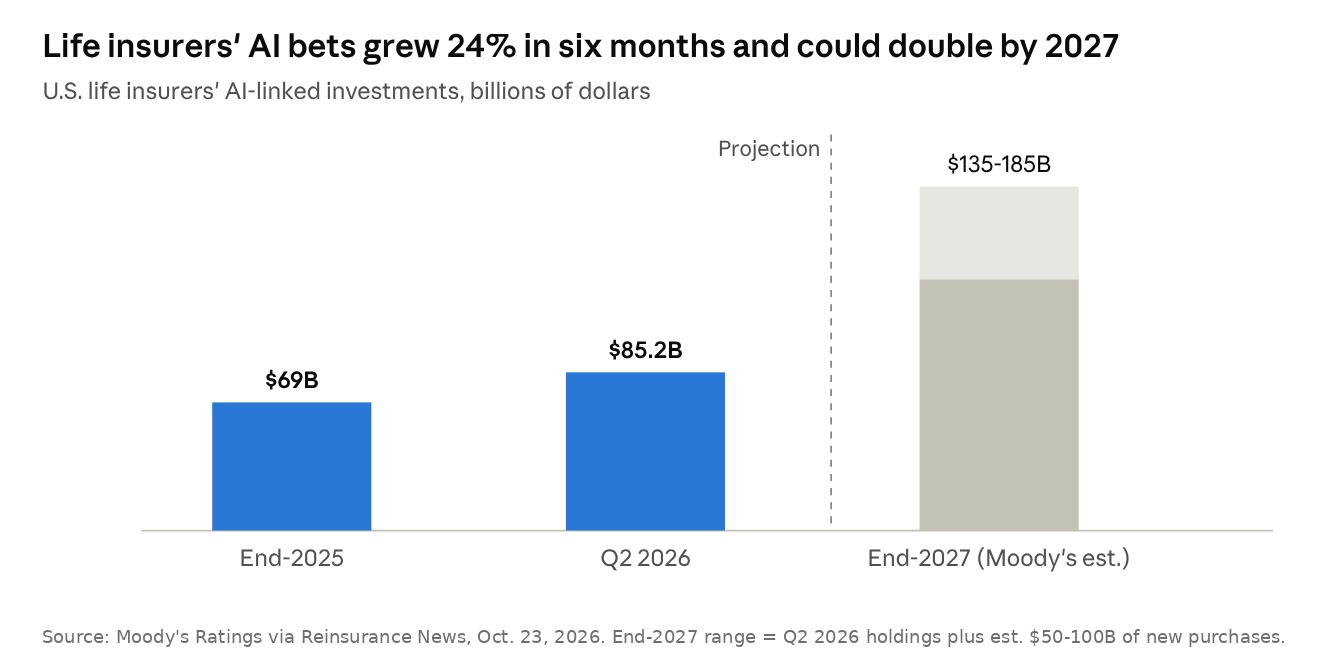
One of the report's biggest concerns is how AI debt has spread beyond tech. A Moody's analysis reported by Reinsurance News on October 23 measures part of it. U.S. life insurers held about $85.2 billion in AI-linked investments at mid-year, and Moody's expects another $50 billion to $100 billion by the end of 2027.
The fastest growth is in the riskier segment. Data center and other digital infrastructure debt rose 34% to $39.5 billion, and the share rated below investment grade rose from 4.7% to 6.1%. Insurers also hold $32.2 billion of bonds from Alphabet, Amazon, Meta, Microsoft and Oracle, with Oracle the largest position at about $10 billion.
In context, that is about 1.4% of insurers' assets, and Moody's calls it modest. We agree it is not a solvency threat today. But Moody's cautions that its figures may understate exposure held through separate legal entities, joint ventures and leases. It puts the five tech firms' off-balance-sheet commitments at $2.8 trillion, broadly in line with the report's $3.1 trillion for nine firms.
Why this matters to you: life insurers back many of the annuities retirees rely on for income. Brace for Impact notes that about 20% of their fixed-income assets are already in private, illiquid bonds, and the state guaranty system for failed insurers is slow and capped. If you own an annuity, the issuer's credit quality deserves the same scrutiny as any bond in your portfolio.
5. AI is already reshaping the job market
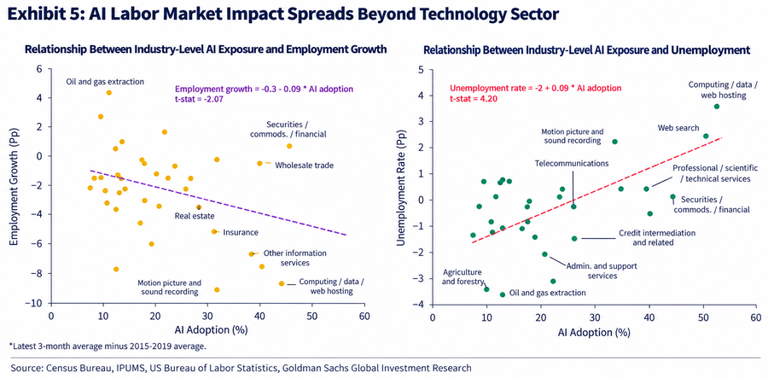
This Goldman Sachs exhibit turns to the labor market. Each dot is an industry. Industries with higher AI adoption have seen weaker hiring and higher unemployment than their 2015-2019 norms. Computing and web hosting is the extreme case: AI adoption above 50%, employment down about 9 points and unemployment up about 3.5 points.
We would read this with caution. The link to unemployment is statistically strong, the link to hiring is weaker, and correlation is not causation. Tech and finance were also hit by higher rates and post-pandemic over-hiring.
Still, the combination is worth noting. The report finds little evidence so far that AI is lifting productivity, and some firms, Klarna among them, have rehired staff they replaced with chatbots. If AI-exposed industries cut jobs before the productivity gains show up, household spending could soften just as a market correction dents household wealth.
What this means for investors
First, the case for calm. Many on Wall Street see an investment super-cycle rather than a bubble, and the IMF's chief economist has argued a downturn would likely stay contained. Unlike the dot-com startups, today's hyperscalers have large, profitable businesses outside AI. And transformational technologies have often delivered lasting value even after their bubbles burst.
Still, the report's central worry deserves respect: contagion. AI-linked debt now runs through private credit funds, life insurers and pension funds, and about a third of household wealth sits in stocks, a record share. The authors call for more disclosure, tighter accounting and no bailouts.
What we're watching:
- Revenue vs. spending: whether AI revenue from outside the industry starts to close the gap with capital spending.
- Hyperscaler cash flow: whether free cash flow turns negative and borrowing accelerates, as projected for early 2027.
- Credit spreads: the extra yield lenders demand, especially on data center debt, Oracle and private credit funds, where stress would likely show first.
- Interest rates: the Fed's first hike since 2023 raises costs for borrowers who need to refinance.
We aren't calling a top, and trying to time one is rarely rewarded. But these numbers argue for discipline: knowing how much of a portfolio rides on a handful of AI names, holding diversification that doesn't depend on a single theme, and staying selective on credit quality in bond and annuity holdings.
At SEM, we believe your time is best spent focused on what matters most to you, not on keeping up with the complexities, evolving regulations, and latest trends shaping the financial markets. With SEM as your trusted advisor, we take on that responsibility through a disciplined, research-driven investment process designed to identify opportunities, manage risks, and adapt to changing market conditions. If you'd like to know how exposed your own portfolio is, or how we approach these risks, we'd welcome a conversation.
Source: Scherer, M. and Jenkins, M., Brace for Impact: Protecting People and the Economy When the AI Bubble Bursts, Open Markets Institute and Americans for Financial Reform Education Fund, October 2026. Section 4: Moody's Ratings, via Reinsurance News, October 23, 2026. Section 5 exhibit: Goldman Sachs Global Investment Research.
This commentary is for informational purposes only and is not a recommendation to buy or sell any security. Views are as of the date shown and may change. Past performance does not guarantee future results.
Jeff’s Note: George and I read the same report, and on the core story we see it the same way – Moody’s $2.8 trillion of off-balance-sheet commitments is right in the neighborhood of the $2.76 trillion our AI dashboard counts in the footnotes (point #3 above), and the circular deals are what our “Everchanging” post and its AI Network Stress Test have been mapping. The report’s finding that AI hasn’t shown up in productivity yet fits what we’ve said in our AI presentation (the payoff comes after the infrastructure is built), not to mention my own experience in last week’s “Does AI make me more productive?” post.
Where we differ is on how far the damage spreads. In our stress test the losses mostly stay with the smaller, debt-funded builders and their lenders, and even when OpenAI fails and takes Oracle down with it, none of the big four fail, so “when the bubble bursts” is more dire than anything our numbers show right now (the dashboard is still four yellow, one green, no red). To be fair to the report, our tool treats banks and private credit as shock absorbers rather than modeling them failing, so it can’t rule out the kind of spillover the authors are worried about. And on cash flow the report may actually be a little LATE – it has hyperscaler free cash flow turning negative by early 2027, while three of the four already got there last quarter (over the past 12 months, only Amazon has).
The most important point is that neither George’s view nor mine drives what we do in your clients’ portfolios – those decisions come from our quantitative systems, which only look at data coming out of the market, not fundamentals or anybody’s opinion (including ours).
Market Data
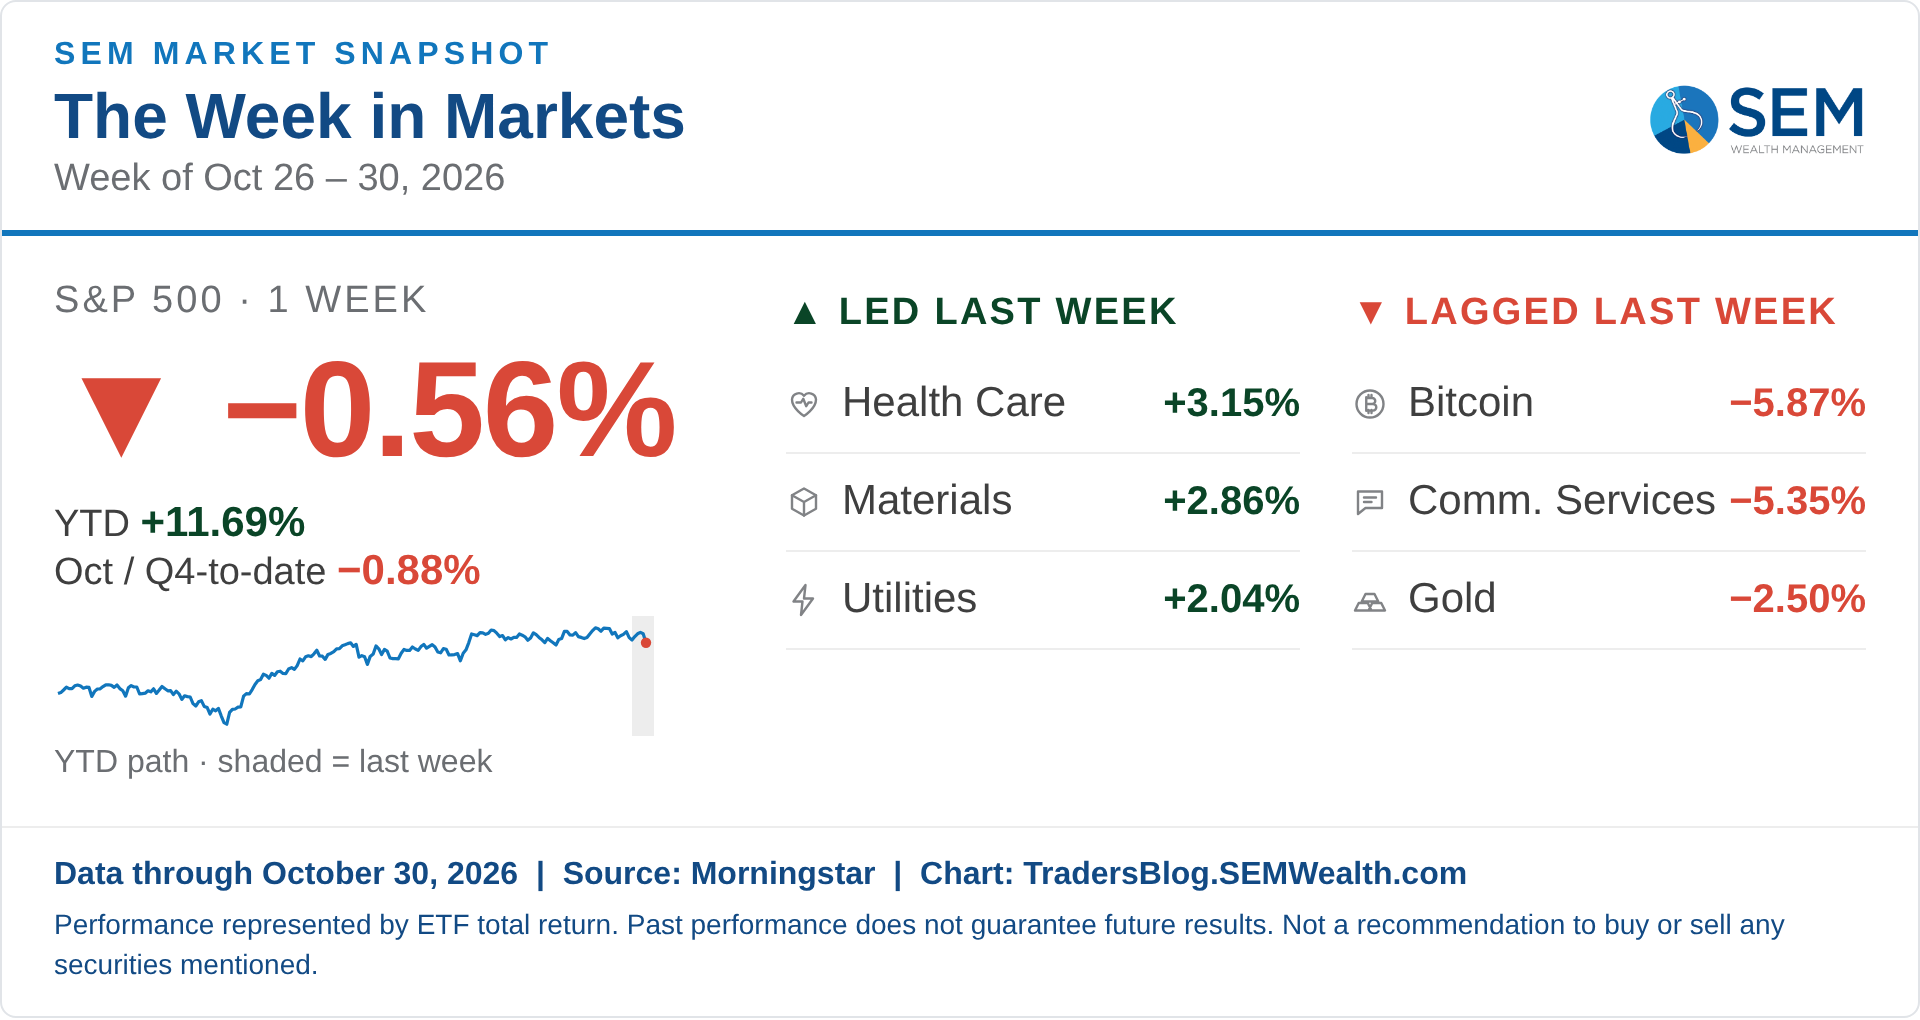
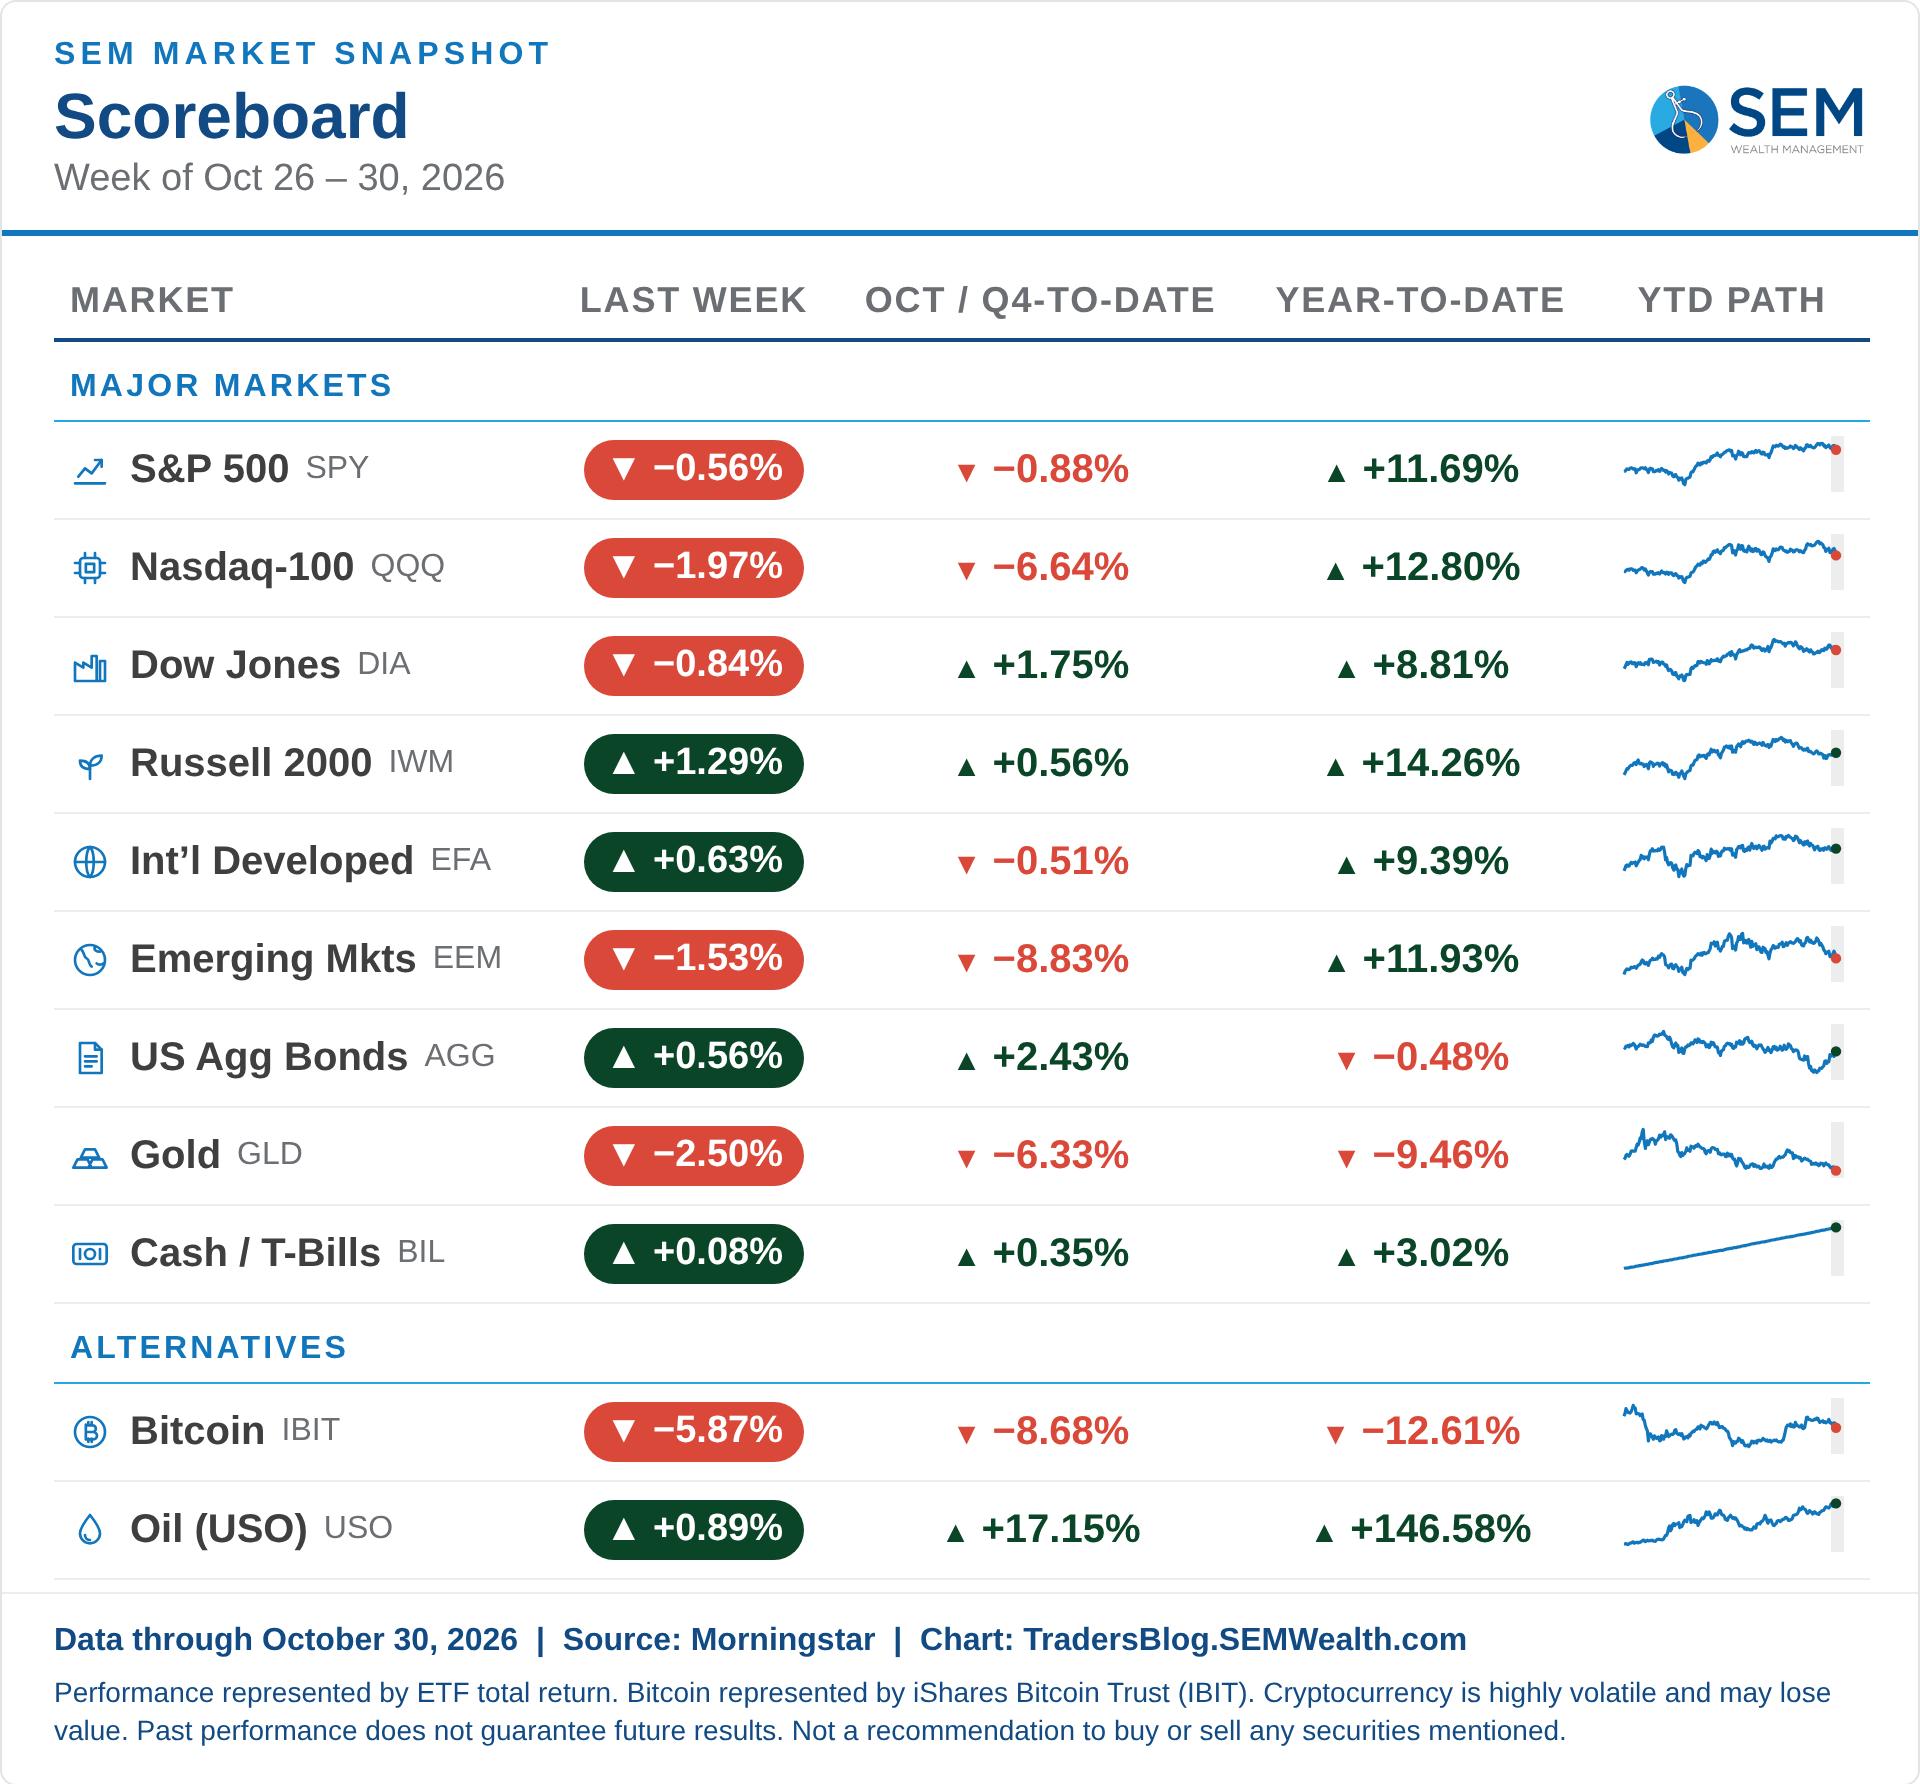
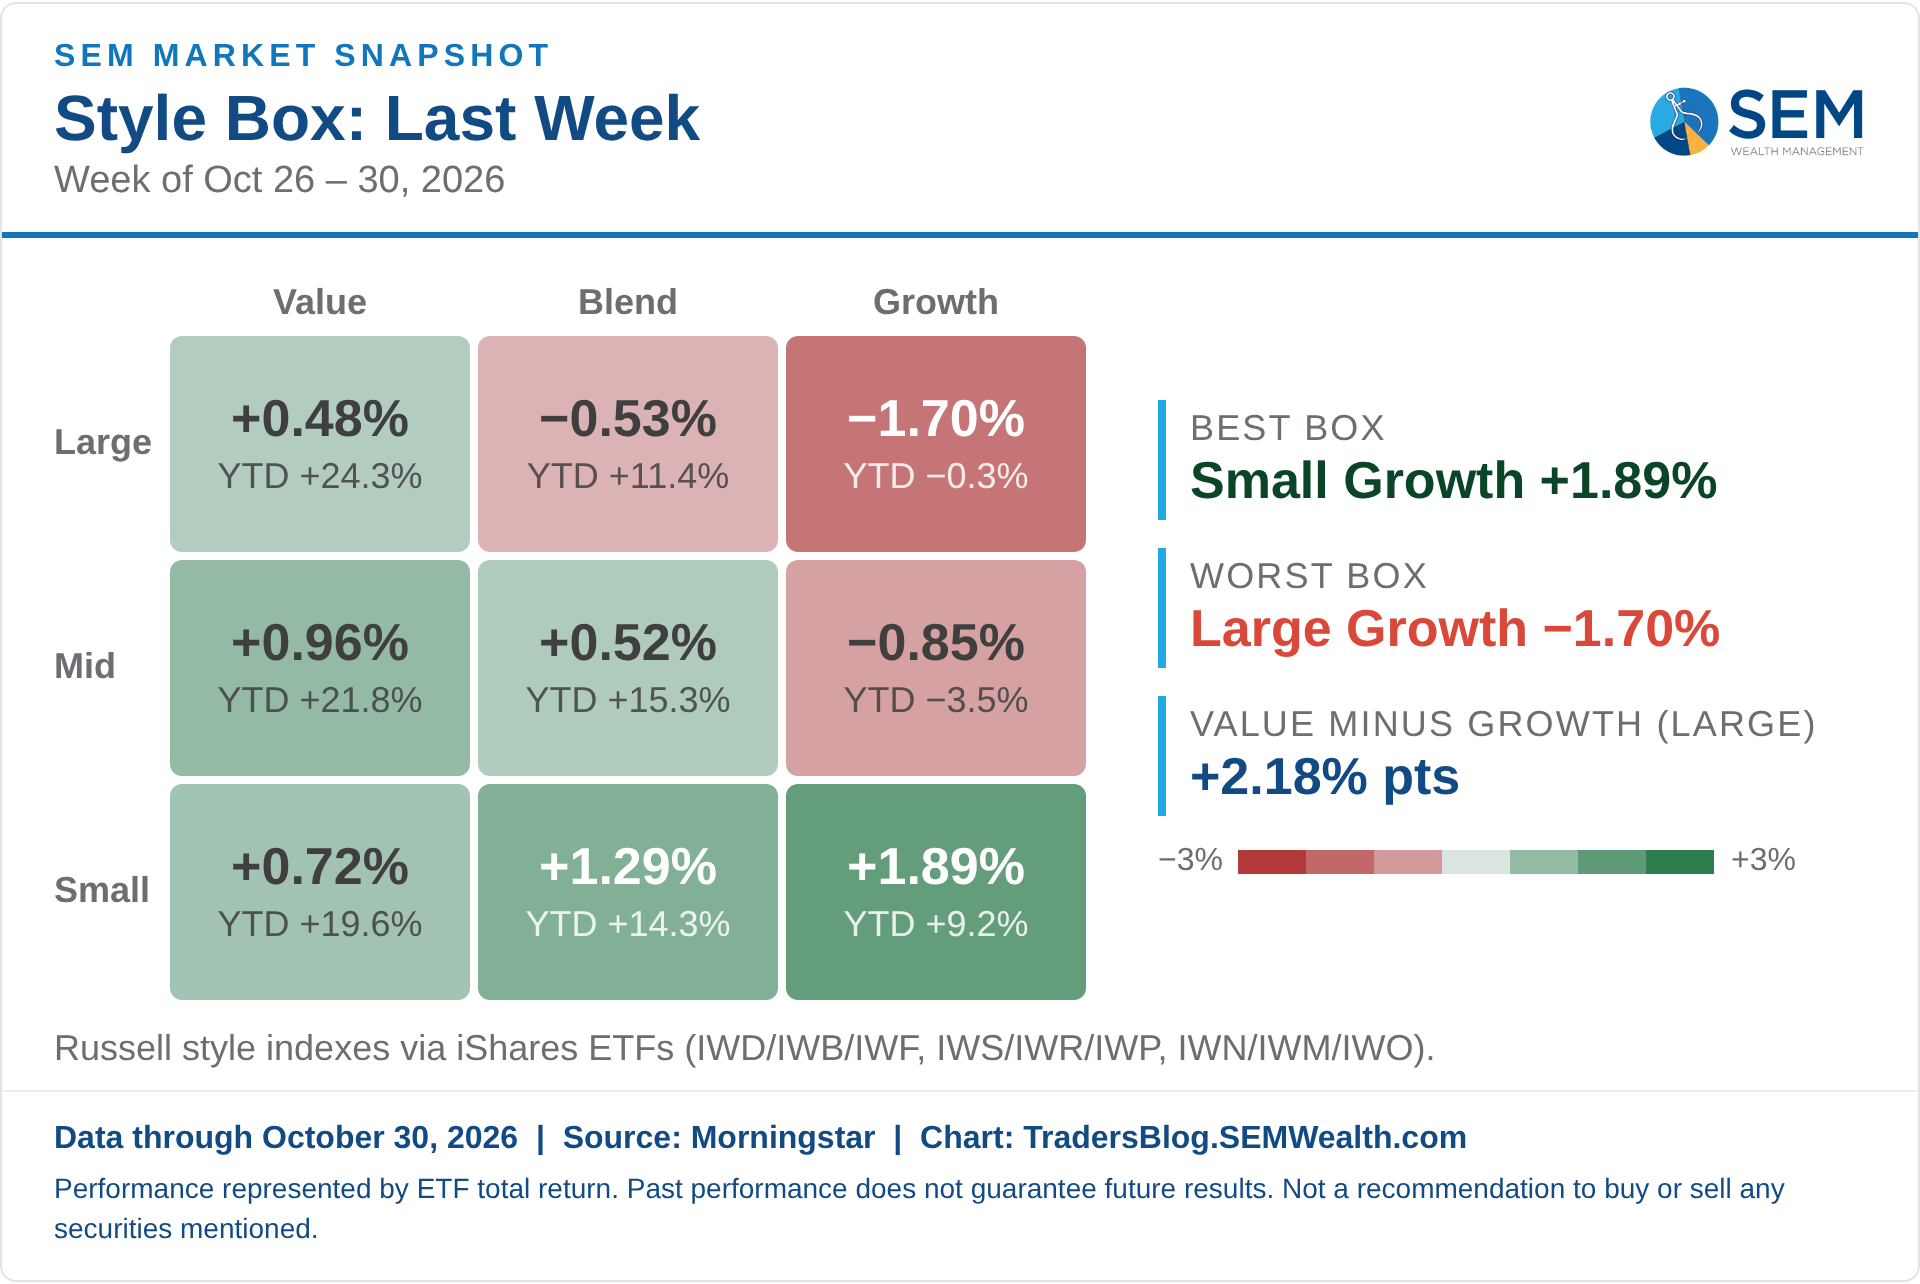
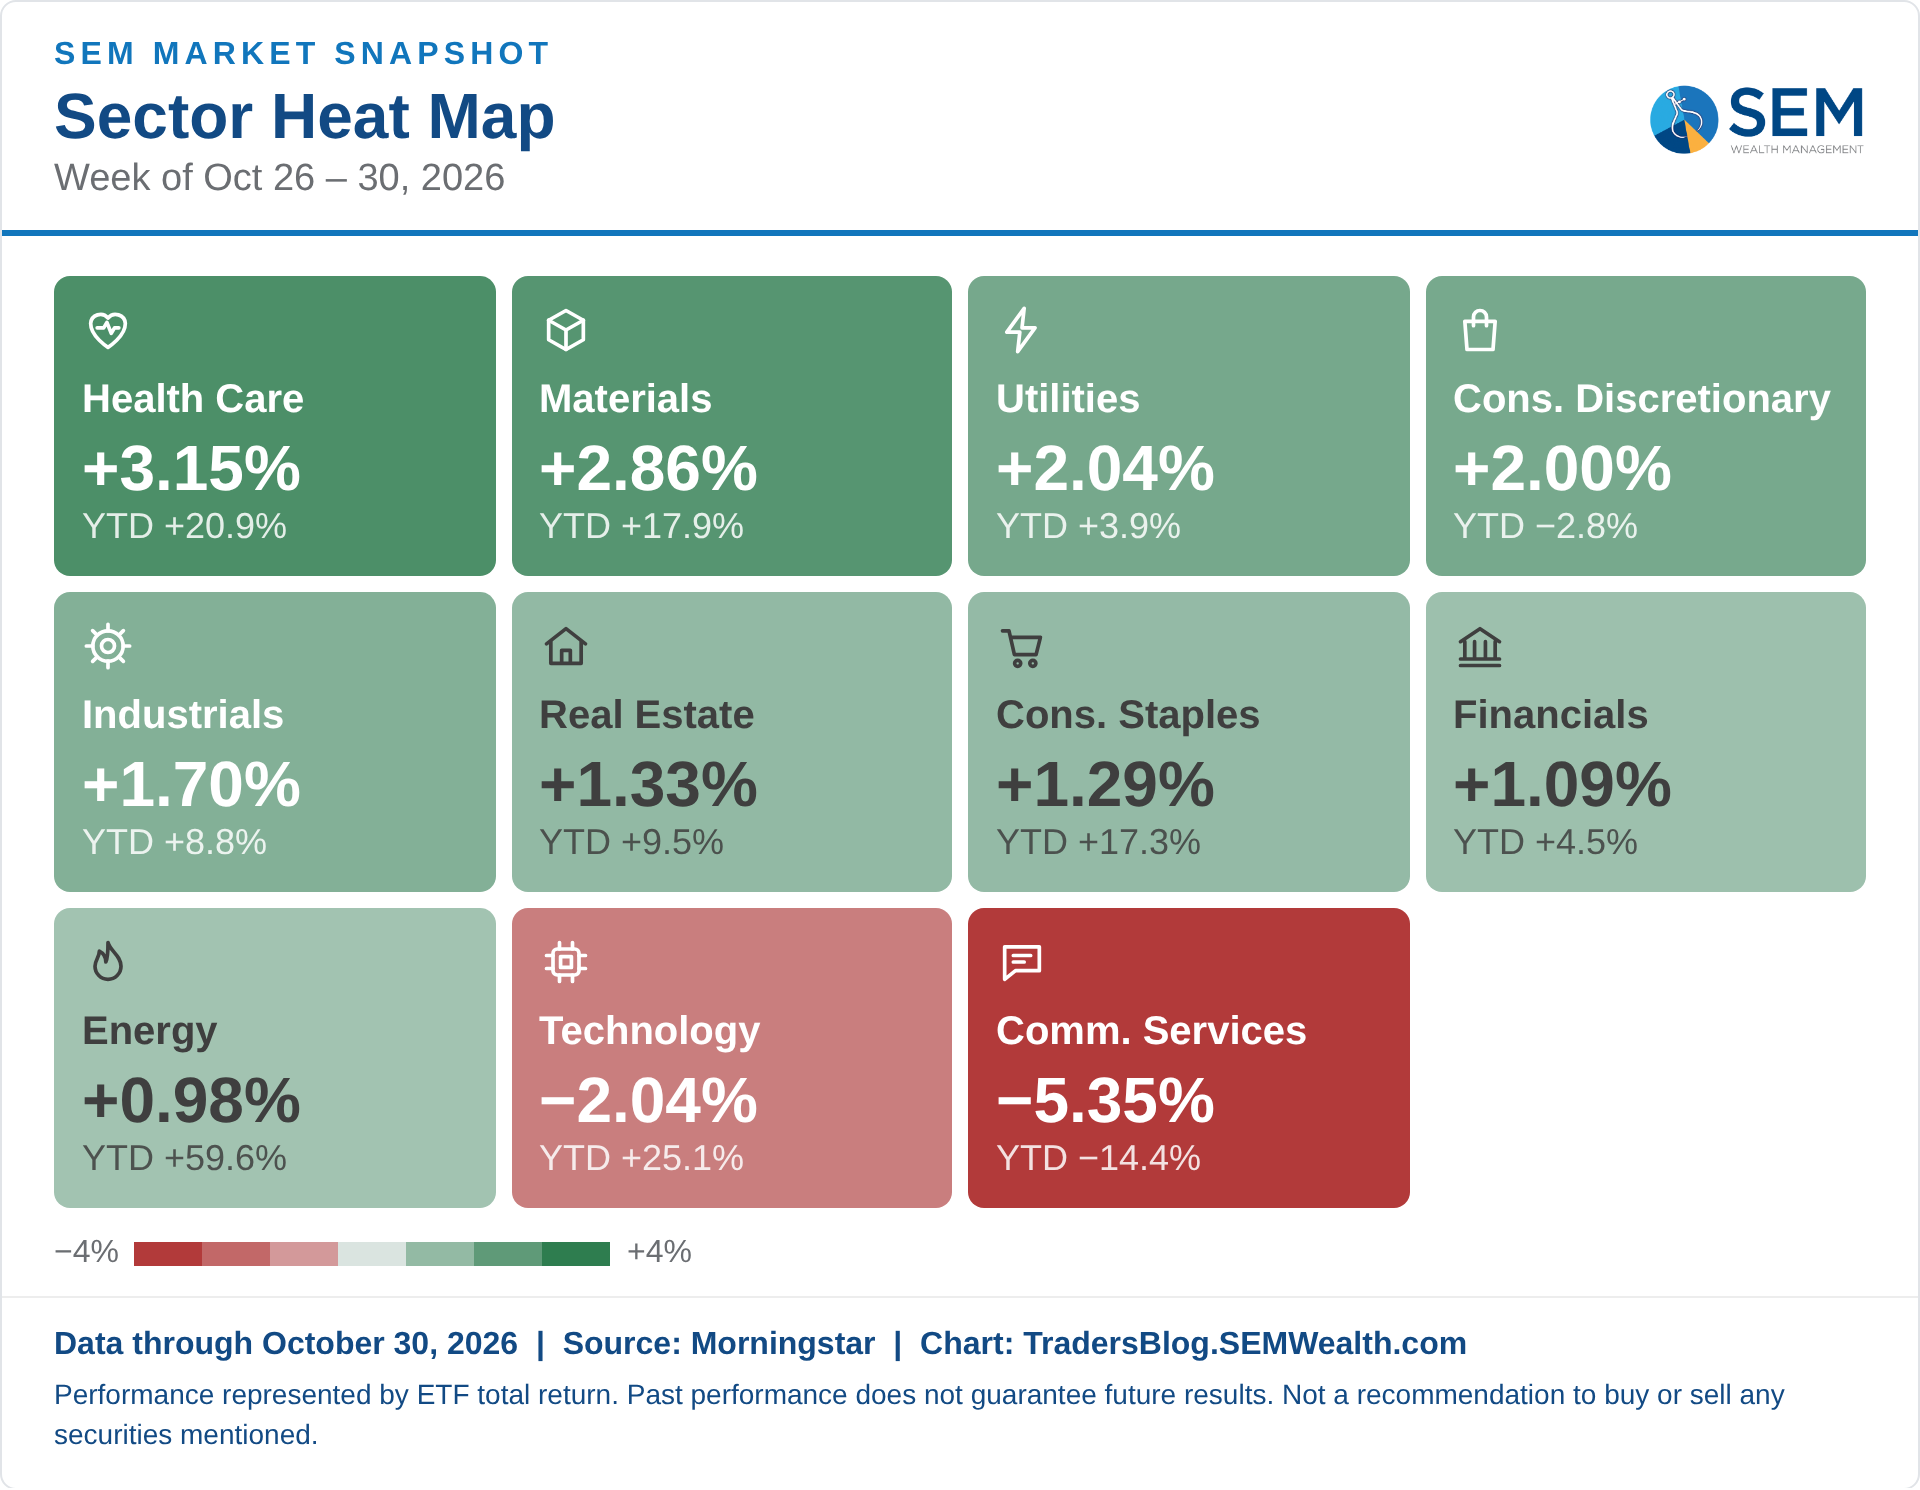
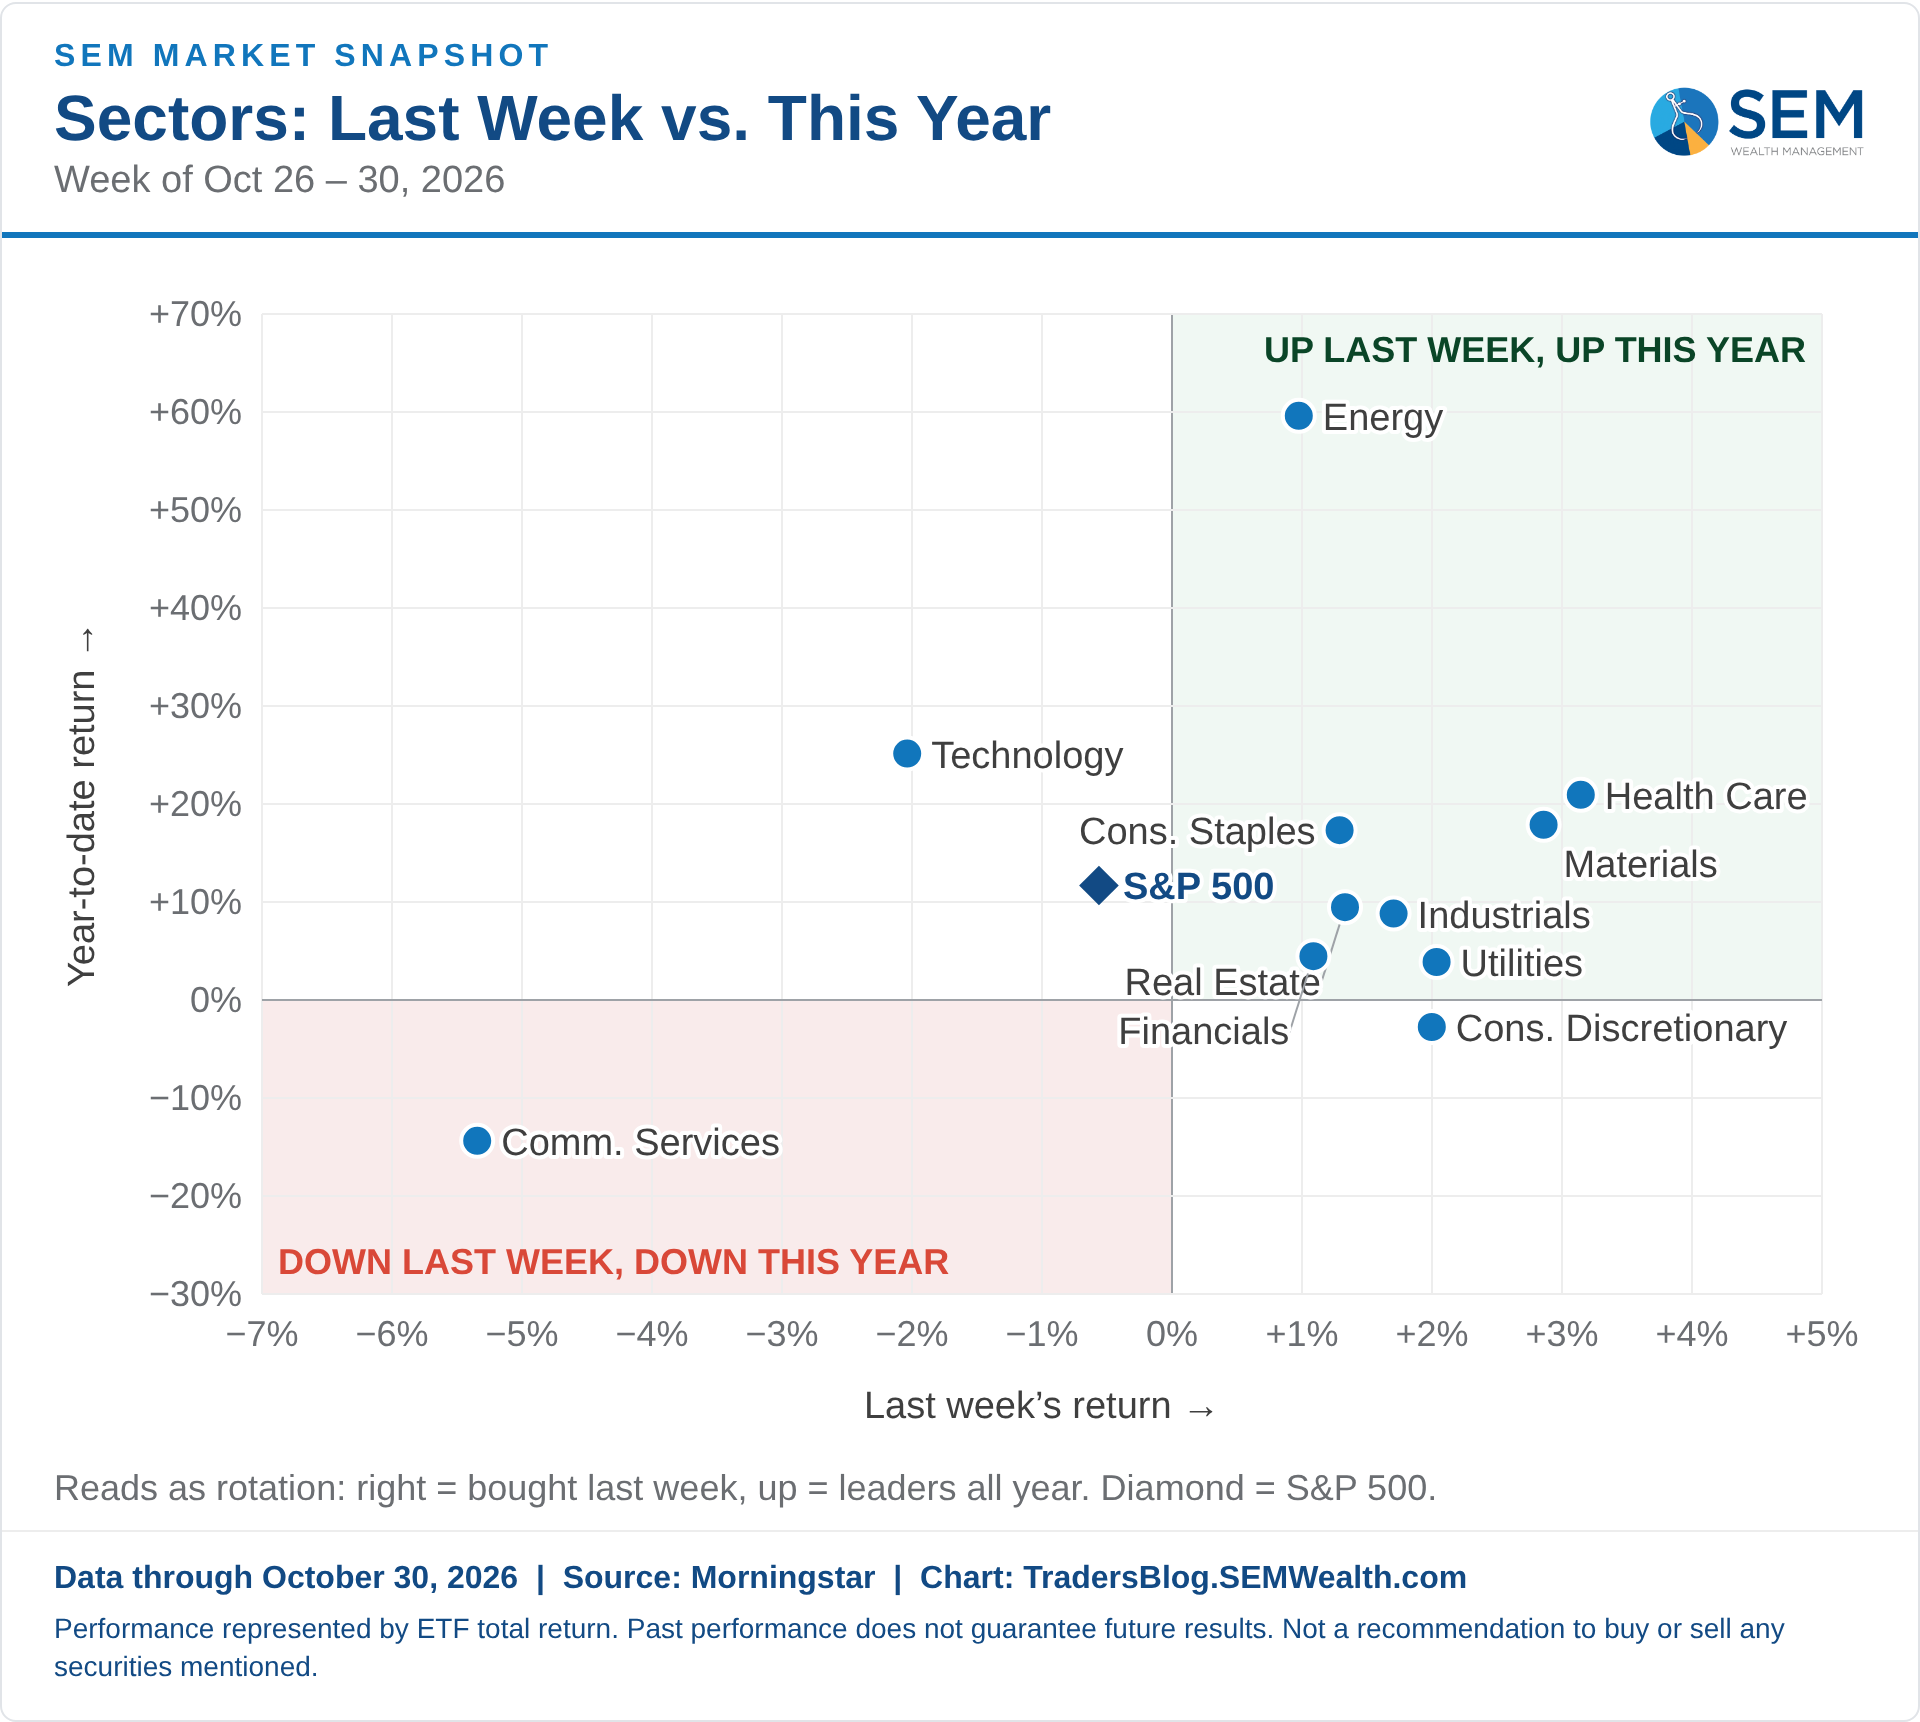
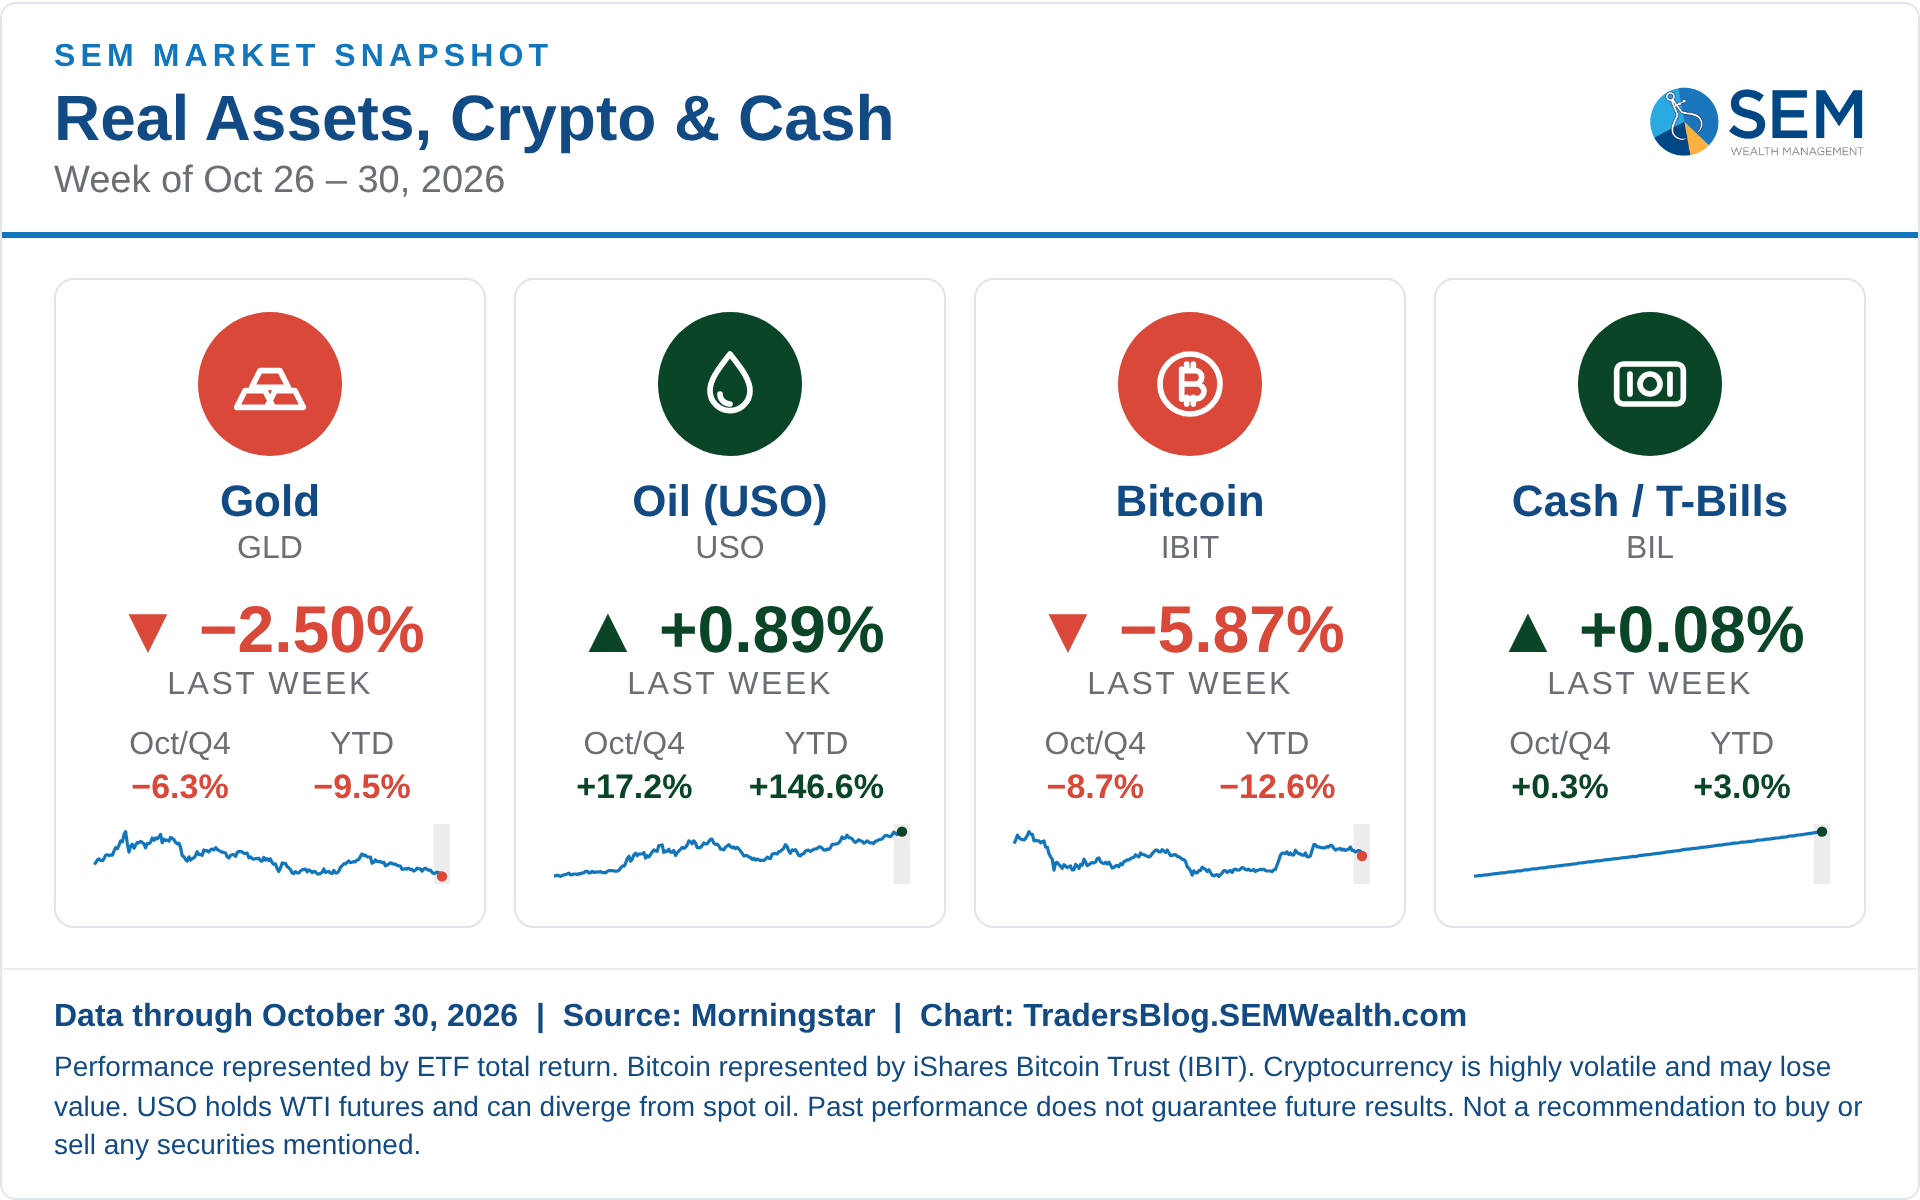
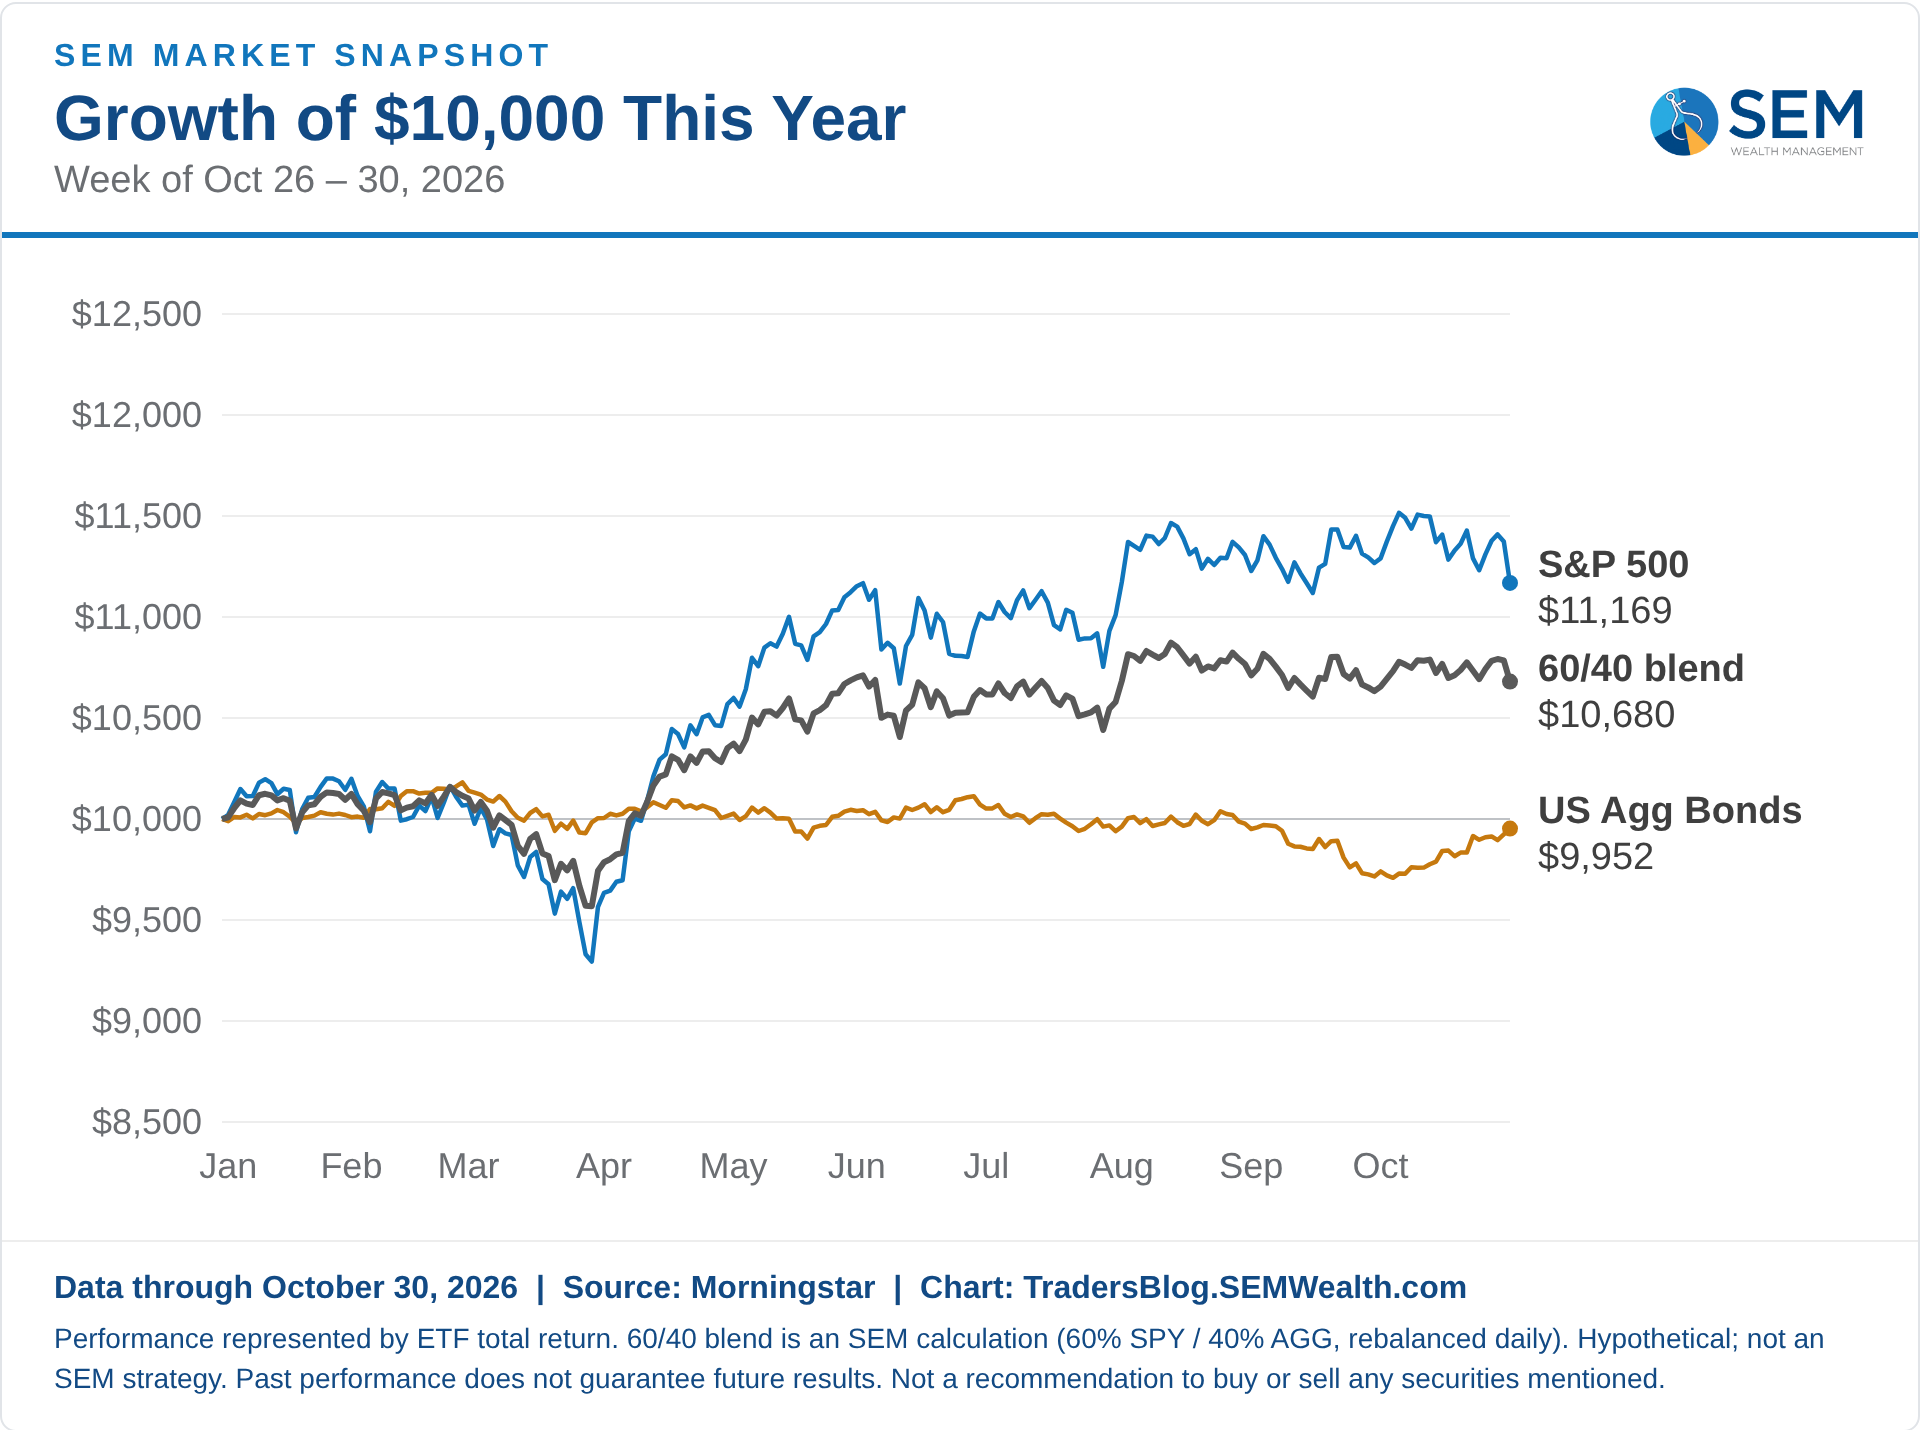
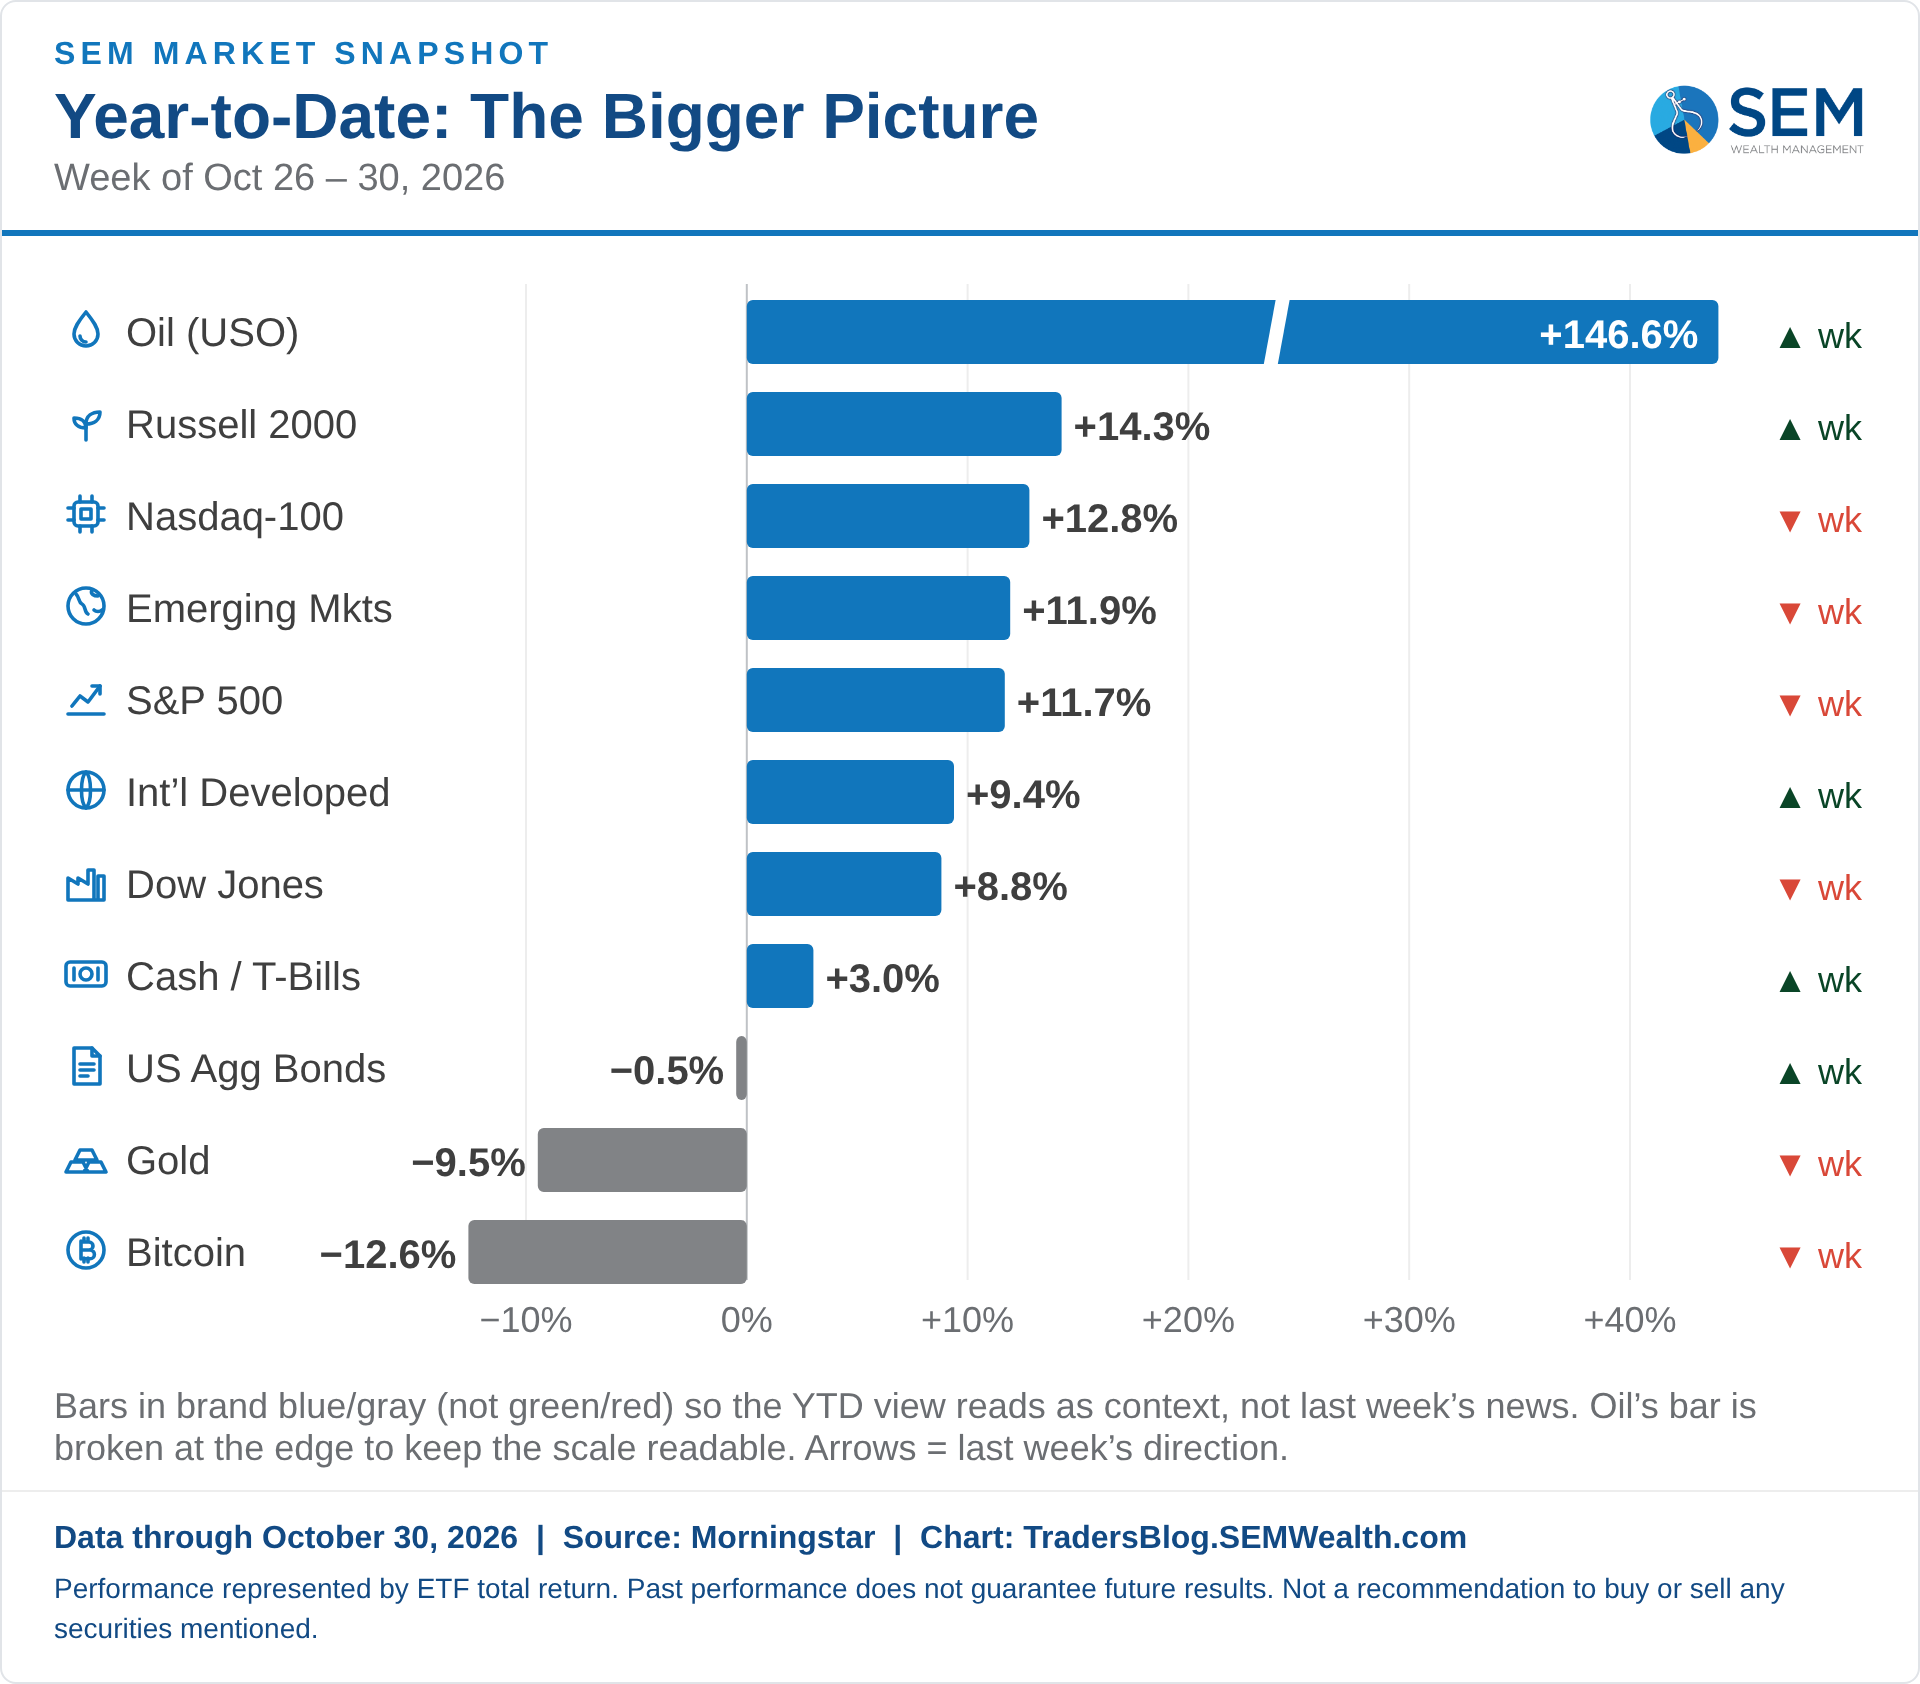
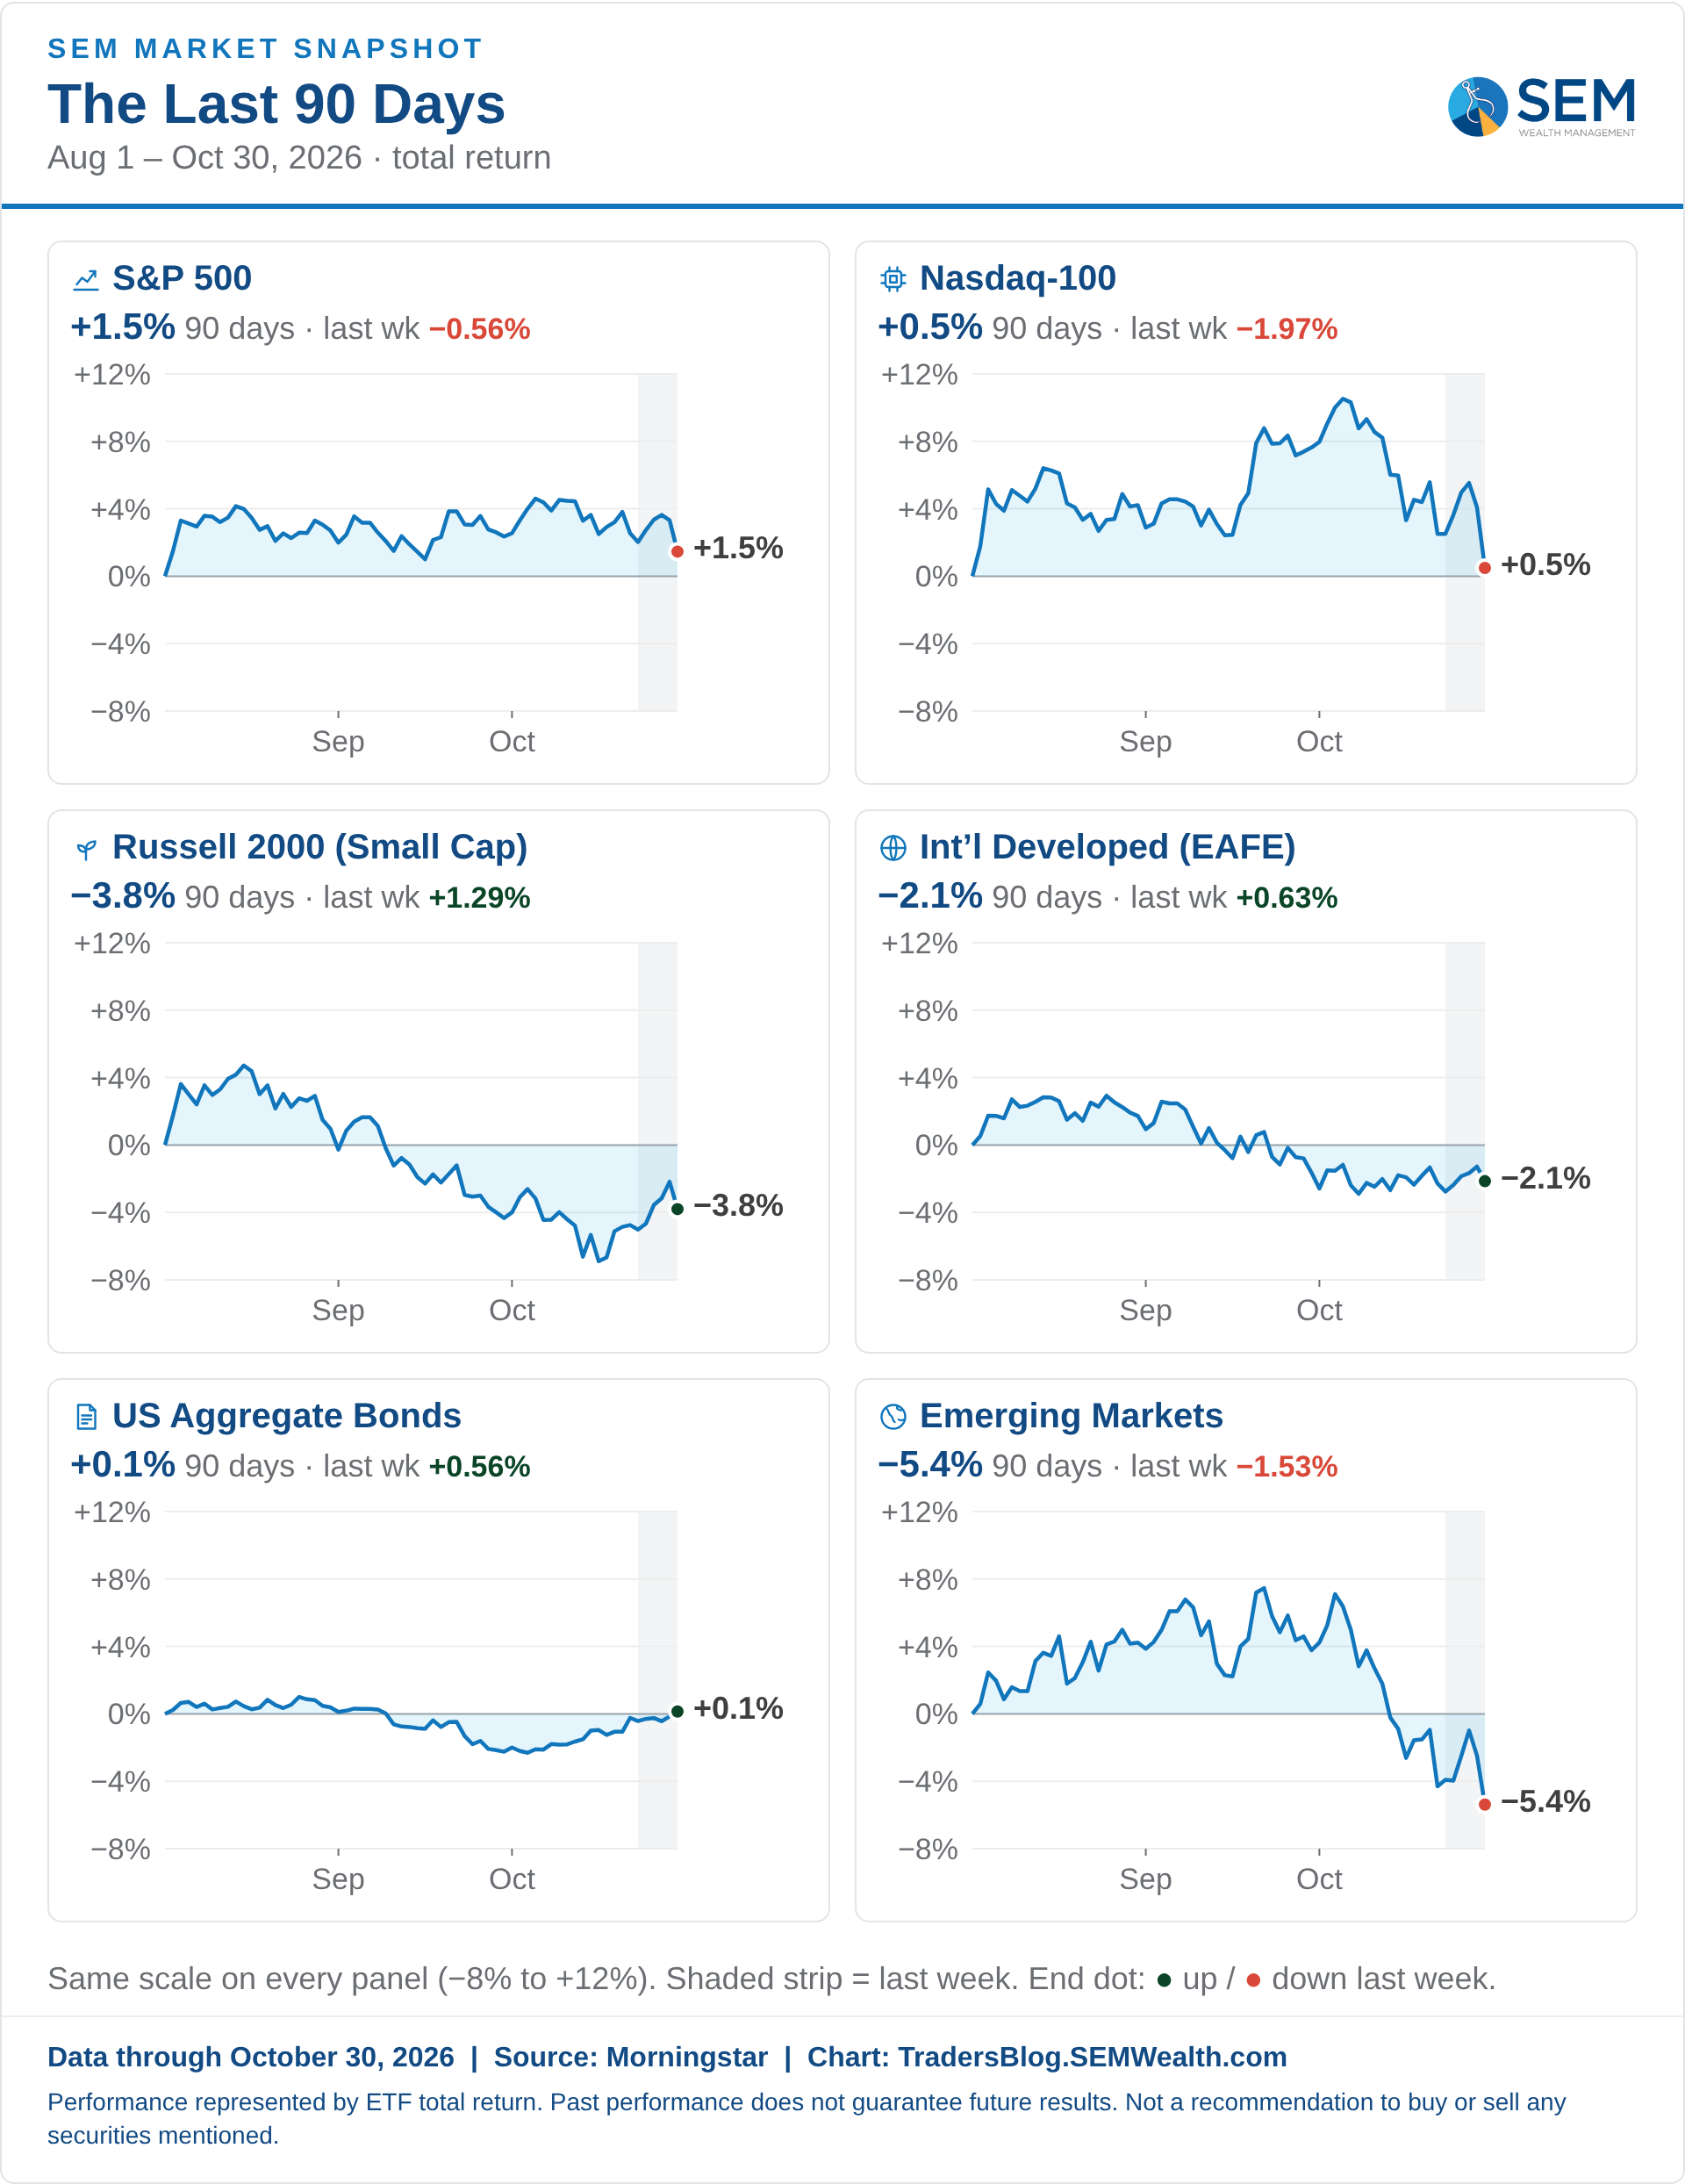
U.S. stocks were mixed last week, as the S&P 500 fell 0.6%, the Nasdaq-100 fell 2.0%, the Dow fell 0.8% and small caps (Russell 2000) rose 1.3%. Value beat growth and small caps outpaced large caps, with small growth best in the style box (+1.9%) and large growth worst (−1.7%); health care led the sectors (+3.1%) and communication services lagged (−5.3%). Elsewhere, bonds rose 0.6%, gold fell 2.5%, oil rose 0.9% and bitcoin dropped 5.9%; the S&P 500 is up 11.7% so far this year.
SEM Market Positioning
SEM deploys 3 distinct approaches – Tactical, Dynamic, and Strategic. These systems have been described as 'daily, monthly, quarterly' given how often they may make adjustments. Here is where they each stand.
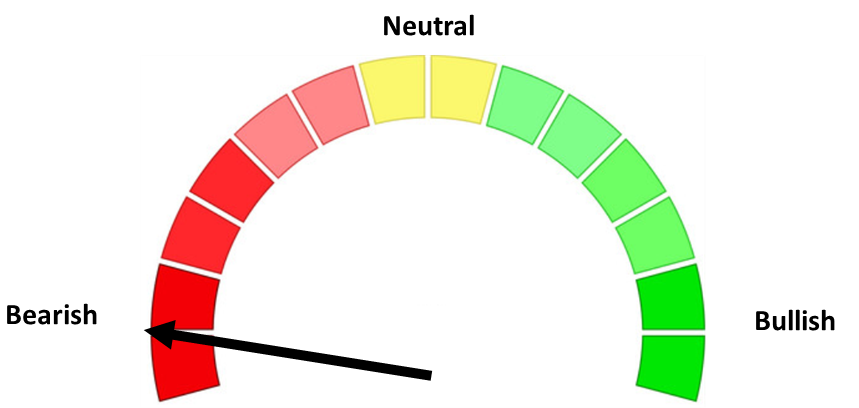
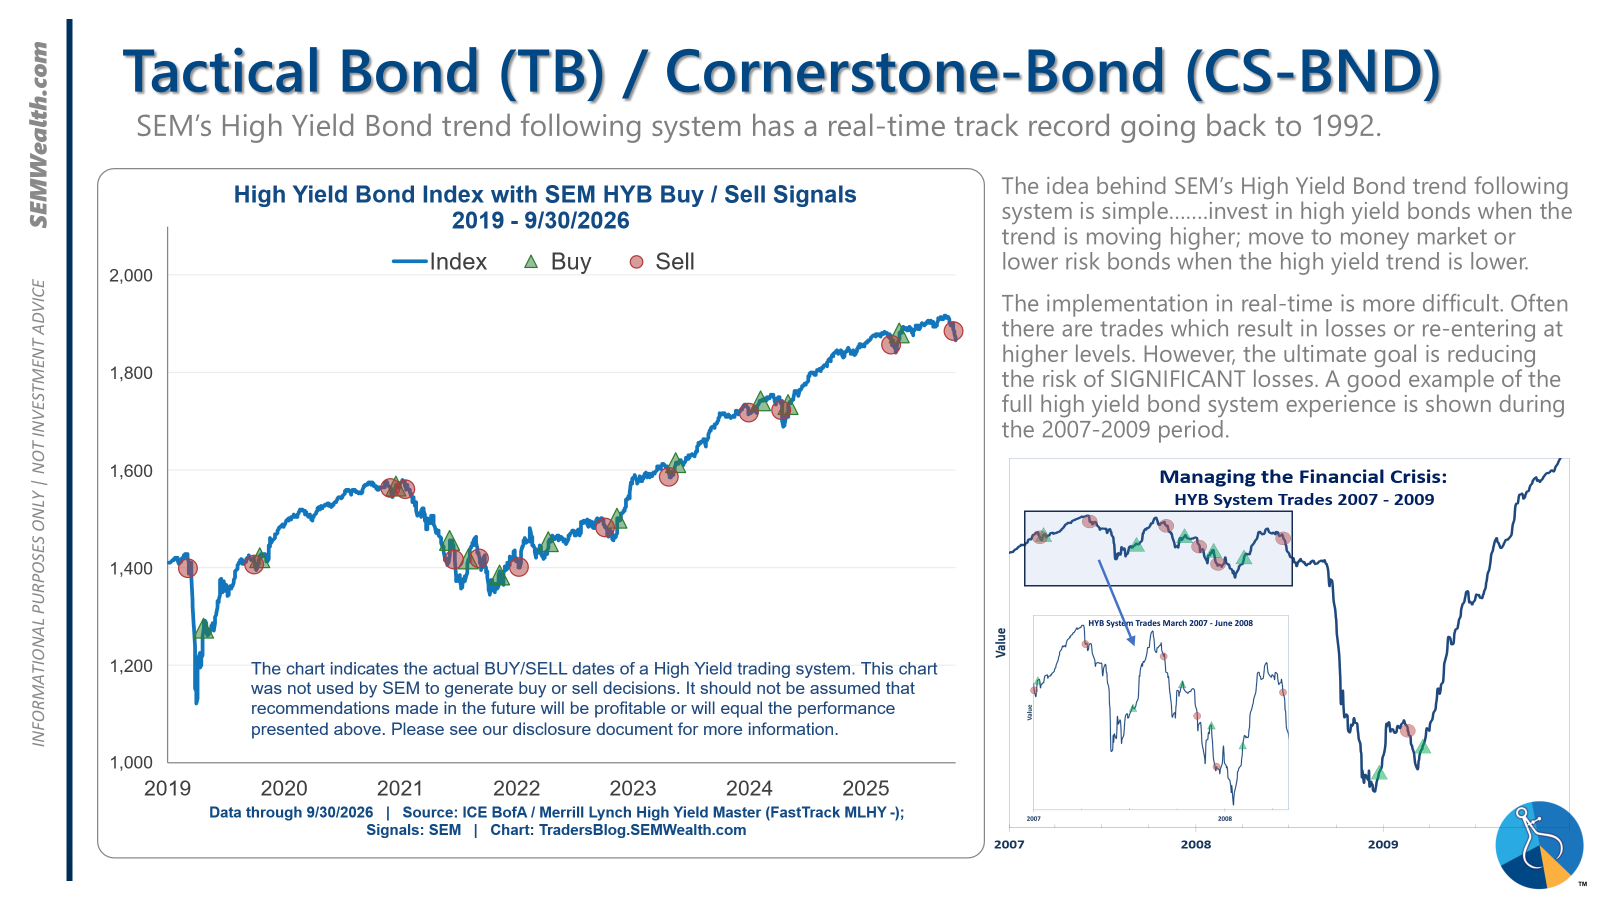
- Tactical = BEARISH (9/24/26) | 100% Money Market / Short Term Bonds (9/24/26) | High-yield trends reversed lower with spreads near historic lows.
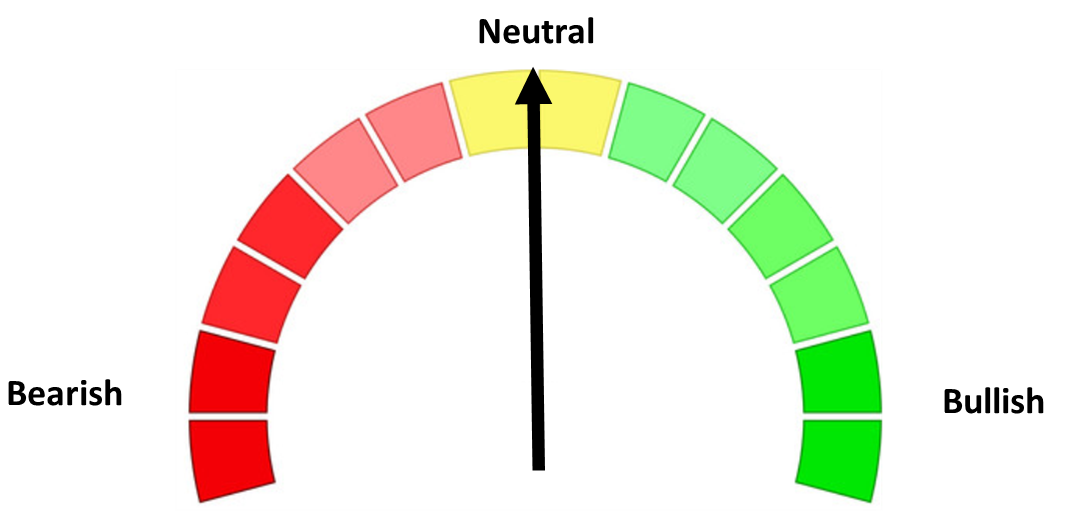
- Dynamic = NEUTRAL (2/15/2026) | "Benchmark" Allocation | Economic model inconclusive
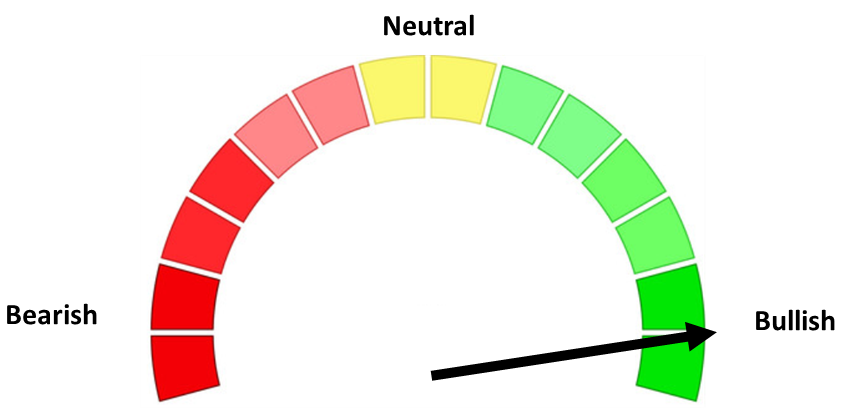
- Strategic = BULLISH (4/15/2026) | V-Bottom projecting "end" of Iran War
Tactical (daily):
- Monitored DAILY
- Models: Tactical Bond, Cornerstone Bond, Income Allocator, Tax Advantaged Bond
- Designed to follow the trends for use in our lower risk models
- SELL Signal issued September 24, 2026 (exiting the buy from April 8, 2026)
Dynamic (monthly):
- Monitored MONTHLY
- Models: All "Dynamic" Models (Income, Balanced, Aggressive Growth, and Asset Allocator)
- Uses SEM's Quantitative Economic Model
- Designed to overweight riskier assets if economic trend is higher & underweight those assets if economic trend is lower.
- NEUTRAL signal issued February 15, 2026 (following BEARISH signal from July 2025)
Strategic (quarterly)*:
- Monitored QUARTERLY
- Models: AmeriGuard (Balanced, Moderate, & Growth) and Cornerstone (Balanced & Growth)
- Core Component: Quantitative Filter using 4 different time horizons across universe of asset classes
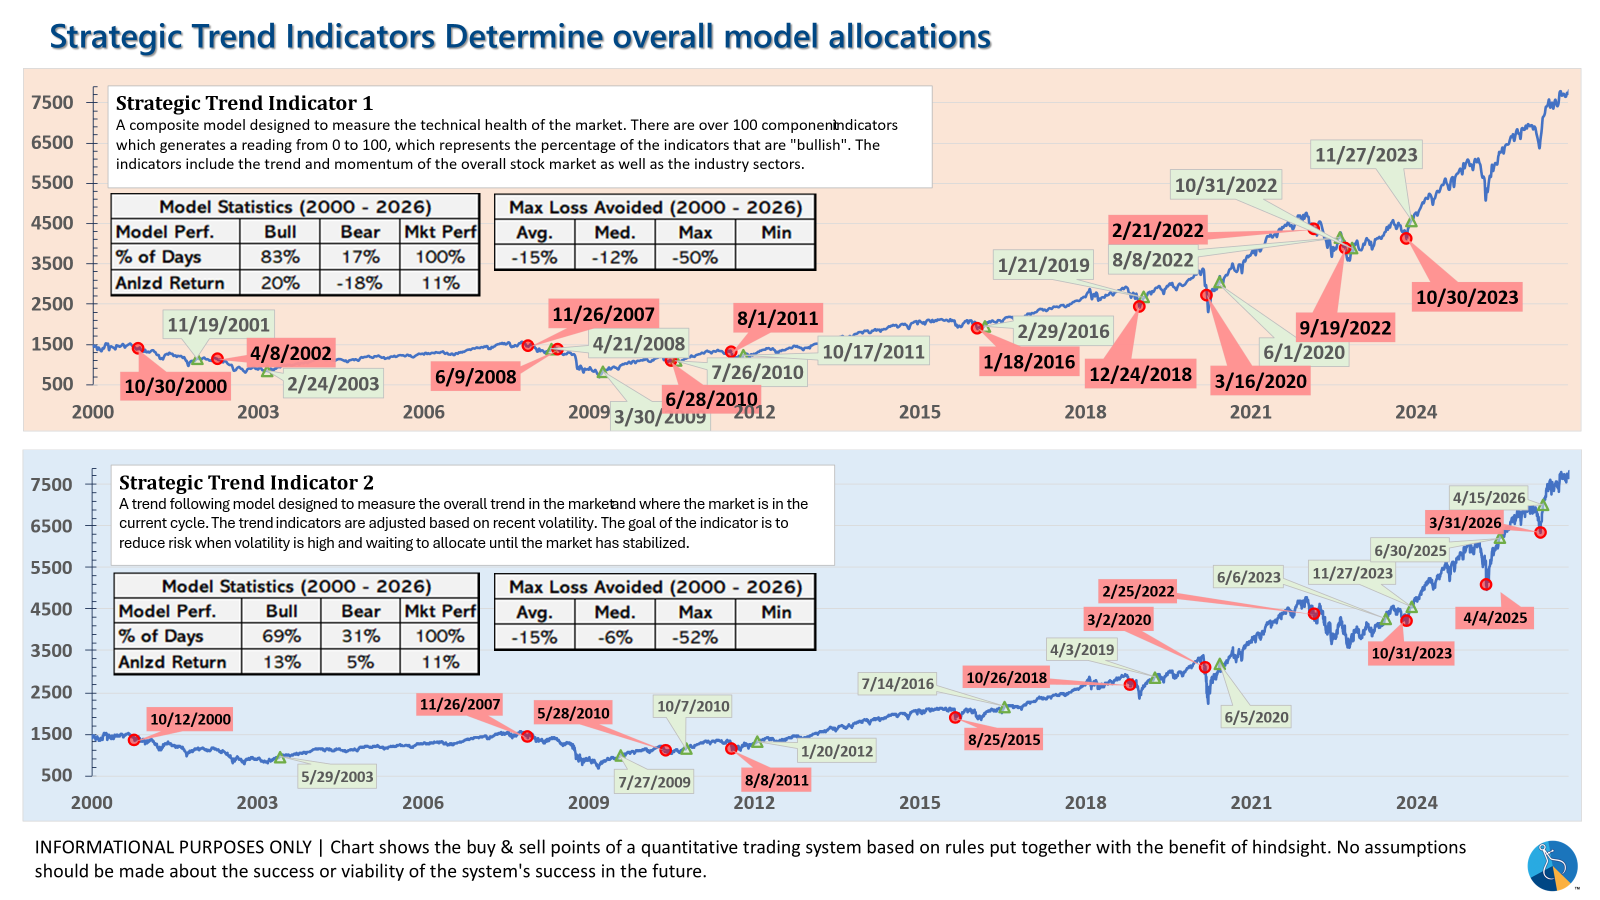
- Trend Indicator: Two different Quantitative Systems monitoring the intermediate-term trend, health of the market, and volatility
- CORE eliminated small cap in AmeriGuard and reduced it in Cornerstone in October 2026; overweight international since October 2025.
- Both TREND INDICATORS are BULLISH following 10% drop and "V-Bottom" reversal in early April
- AmeriGuard & Cornerstone Max DO NOT use the Trend indicator and are always 100% invested in stocks using our CORE rotation model.
The core rotation is adjusted quarterly. To start the 4th quarter we saw all of our small cap position in AmeriGuard eliminated and the Cornerstone small cap position cut in half. We remain overweight international (at least for these models where the benchmark is 0% international).
The * in quarterly is for the trend models. These models are watched daily but they trade infrequently based on readings of where each believes we are in the cycle. The trend systems can be susceptible to "whipsaws" as we saw with the sell and buy signals in the spring of 2025 and 2026. The goal of the systems is to miss major downturns in the market. Risks are high when the market has been stampeding higher as it has done since 2023. This means sometimes selling too soon. If "wrong", the systems can quickly reverse.
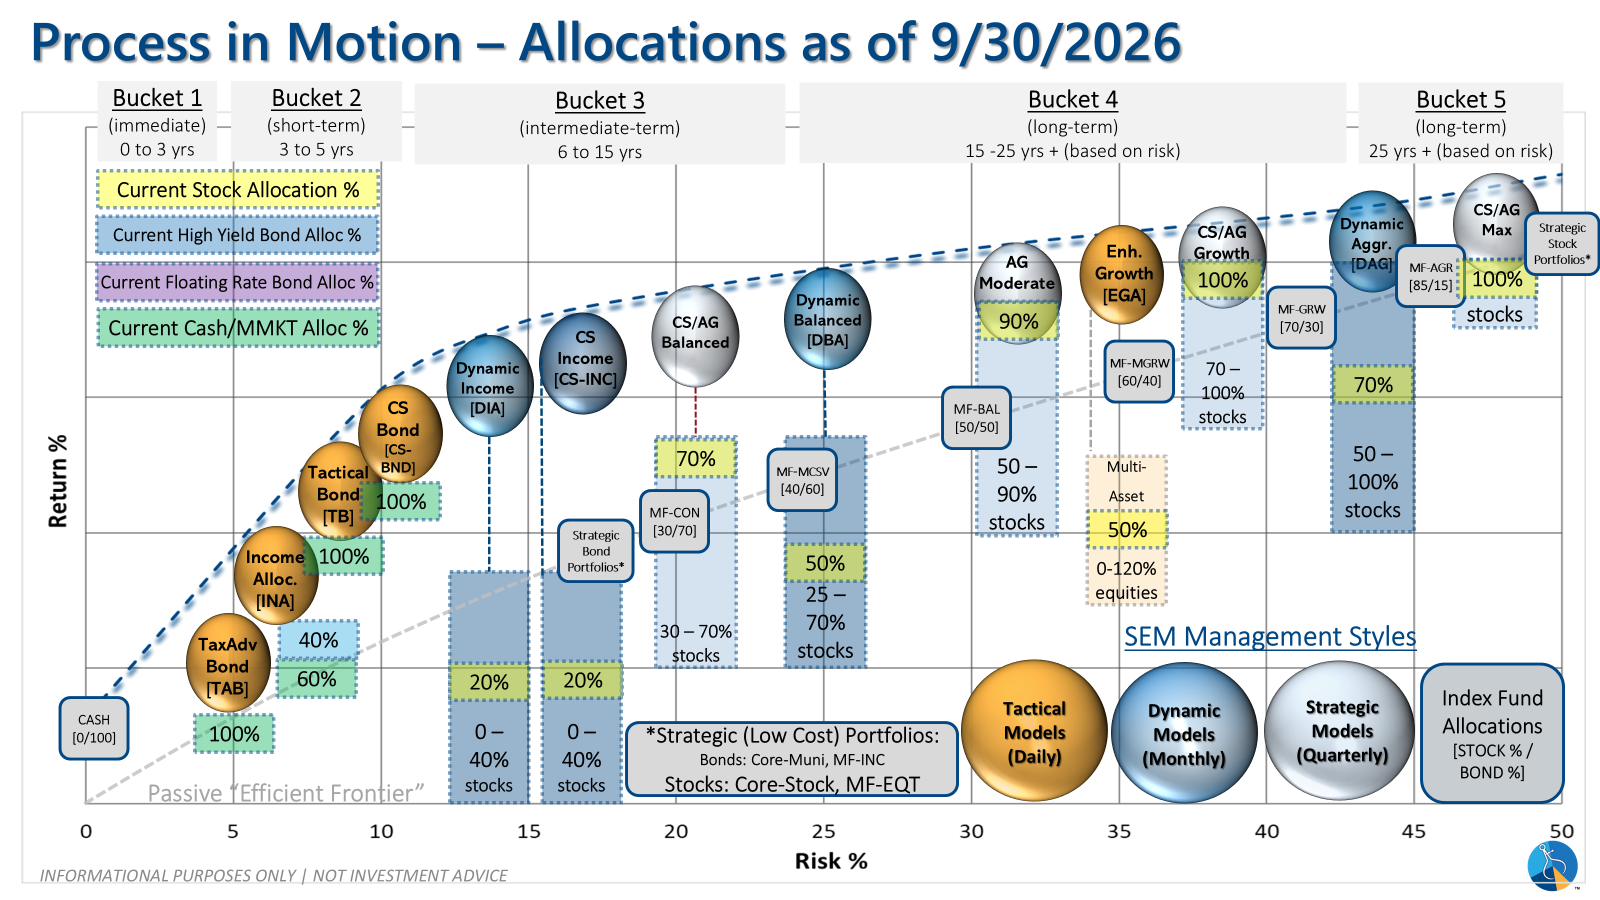
Overall, this is how our various models stack up based on the last allocation change:
Curious if your current investment allocation aligns with your overall objectives and risk tolerance?