Last week the calendar looked light, but unfortunately it was anything but. We had an inflation report that came in hotter than expected, the biggest 4-day jump in the 2-year Treasury yield since 2022, and an ongoing scandal causing the face of AI to step down. We also had an outage from Microsoft that kept many of their services out of commission until the next morning. When you include the FAA 'ground stop' Friday afternoon, the end of the week gave us more disruptions than the Y2K all of us 'gray hairs' remember we were supposed to plan for.
In case you missed it: Can we grow our way out of the debt?
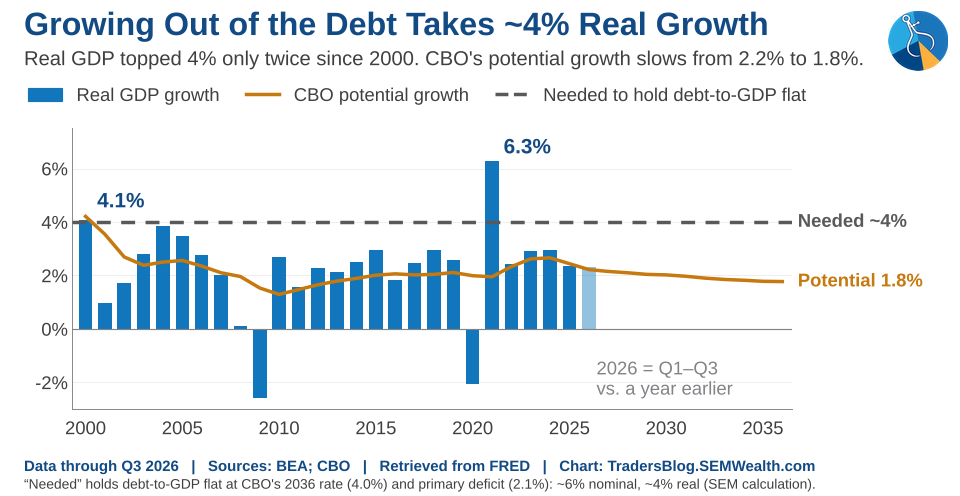
On Friday I finally published my post on government spending and the "we can just grow our way out of the debt" argument. The short version: holding the debt steady would take somewhere between 3.3% and 4% real growth every year for a decade, something the economy hasn't done since the internet boom, and inflating our way out isn't the answer either. Check it out here:
 Jeff Hybiak, CFA

Once again, for those of you who prefer to watch the musings instead of read them, here's my 5-minute video version. Shout out to Nate for commenting on last week's video and saving this format for another week. If you prefer this method, keep watching, give it a thumbs up, and drop us a comment.
What's on my mind this week:
1.) Putting the Nvidia news in perspective
Hubris: an exaggerated pride or self-confidence (Merriam-Webster)

The most often asked question I received after my speaking engagements this fall was, "what do you think will end the AI mania?" (or something along those lines). I preceded my answer with the caveat that what typically ends a mania is obvious with hindsight but not so while it is developing. However, in past market cycles hubris played a major role in helping to accelerate the ending.
Will that be the case this time around? Time will tell, but............
For those of you who've been following along for a while, you know I've been a bit uncomfortable with some parts of the AI ecosystem, including how much influence Nvidia has on the whole thing. I've mentioned specifically how uneasy I was about how confident the "face of AI" had become. Back in September I titled a section of our Everchanging AI post "Circularity, or an unstoppable ecosystem?" after Jensen Huang called Nvidia's ecosystem "unstoppable." I told our advisors that week how much I HATE when people say that (I said maybe Mr. Huang was rightfully confident, but it was something that made me worry). I've seen this before – in the late '90s it was Scott McNealy at Sun and Larry Ellison at Oracle, and even John Chambers at Cisco, who was more reserved but just as confident (his quote about the 'next industrial revolution' opens our AI keynote).
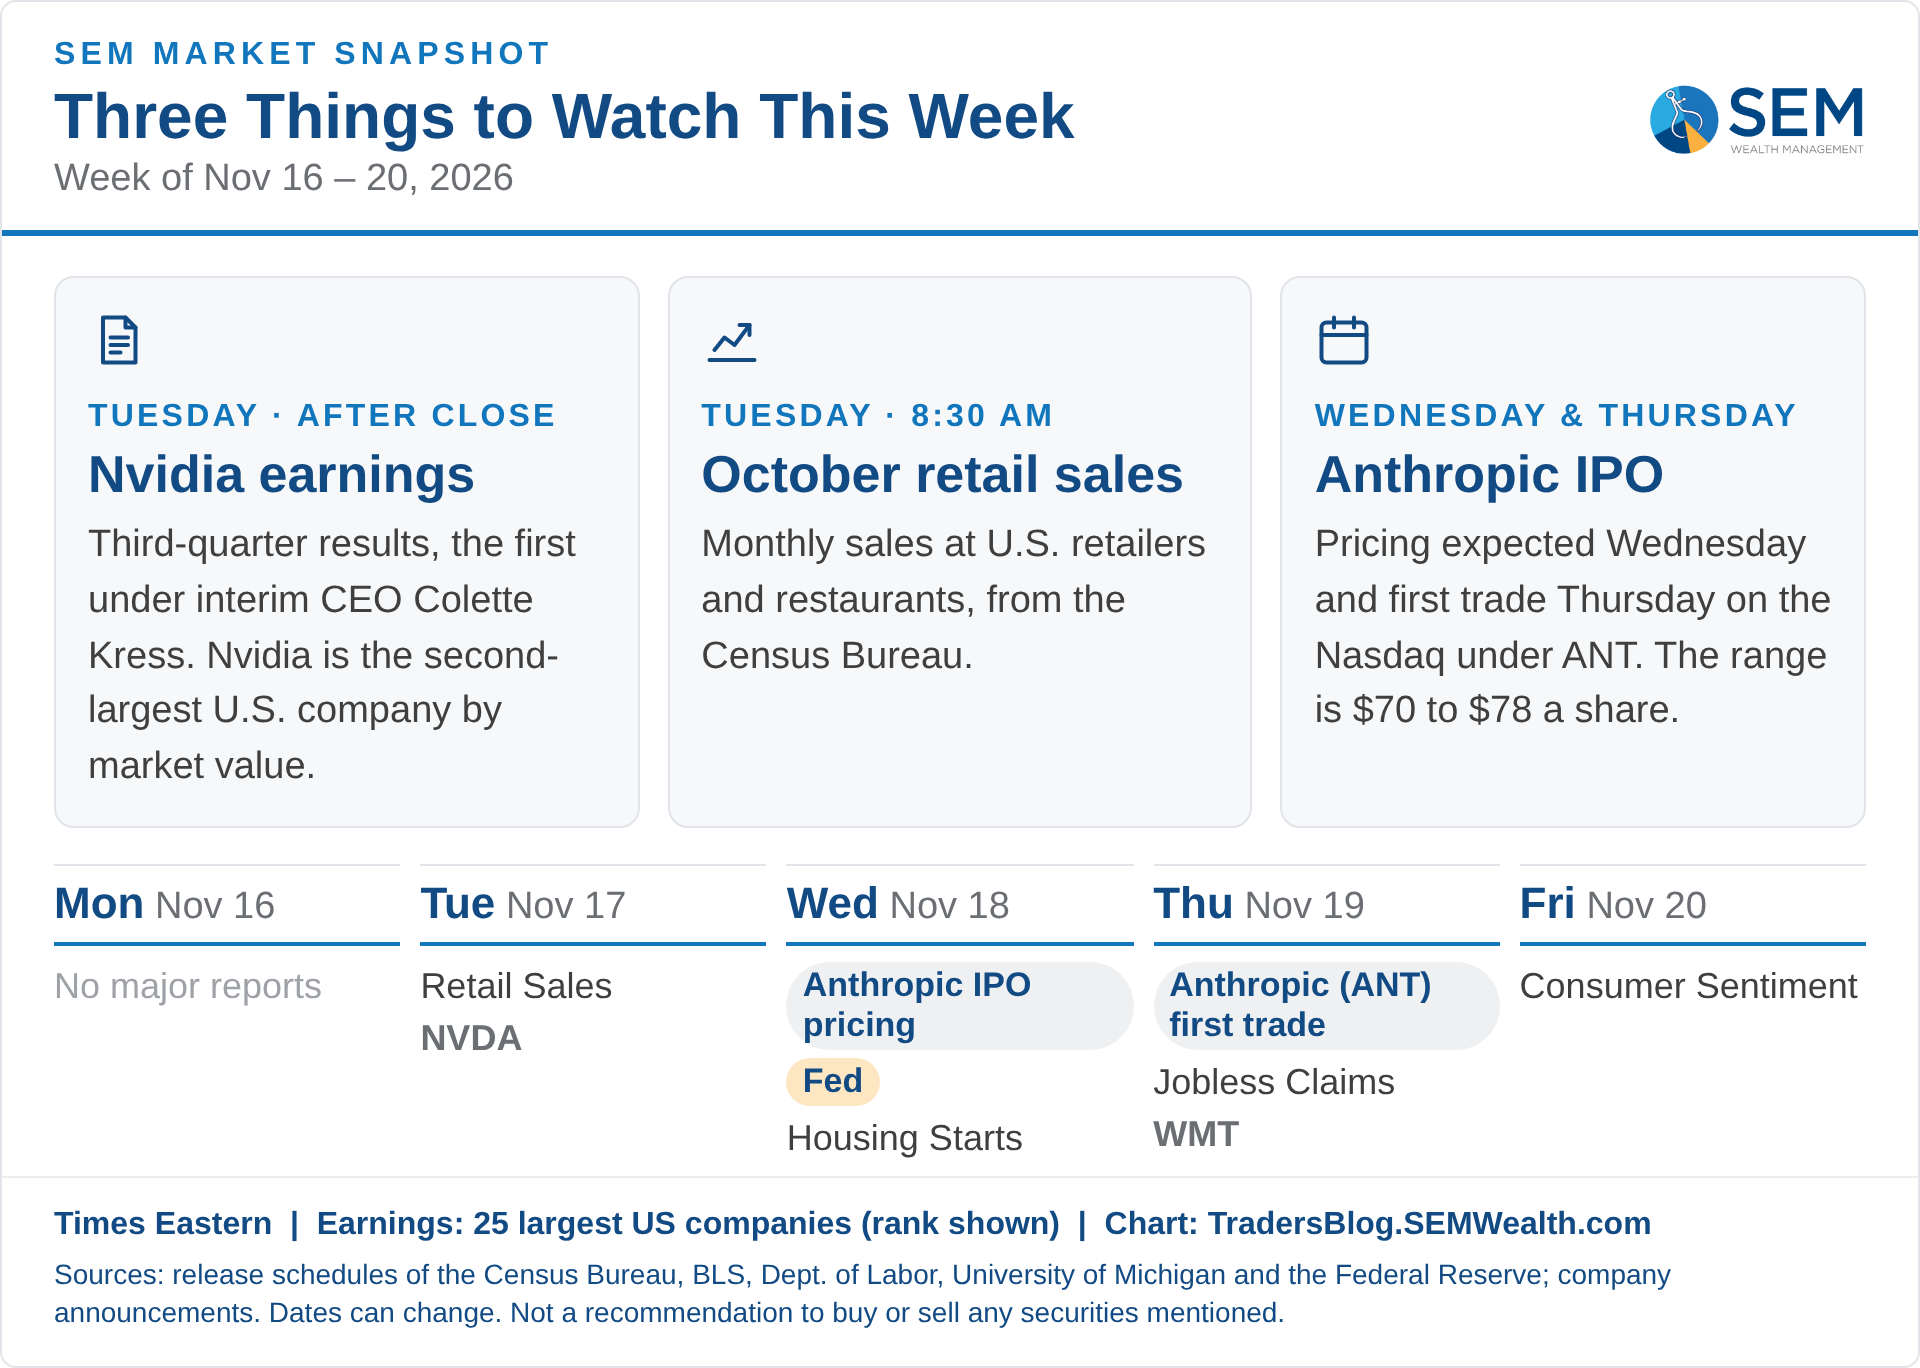
Following a week of on-going reports about various affairs, Mr. Huang resigned as CEO Thursday morning and left the board, effective immediately. This was after the board opened an investigation into reports about his personal conduct and whether he was the target of a foreign intelligence effort. CFO Colette Kress, who has been at Nvidia since 2013 (and a graduate of the Eller College of Business at the University of Arizona – the same school Cody and Courtney attended), is now interim CEO. The board also named its first-ever chair. The company says operations, customer commitments and the product roadmap will continue "without interruption." Their earnings are still scheduled for Tuesday after the close.
What caught my attention most in the coverage since Thursday goes right back to the "circularity" question we raised in September. According to Reuters and the Wall Street Journal (both citing unnamed people familiar with the matter), Ms. Kress and her finance team repeatedly pushed back on Mr. Huang and the sales organization over the financing Nvidia was giving its own customers, including an August meeting where she reportedly argued for scaling back the backstop for OpenAI and questioned whether some of the smaller cloud companies could actually afford the chips they were buying. Nvidia hasn't commented on the reports.
What we DO know comes from Nvidia's own filings – the company has guaranteed up to $105 billion of lease payments on a data center campus in Ohio where OpenAI is the tenant, on top of $3.5 billion of similar guarantees for other AI cloud partners (the Ohio guarantees start as the leases begin, expected in 2028, and end if OpenAI earns a good enough credit rating). The person who reportedly wanted to rein those deals in is now running the company, so I'll be listening closely Tuesday for any change in how Nvidia talks about them. That could cut both ways, since less financing could mean fewer chips sold to the smaller clouds, but it could also ease the "circular demand" worry that has hung over the stock.
All of this is a real-time example of how the behavioral finance and stock valuation lessons from my Liberty University class come together. A stock's intrinsic "value" is the cash it's expected to produce, discounted by the return investors demand to own it (the 'required return'). Because of this variable, neither the business nor the forecasted growth has to change for the price to fall (as we learned last week).
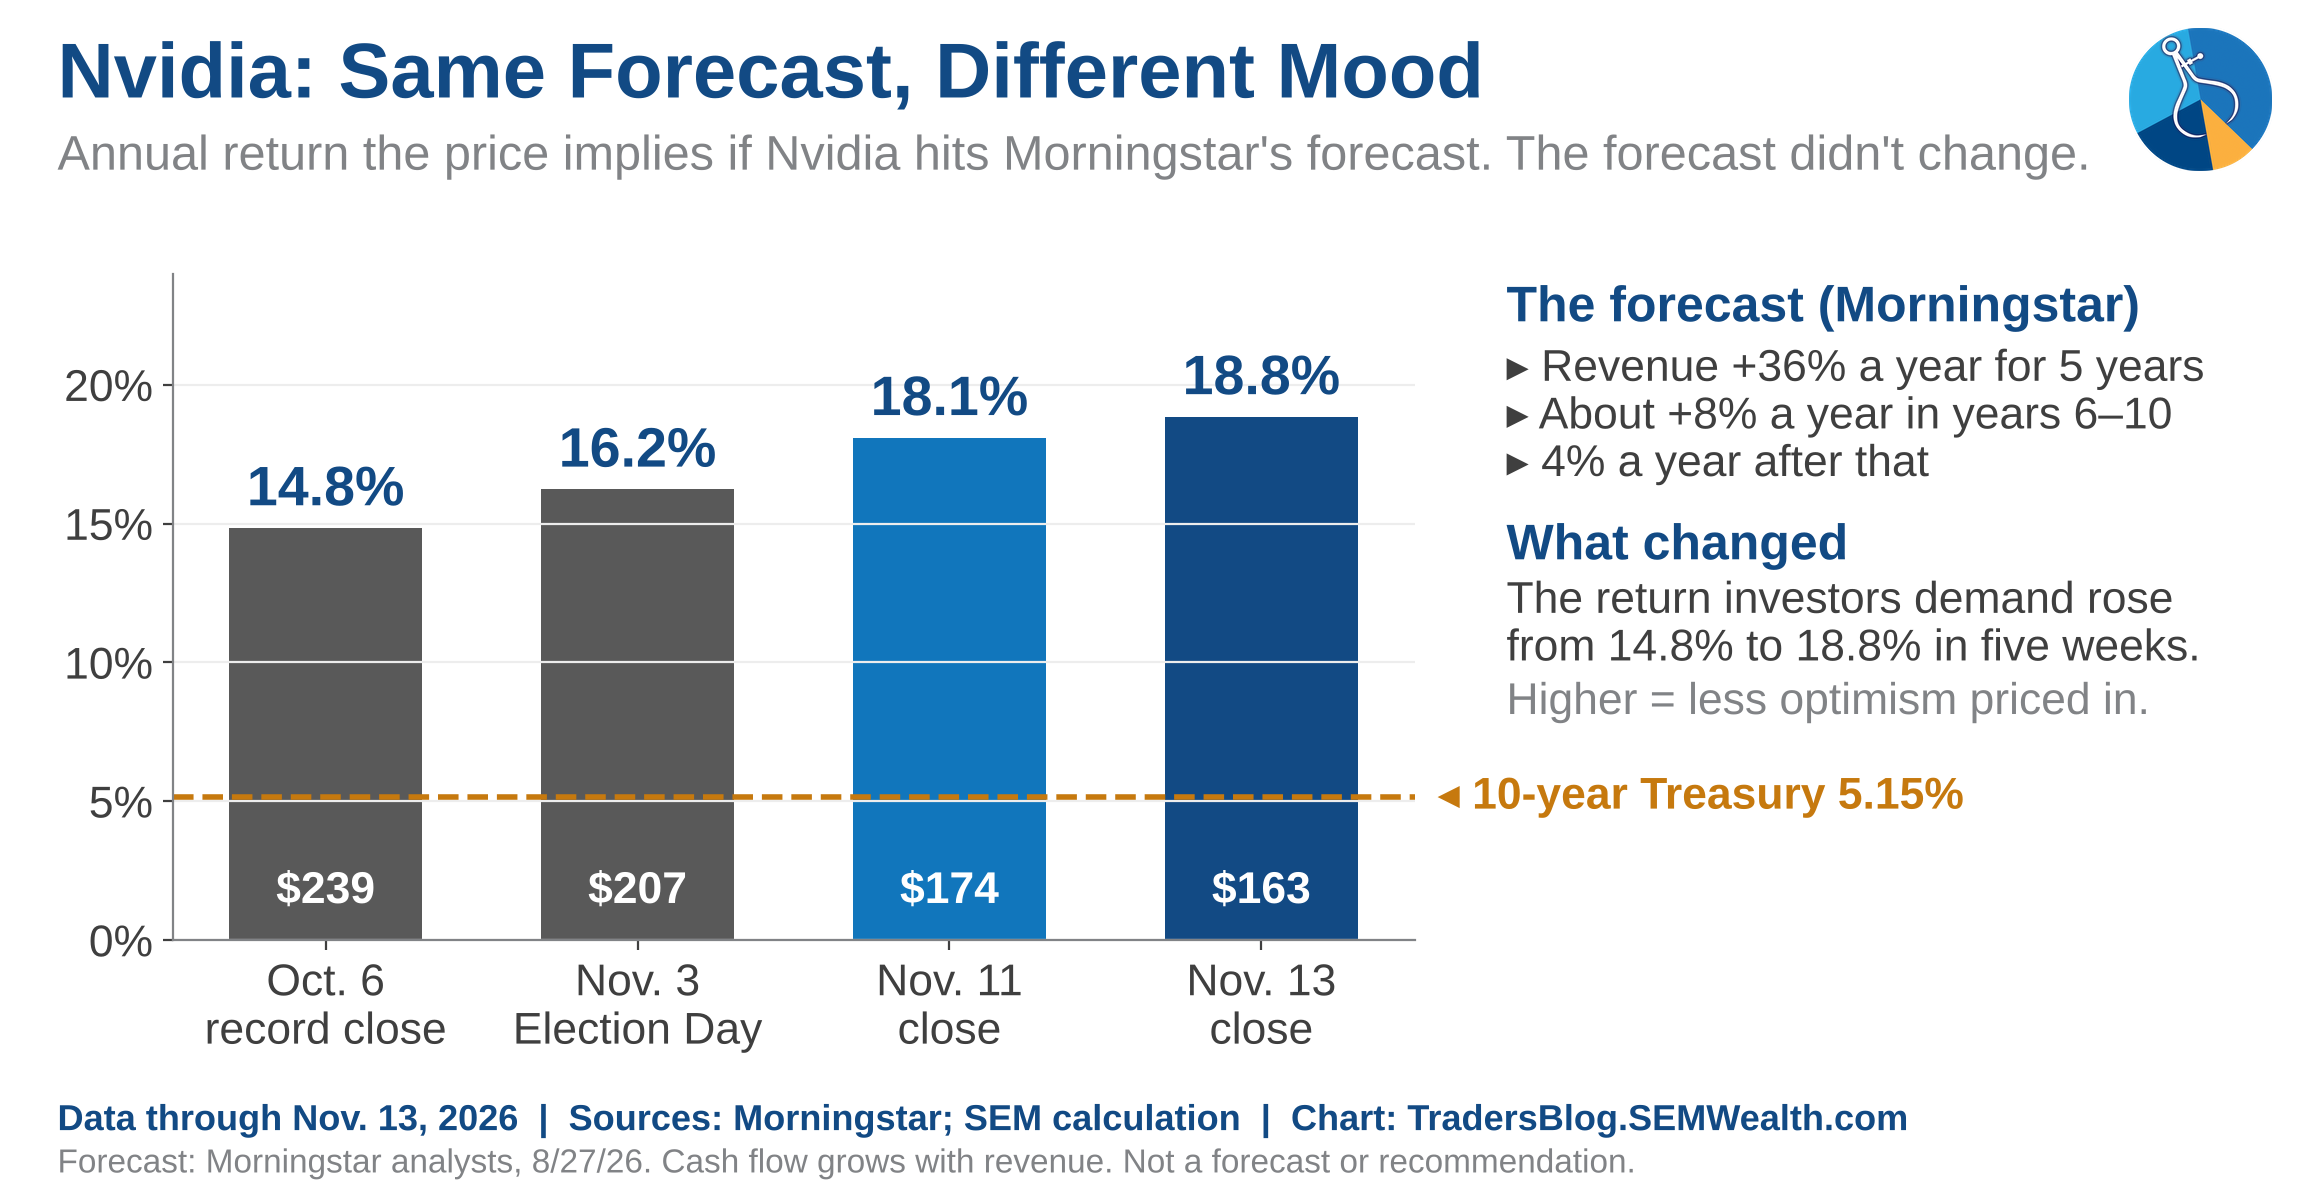
As I tell my students, unlike their textbook problems, nobody tells you what variables to put into your formulas. There are services which will take the data and give you what they think it is. For instance, Morningstar's analysts haven't changed their forecast for Nvidia (revenue growing about 36% a year for the next five years), and they kept their $310 fair value after the resignation.
Taking that growth forecast and applying algebra, you can work backwards to calculate the required return (the combination of the 'risk-free rate' and the so-called risk premium. This is also known as the 'discount rate' in some valuation formulas.) – about 14.8% at the October 6th record ($239.24), 16.2% at the Election Day close ($206.69), 18.1% at Wednesday's close ($173.73) and 18.8% at Friday's close ($162.85). The growth forecast didn't change in five weeks, but the return investors demand to own Nvidia went up by about 4.0%, which by itself explains the drop in the stock.
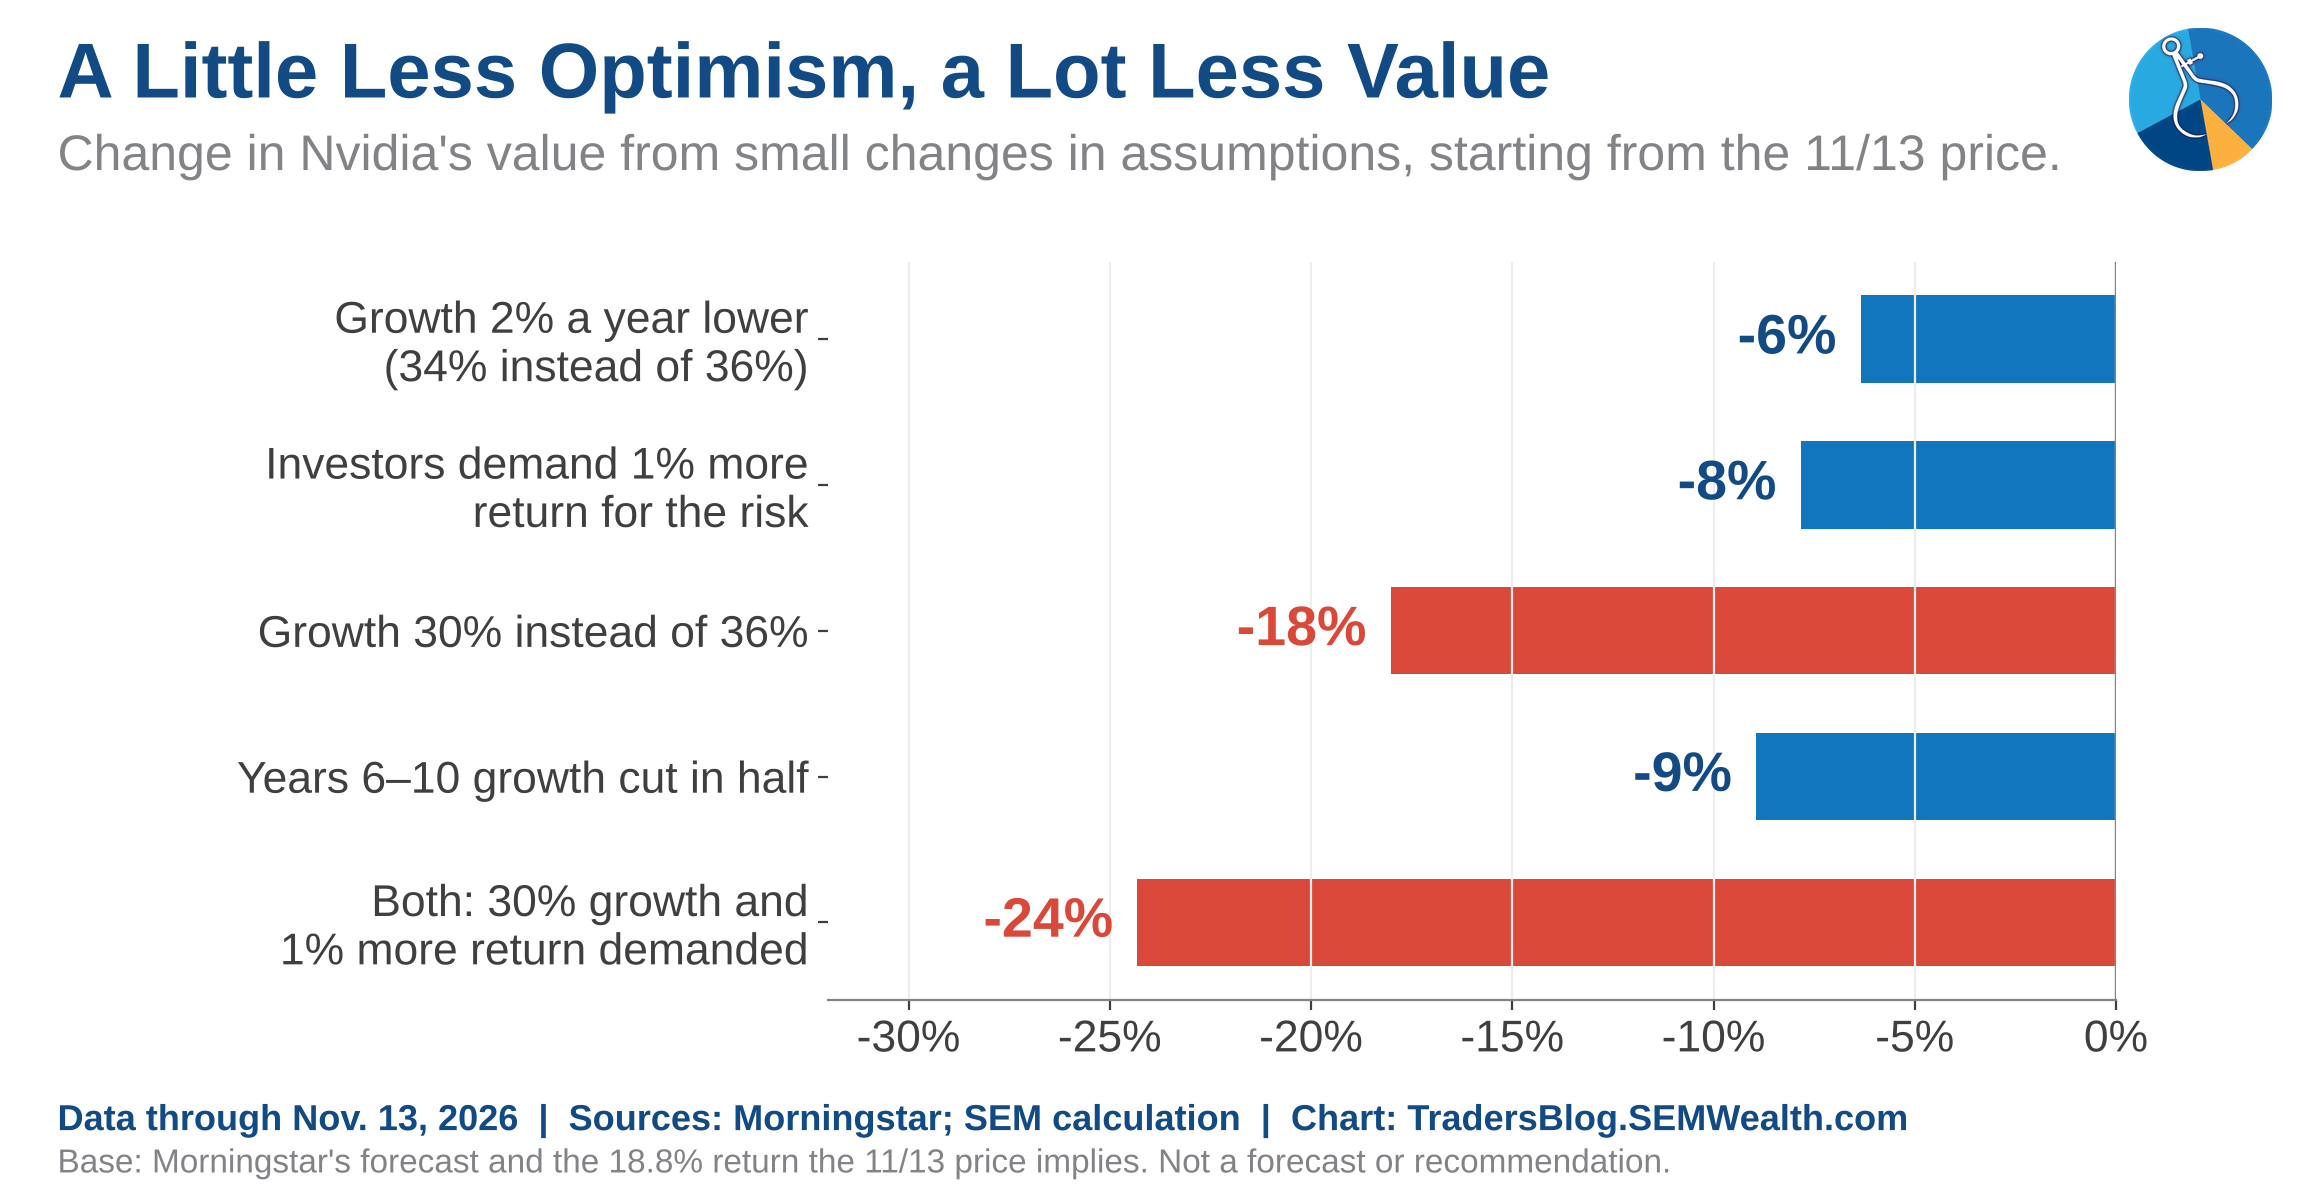
It works the other way too. Starting from Friday's price, cutting the growth rate from 36% to 34% takes about 6% off the value, demanding 1% more return takes about 8% off, and doing both of the bigger changes (30% growth and 1% more return) takes off about 24%. In other words, it doesn't take much of a change in mood to move a stock a lot, especially one that has ridden other booms before (crypto mining before the 2018 bust, the COVID PC surge before the 2022 bust, and now ChatGPT).
The lesson of all this and the one I leave with the students: The formulas that give us the "fair value" of a stock are HIGHLY sensitive to two inputs -- the growth rate and the required return. Since it's humans determining both, how those humans FEEL about the company (or market or economy) will influence these variables. If they FEEL optimistic, chances are they will assign a higher growth rate and a lower required return. (I don't need to be compensated as much because this is a solid company.)
Why should clients who don't own Nvidia care? Nvidia is still about 6% of the S&P 500 (No. 2 behind Apple), so most of them own it through their index funds, and every 10% move in Nvidia moves the index about 0.6%.
Taking the other side, Nvidia's run wasn't luck, but the result of a huge, calculated (and successful) bet – it launched CUDA (the software that lets programmers use its chips for more than video game graphics, and only runs on Nvidia's chips) in 2006 and spent a decade turning its chips into general-purpose computers. This helped Nvidia be a key player in the early "crypto" mining boom, and then to switch over to playing the leading role of the "token" gold rush when ChatGPT arrived.
At Friday's price the stock already assumes far less than the analysts do. At a "normal" 10% required return, the price implies growth of only about 8.2% a year for five years, against Morningstar's 36% forecast. This is the opposite of euphoria. If Tuesday's earnings and outlook holds and the hyperscalers keep spending, the mood could snap back just as fast as it fell.
The "hubris premium" may already be out of the stock, but it doesn't mean it won't appear somewhere else. Keep in mind my favorite quote from hedge fund manager Seth Klarman:
"The stock market is the story of cycles and of the human behavior that is responsible for overreactions in BOTH directions."
(This is not a recommendation to buy or sell Nvidia stock, but simply an example of what can cause a stock to fluctuate so much in a short matter of time.)
2.) The neoclouds gave opposite answers on the buildout in 24 hours
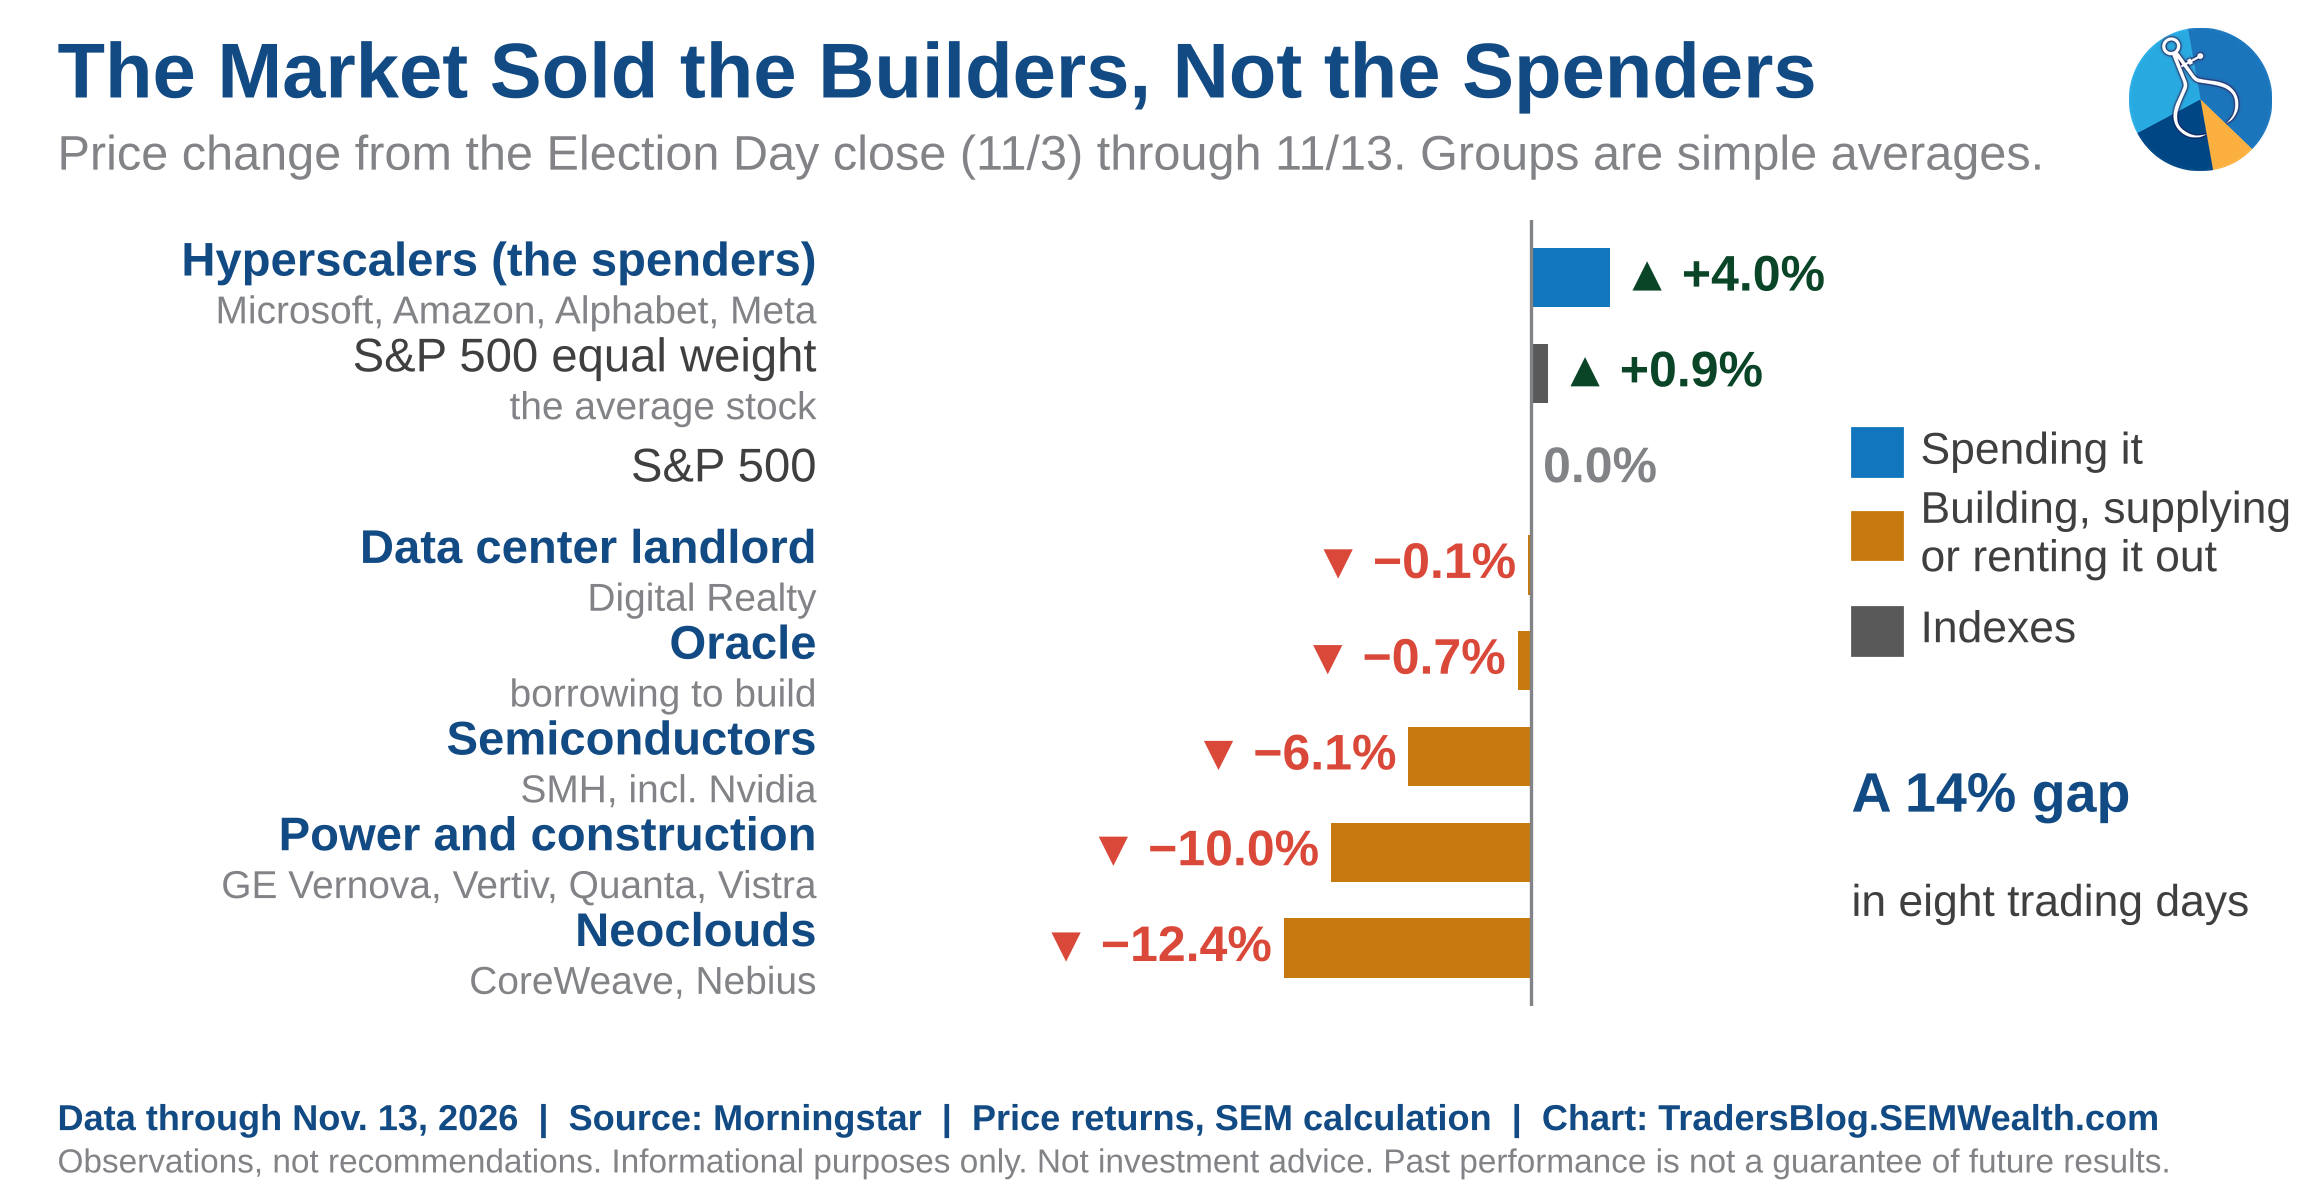
Last week I wrote that the market sold the (AI) "builders", not the spenders. The neoclouds (the companies renting out AI computing capacity) were right in the middle of it. This week the two biggest of them reported back to back, and they gave very different answers on how fast the building is going.
CoreWeave went first last Tuesday night, with revenue coming in above its own forecast (up 168% from a year ago), a higher outlook for this year and plans to spend $37 to $39 billion on data centers and chips this year. The stock jumped nearly 25% on Wednesday and the whole group bounced with it.
Wednesday night it was Nebius' turn. Revenue also beat, but it now expects this year's revenue at the LOW end of its range, it raised this year's spending plan to about $27 billion, and it described its first 2027 outlook as "a conservative approach to the pace of our build-out." Nebius fell nearly 17% on Thursday. CoreWeave was down as well, but this also was the day Nvidia's CEO resigned.
In 24 hours, two companies in the same business gave us opposite answers on whether the buildout is speeding up or slowing down.
The other thing CoreWeave's report shows is how all of this is being paid for. Its debt rose about $10 billion in one quarter to $41.6 billion, it spent $14.5 billion in the quarter (about 4 times its revenue), and it expects about $9 billion over the next three months to come from customers paying in advance. The concern investors have been having with many of the hyperscalers (and AMD) remains the same -- How much of the "growth" is being paid for with borrowed money?
On the more bullish side, CoreWeave has $132.5 billion of signed contracts it hasn't delivered yet, its operating margin doubled from last quarter, and Nebius' finance chief said they were "very conservative" with the guidance. Neither company is blaming demand, but instead how fast (and how expensively) they can get the capacity built and financed. That fits last week's read, where slower building hurts the builders while the spenders get to keep more of their cash.
(Side note/correction: last week I said South Korea and Japan falling with our chip stocks was a sign the election wasn't the cause, since neither one votes on Texas data centers. That was the wrong spin, since both export chips into the U.S. buildout, which is why they fell with it.)
3.) Inflation ran hot again, the bond market responded
Last week I wrote that if oil held its drop, headline inflation should start cooling over the next few months. October's inflation report gave us a little of that, and a lot of what the Fed doesn't want to see.
Consumer prices rose 0.4% in October (economists expected 0.3%), down from 0.6% in September, and energy prices rose only 0.7% after jumping 5.2% the month before. At least for now the drop in oil is starting to show up. The problem is core inflation (without food and energy) rose 0.3% for the third month in a row, which works out to about 3.7% a year, almost DOUBLE the Fed's 2% target. Friday's report on wholesale prices didn't help, with producer prices up 0.3% in October and 6.5% over the past year (up from 6.3% in September).
(One quirk you may have seen in the headlines – there's no yearly inflation rate this month, because October 2025 prices were never collected during last year's government shutdown.)
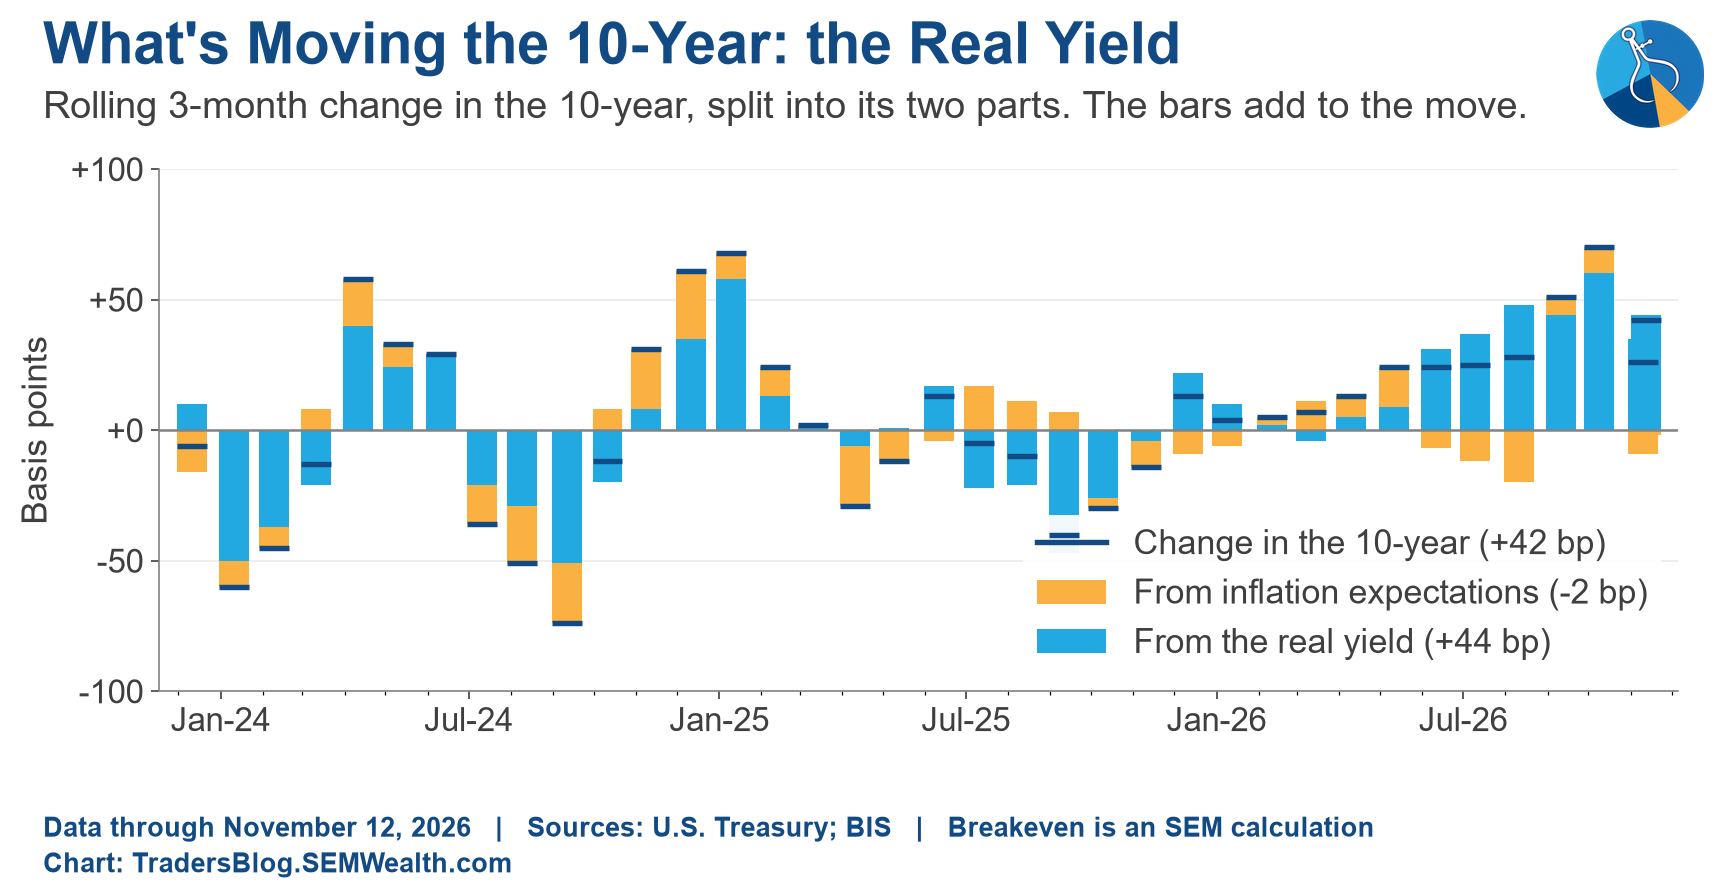
Put a strong jobs report next to a hot inflation report and you get a Fed that will likely raise rates again. The futures market is currently pricing a December hike as close to a sure thing, and the odds of TWO hikes by the end of January went from about 11% a week earlier to more than 66% on Thursday. The 2-year Treasury yield (the one most tied to the Fed) rose about 0.39% in four trading days, its biggest jump since June 2022, and the 10-year closed back above 5% on Thursday at 5.10% and finished the week at 5.15%.
The week before, falling inflation expectations pulled the 10-year down, while last week almost all of its rise came from real yields (what investors demand above inflation), which is the bond market pricing in a Fed that won't let inflation do the work. That's the same point I made in Friday's debt post – inflating our way out isn't the answer either. Oil didn't help on Thursday, with crude rising 2.6% after the President said the U.S. didn't need a deal with Iran.
The hope is that energy is rolling over. When you combine that with wages still growing slower than inflation, hours worked not moving for three months and the 10-year still below its 5.31% October peak, we could be moving towards an argument that the economy may not be running as hot as the Fed fears.
4.) The Anthropic IPO is set for this week, below the earlier hype
I can't forget the Anthropic IPO, which we've been following since the filing in our "Everchanging" report.
Last Tuesday Anthropic set a range of $70 to $78 per share for 825 million shares, which would raise around $64 billion and value the company around $1.4 trillion (fully diluted) at the top of the range. It expects to price the deal Wednesday (11/18) and start trading Thursday (11/19) on the Nasdaq under "ANT." That's well below the $2 trillion some reports floated in September, but above the "closer to $1 trillion" reported a week ago.
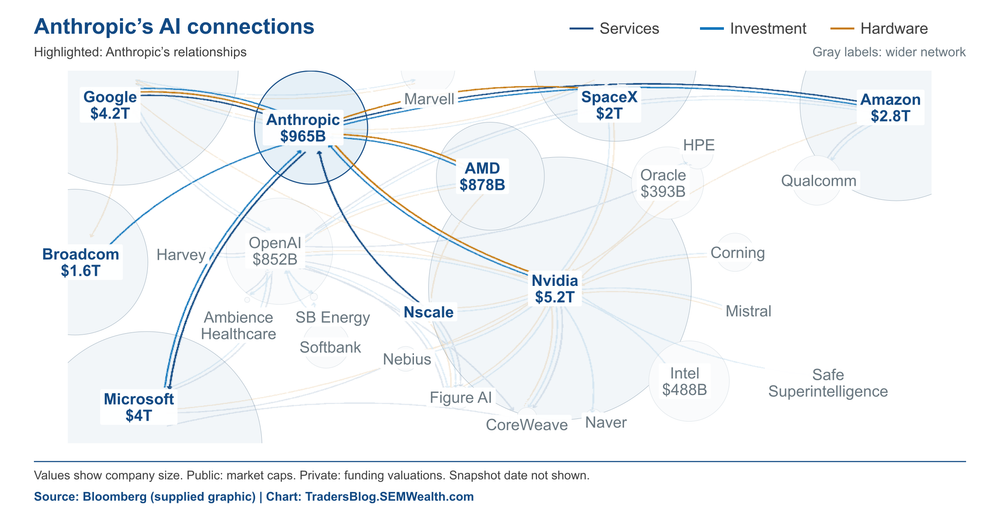
The updated filing also added the third quarter, which is a good example of why I'd rather read the filing than the headlines. Revenue reached $17.0 billion, up from $11.6 billion in the second quarter and $1.4 billion a year ago, but Anthropic swung back to an operating LOSS of $567 million after its first operating profit ($974 million) in the second quarter, as the cost of computing power caught up. Its commitments for computing power and data centers are now about $900 billion.
Obviously, a $17 billion quarter that grew 47% in three months is remarkable, and its adjusted operating income (which leaves out stock-based pay) was about $2.5 billion. However, growth slowed from 144% the quarter before, and as mentioned in #1, once ANT trades we'll know every day what the market thinks it's worth (no more guessing about valuations).
This is not investment advice or a recommendation on Anthropic's IPO or any security mentioned.
What We're Watching
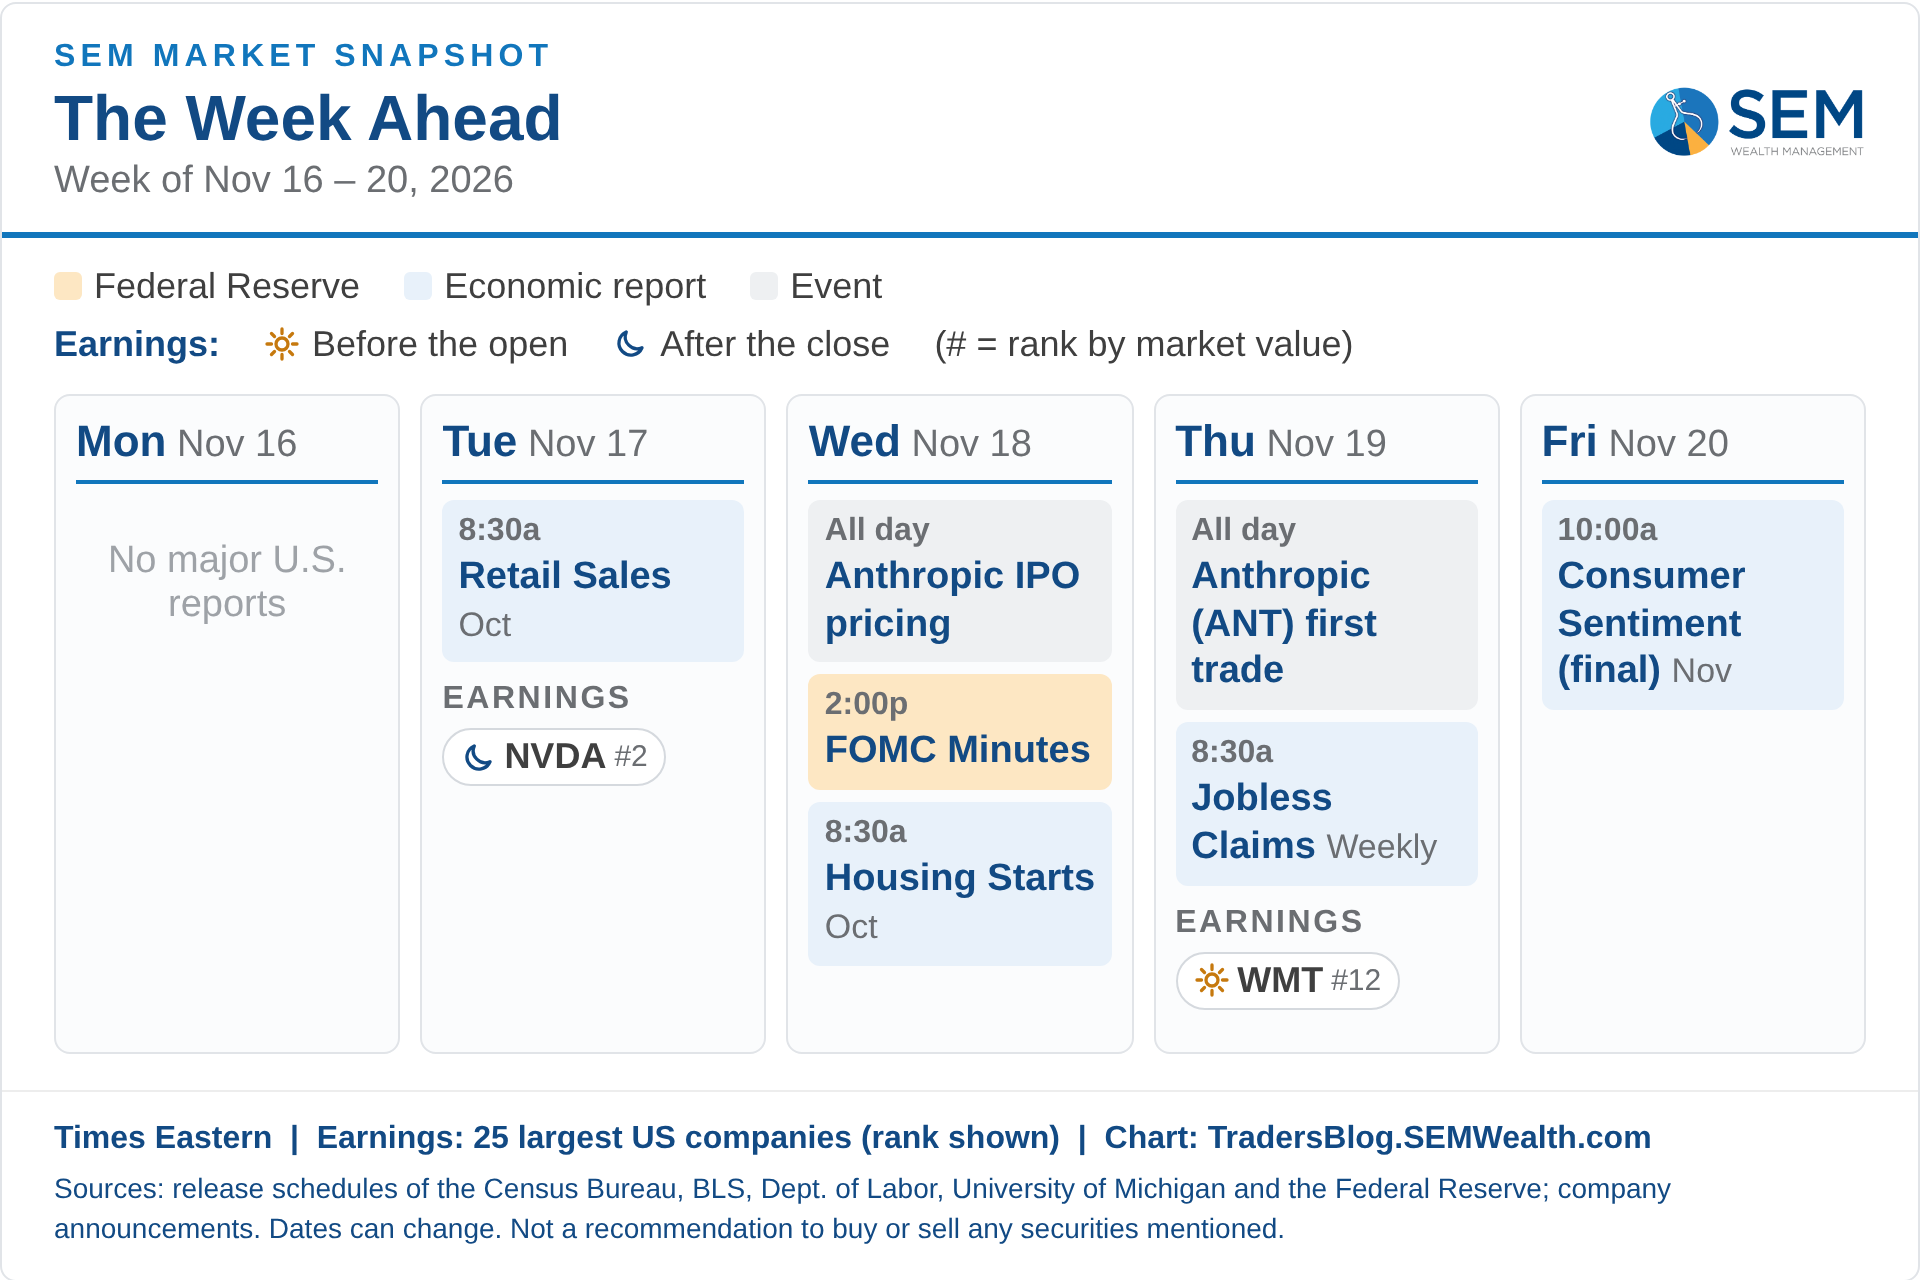
The week ahead is a busy one. Nvidia reports Tuesday after the close, its first report under interim CEO Kress and the last piece our AI dashboard has been waiting on (how long it takes Nvidia to get paid). The Fed's capacity utilization report comes out the same day, which is the next piece of our Cycle Position for October, and Anthropic is expected to price Wednesday and start trading Thursday.
Nothing triggered in any of our models last week. Our Tactical models remain on their September 24th sell signal and our Cycle Position is waiting until early December, after the November jobs report for confirmation before any adjustments occur in our Dynamic models. As always, we are here watching and adjusting so you don't have to.
Brainstorming, research, data gathering, charts, images, and proofreading assisted by my interns, Chip (Claude) and Scout (ChatGPT). Final content, including any mistakes, is mine. Information was obtained from sources believed to be reliable at the time of writing (economic data is subject to revisions), but its accuracy is not guaranteed. This post is for informational purposes only and is not investment advice or a recommendation to buy or sell any security. Past performance does not guarantee future results.

Midterms Come and Go. Here's What Markets Have Done Afterward.
Last week, we covered the data center angle from this month’s results. Now we turn to past midterms and the patterns investors can learn from them.
In last week’s Chart of the Week, we looked at where the data center buildout stands and how the market is pricing the road ahead after the midterm elections.
This week we’re zooming out to what has historically been the most important stretch of the calendar, the fourth quarter, to see what history says about how it plays out in a midterm year.
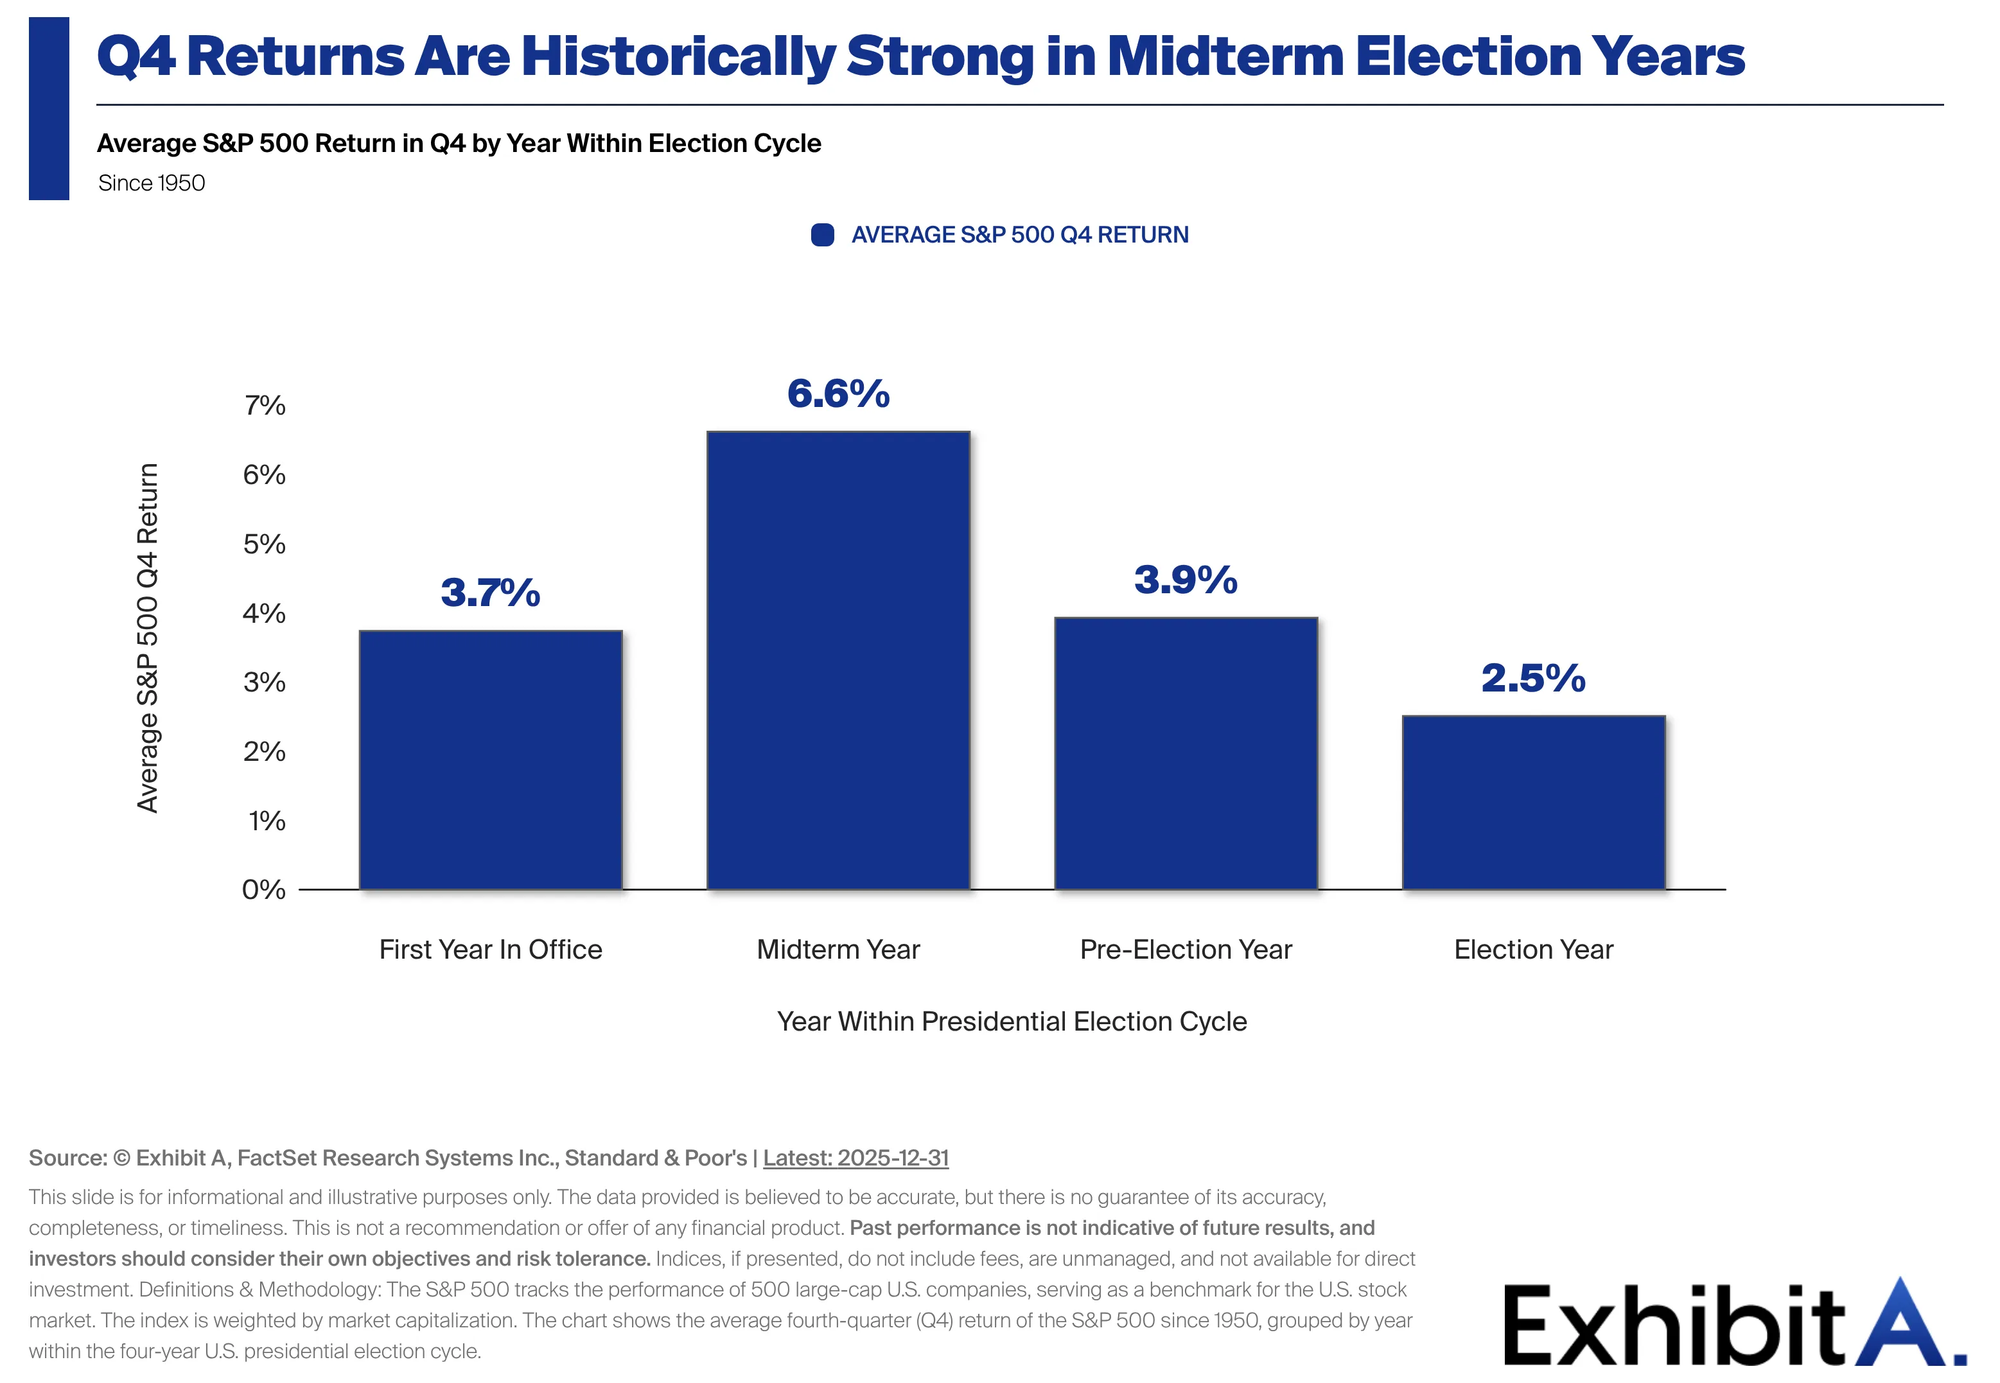
Midterm years have produced the strongest Q4 on average
The chart below shows the S&P 500’s average fourth-quarter return since 1950, broken out by year of the four-year election cycle. The second bar from the left is midterm years, and it stands out with an average Q4 gain of +6.6%, the best of any year in the cycle.
The path matters as much as the destination
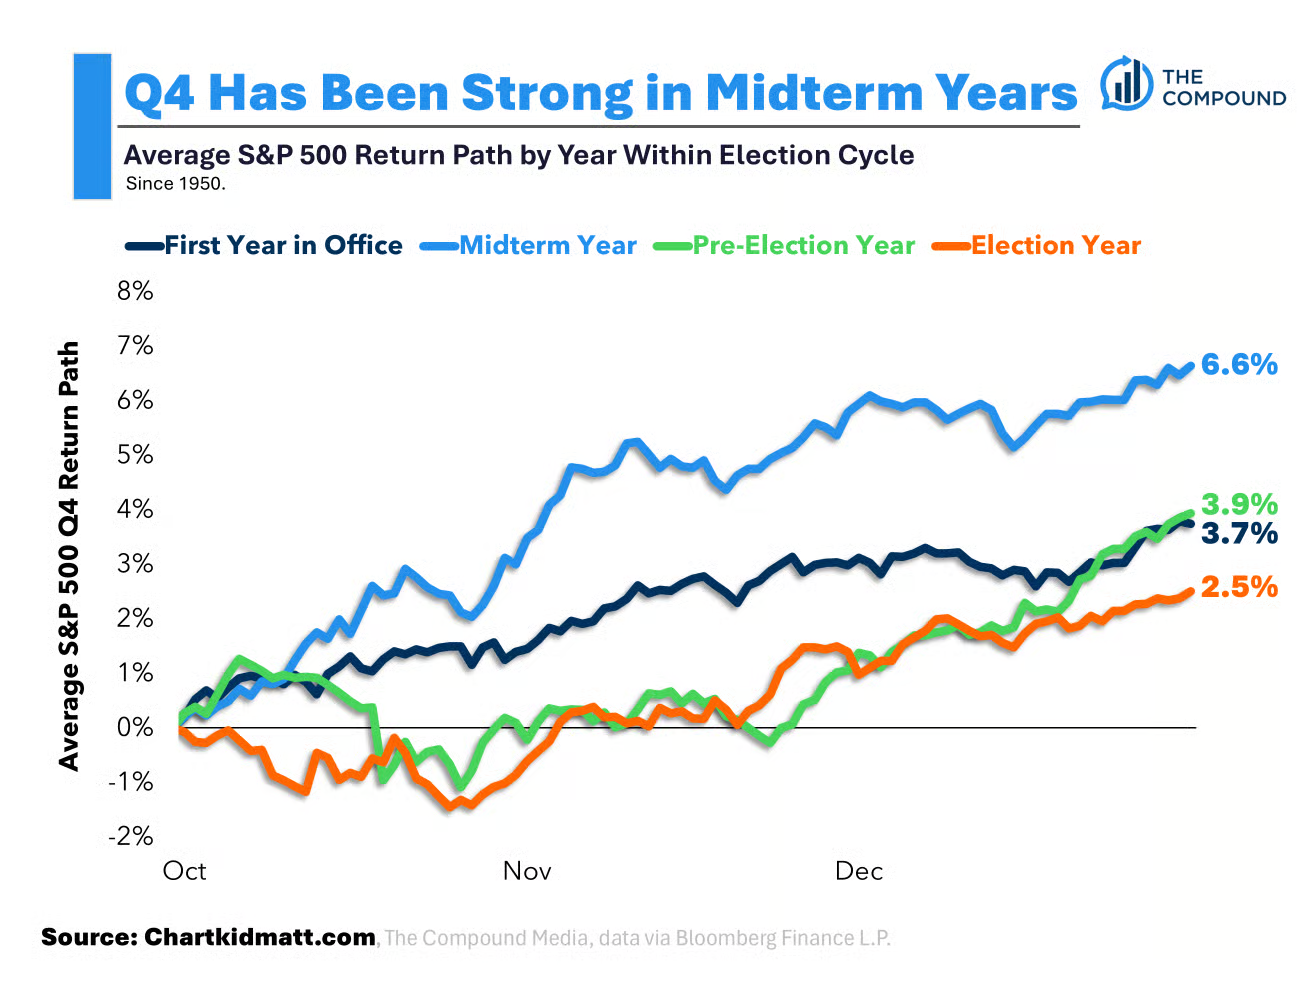
Averages don’t tell the whole story, because no two quarters unfold the same way. The next chart traces the average Q4 path for each year of the cycle. The light blue line is the midterm-year path, which makes it the historical analog for 2026.
A strong record, but not a guarantee
The consistency stands out as much as the average does. Since 1950, 16 of 19 midterm years have ended the fourth quarter higher. So far, 2026 is tracking toward the historical average, with the S&P 500 up roughly 2.2% quarter-to-date as of early October.
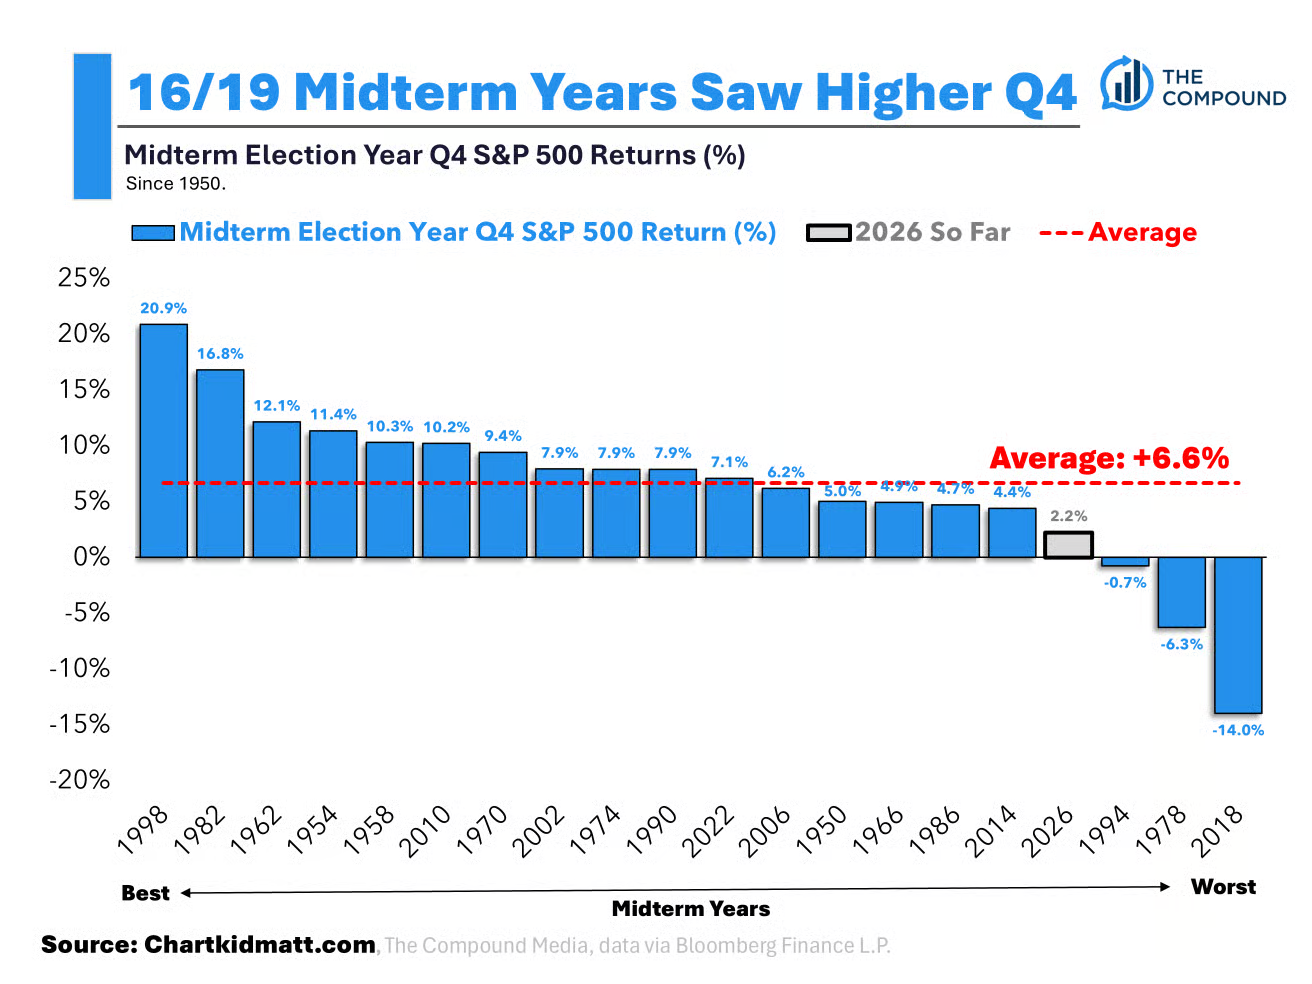
Pretty compelling data component, amidst the seasonality and market noise that follows after digesting the midterm results!
Looking past year-end: the 12 months after a midterm
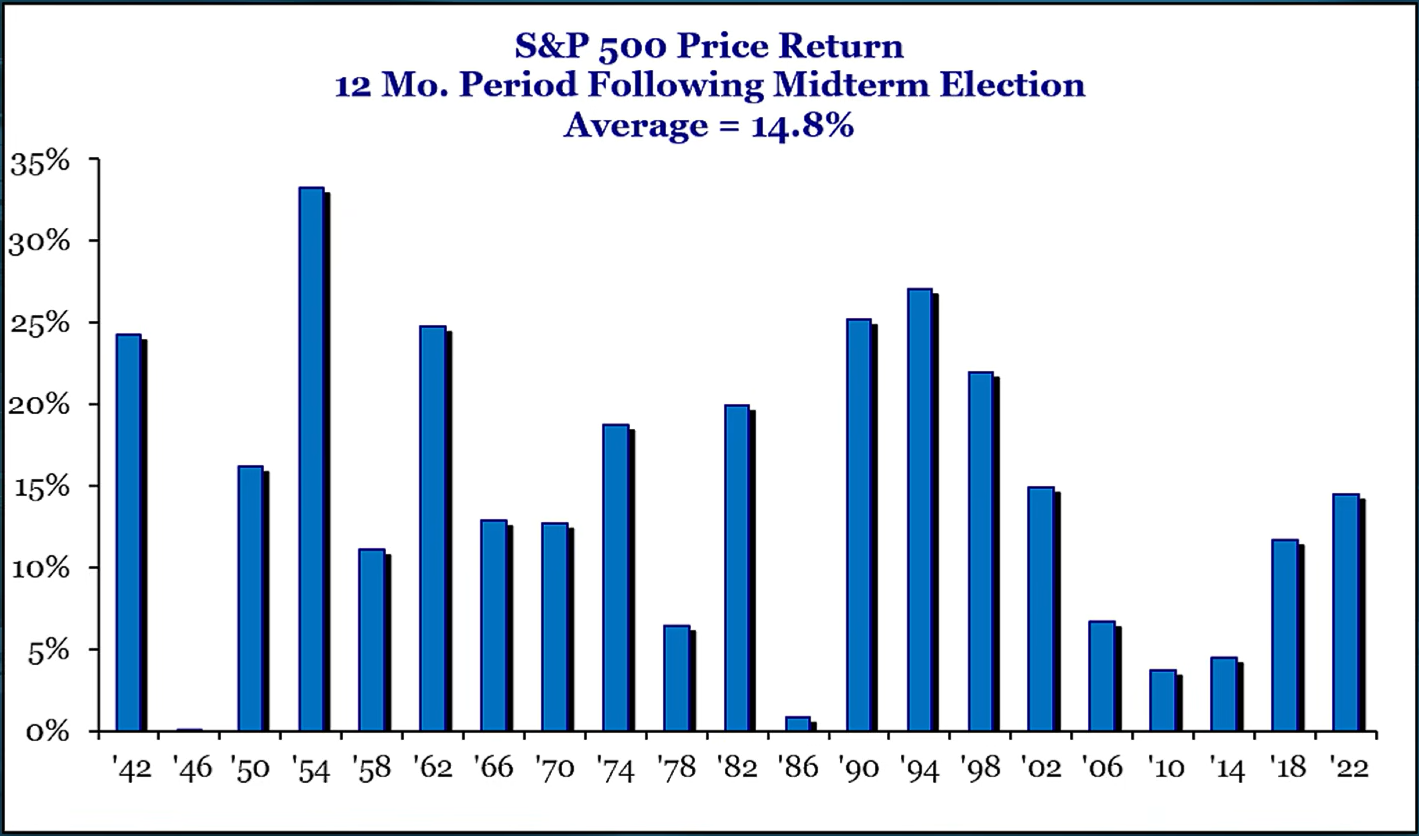
Historically, the strength hasn’t stopped on December 31. The chart below from Baird Strategas tracks the S&P 500 over the 12 months following each midterm election since 1942. The index has averaged a +14.8% gain over that window, and it hasn’t posted a loss after any of the 21 midterms shown. The weakest stretch, after 1946, was roughly flat, while the strongest, after 1954, topped +30%. The most recent, after 2022, was right in line with the long-run average.
The takeaway
As markets digest the midterm results, there will be plenty of short-term noise. Seasonality isn’t a forecast, but history makes a strong case that the calendar has tended to work in investors’ favor at this point in the cycle. We’ll keep watching how 2026 compares with its historical playbook as the year winds down.
Past performance is not indicative of future results. The figures shown are historical averages and are not a prediction of future market returns.
Market Data
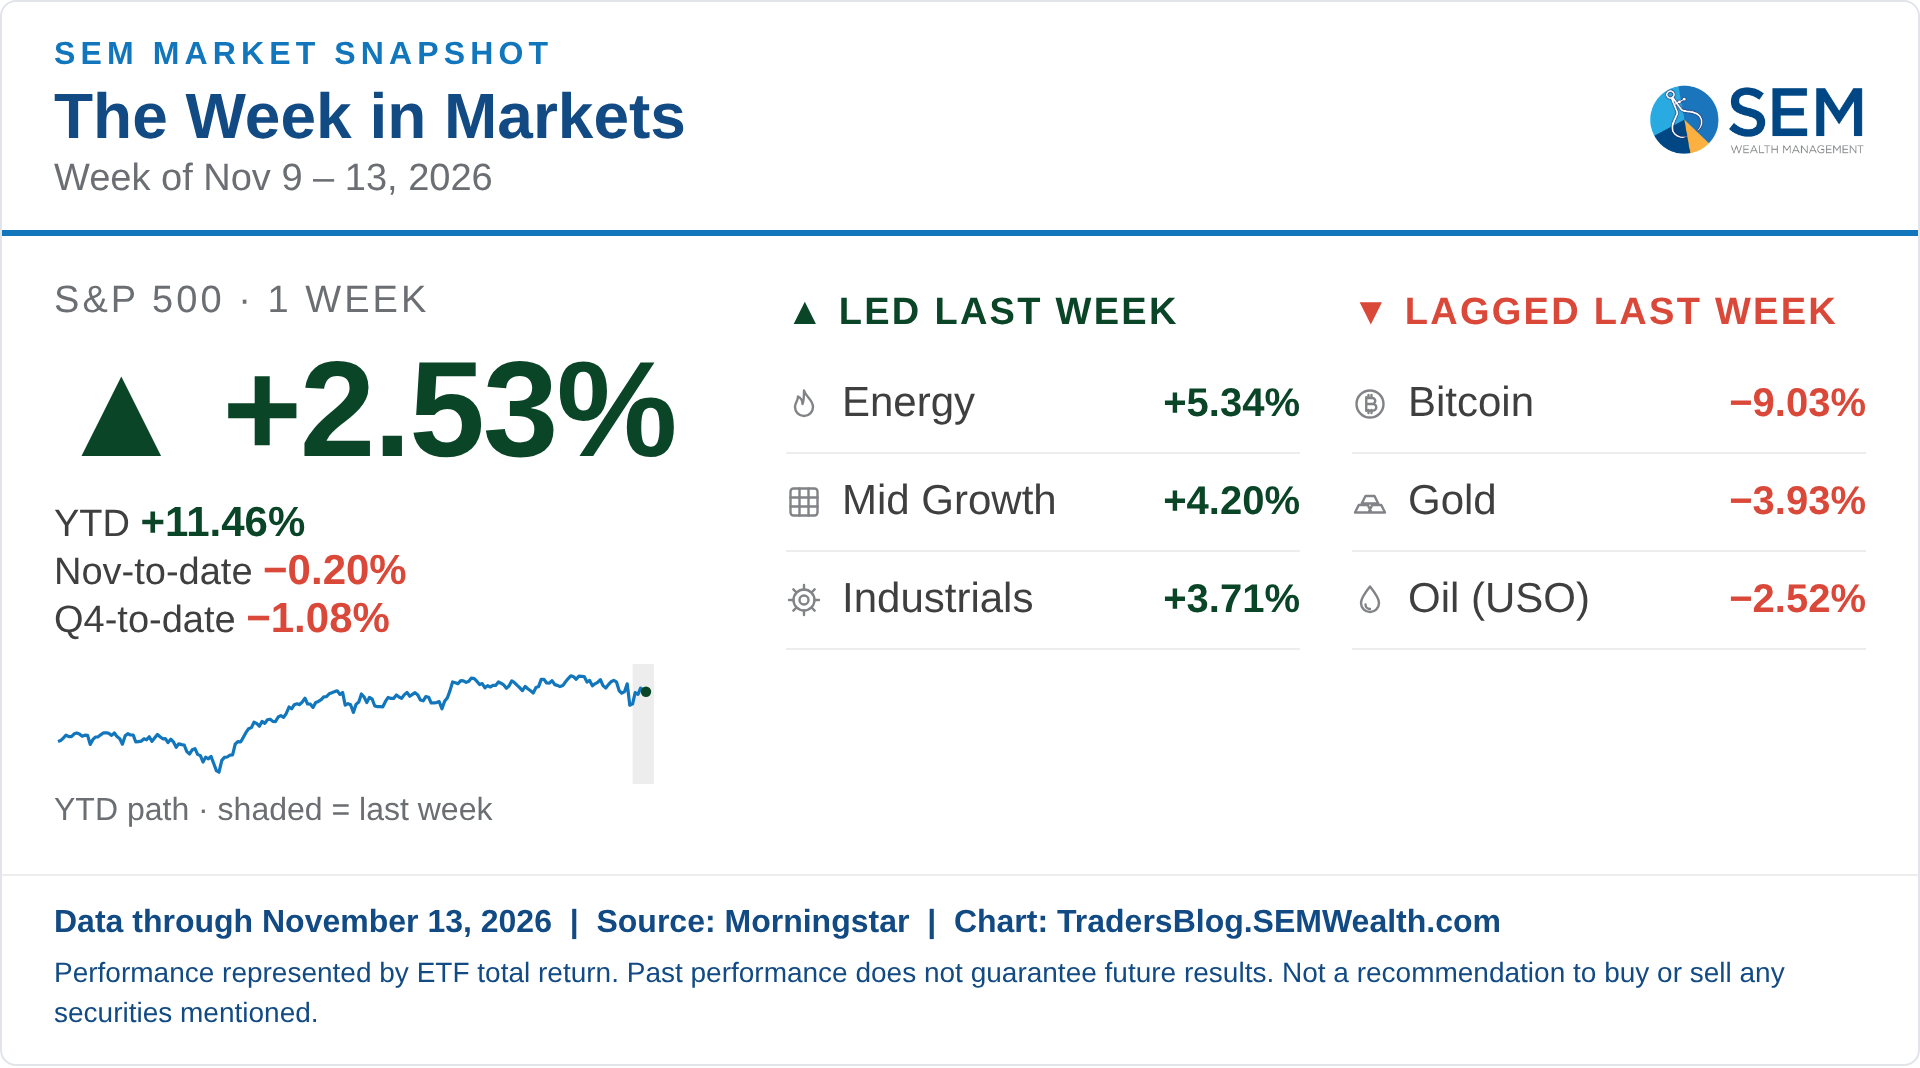
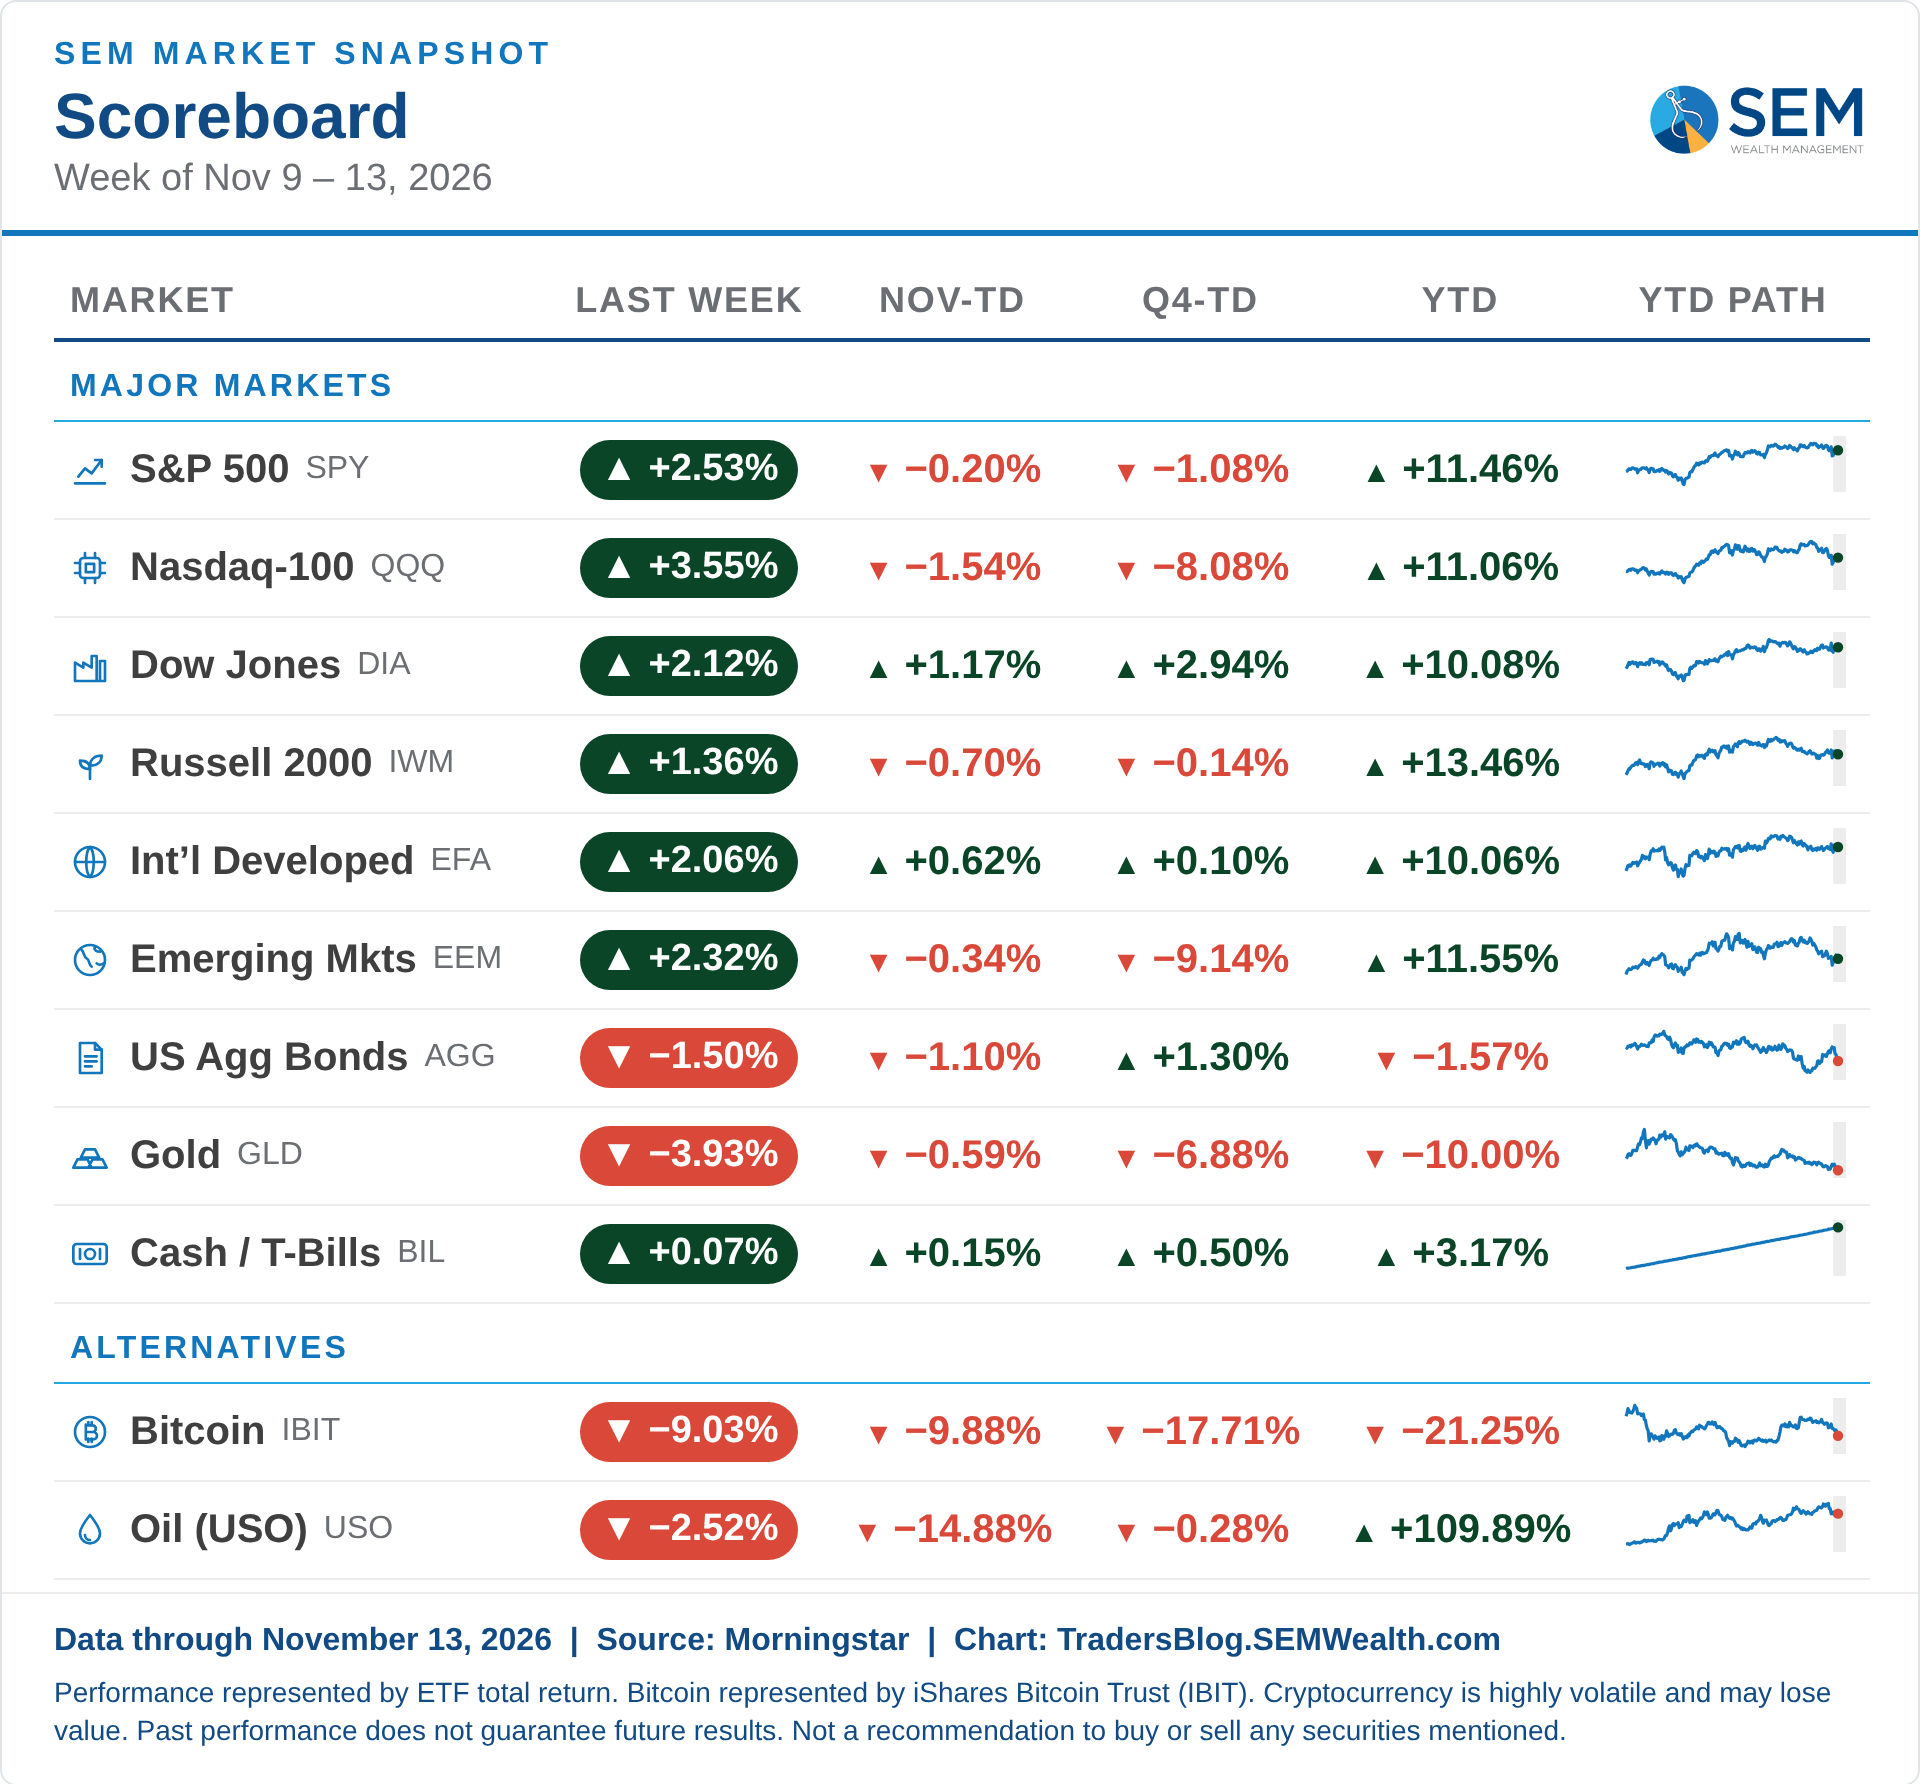
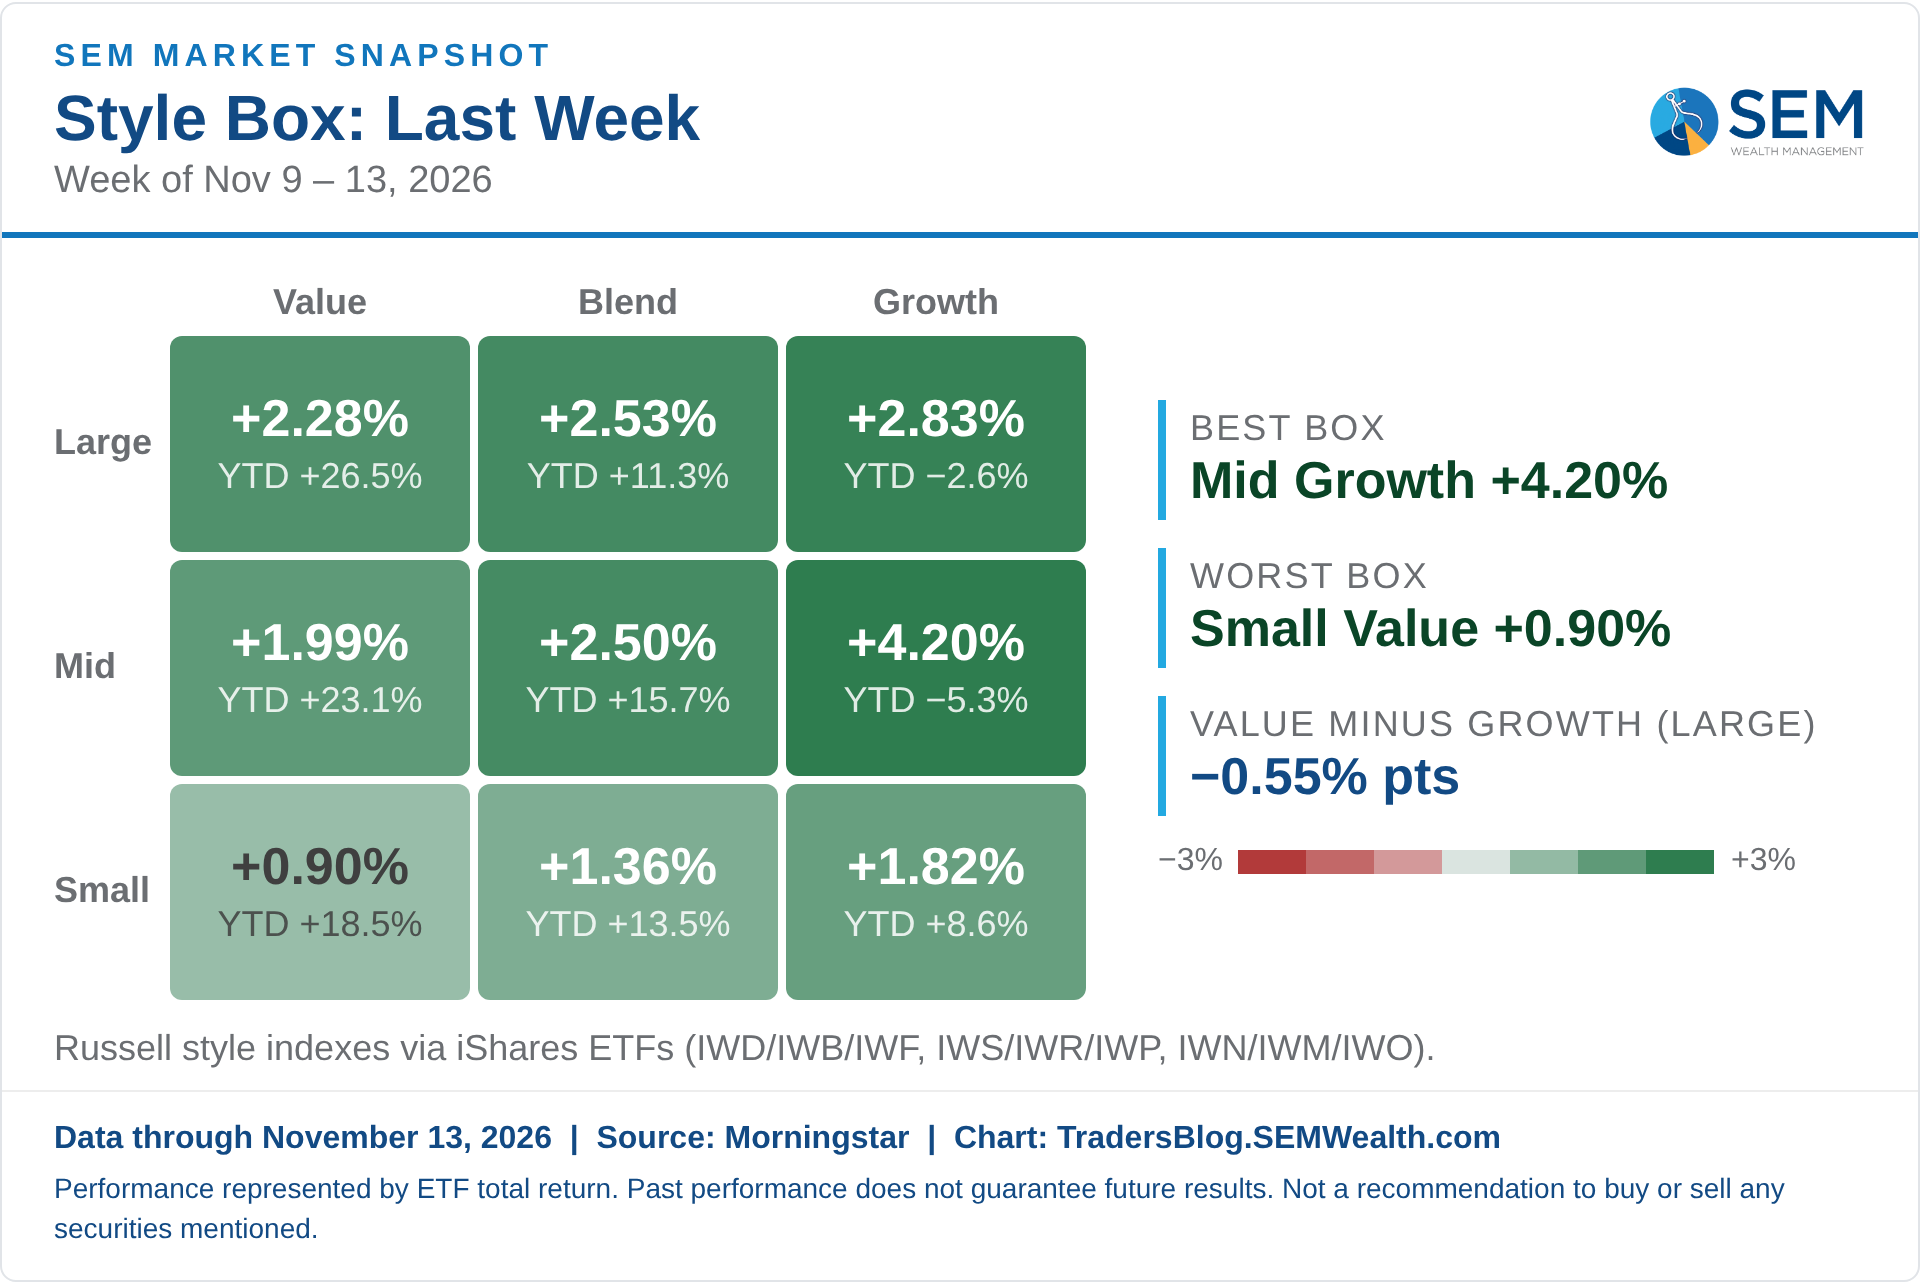
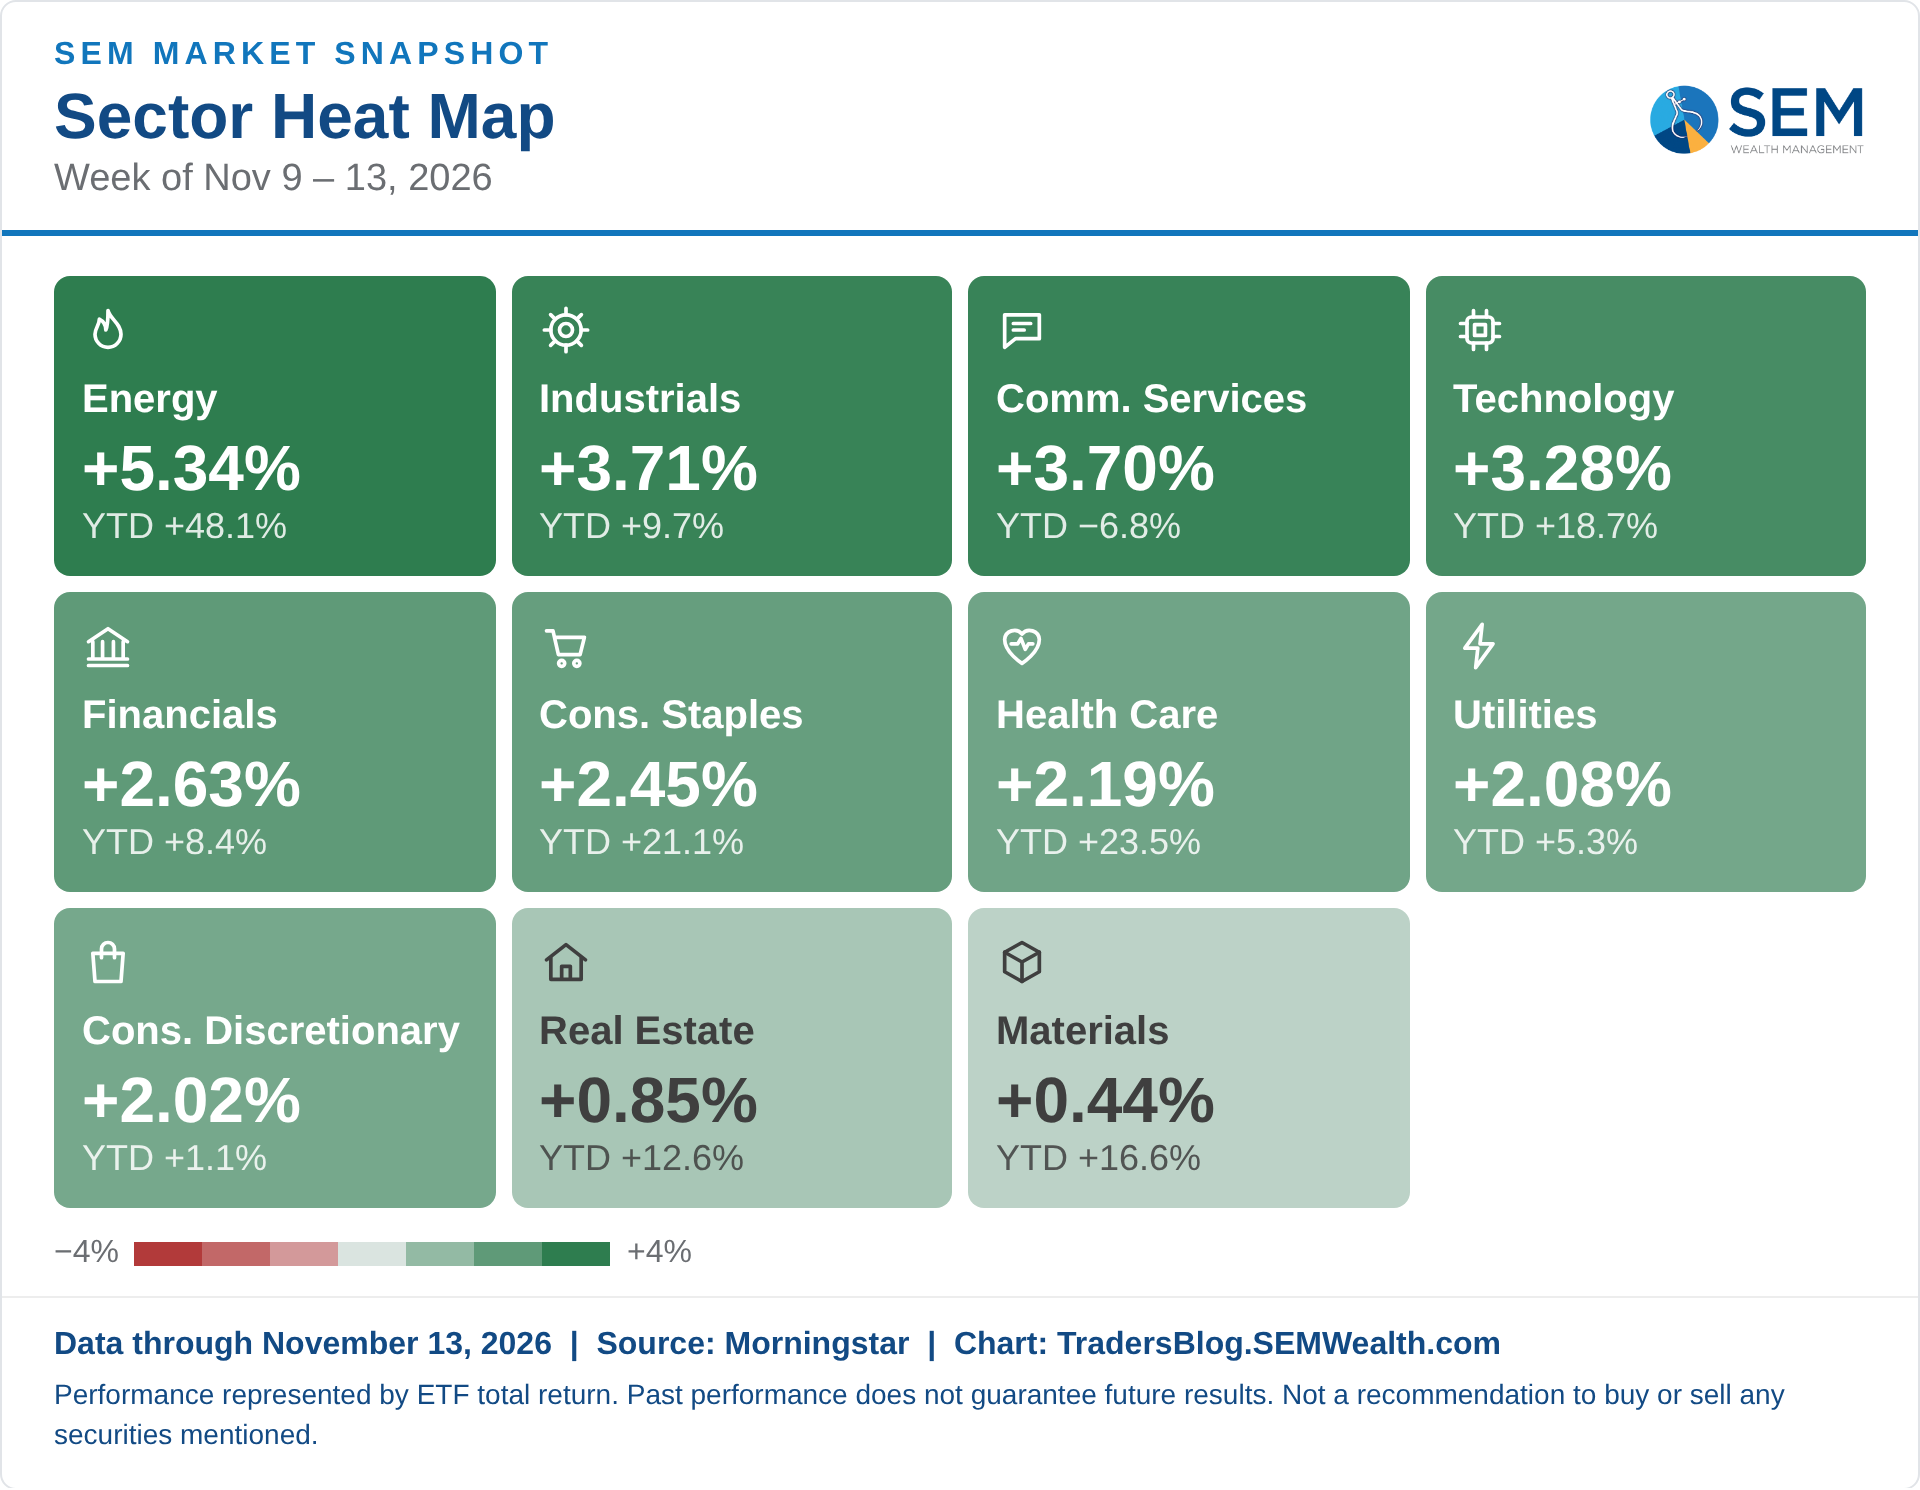
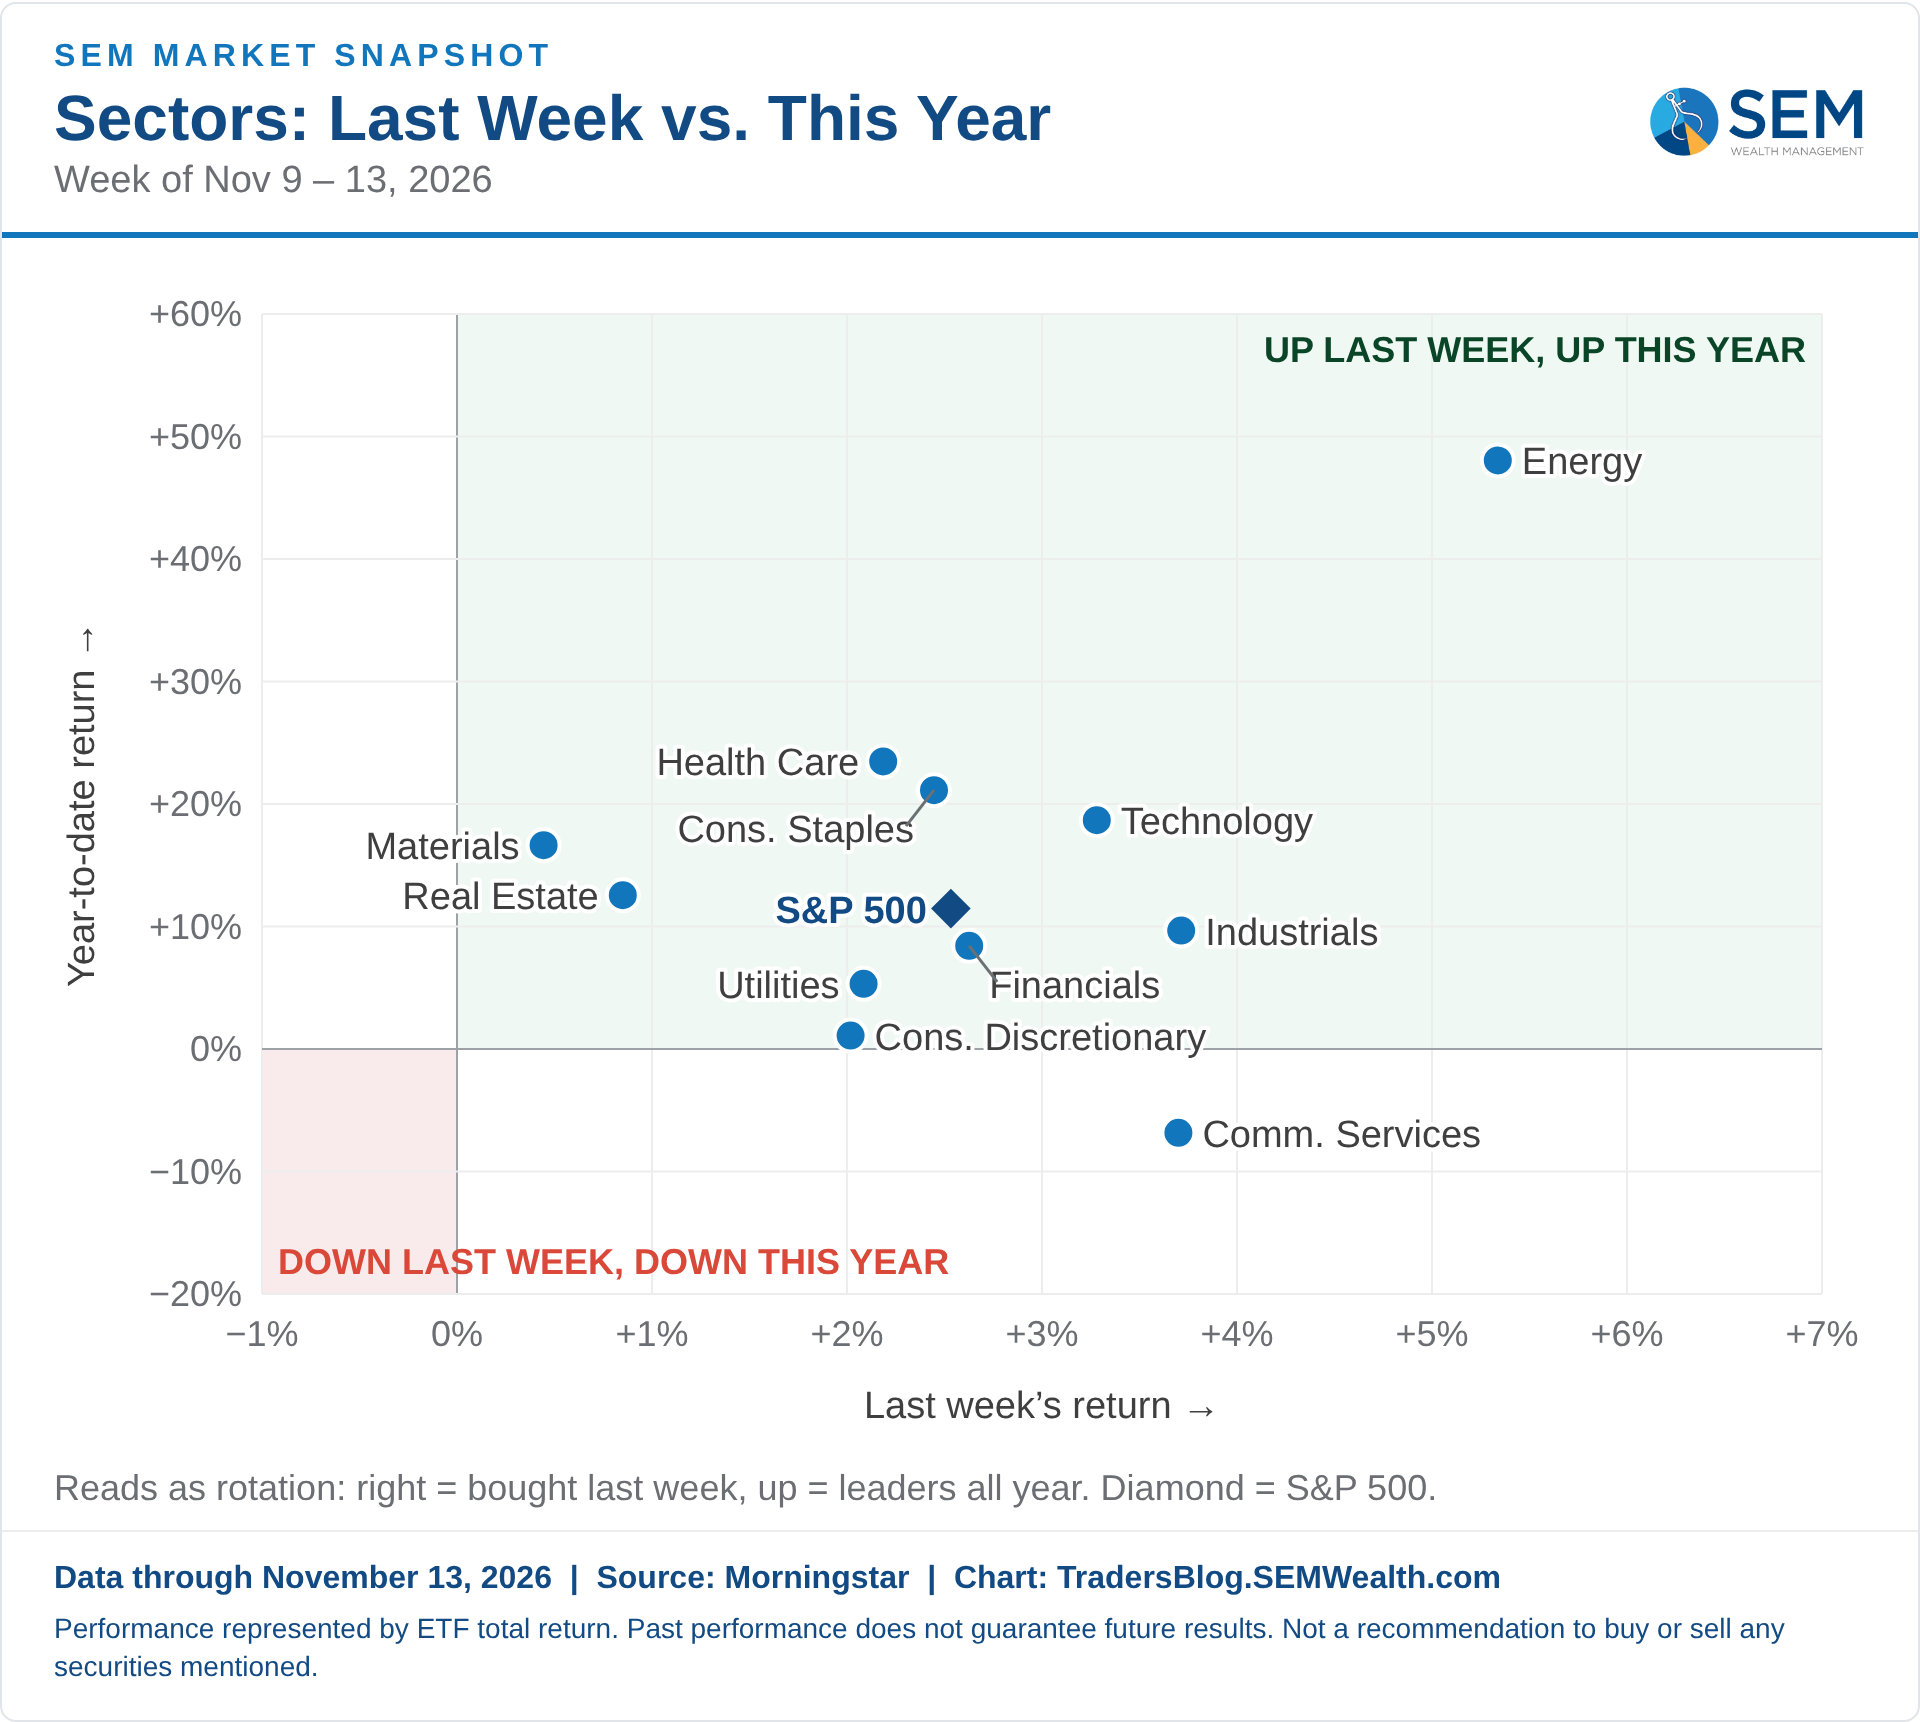
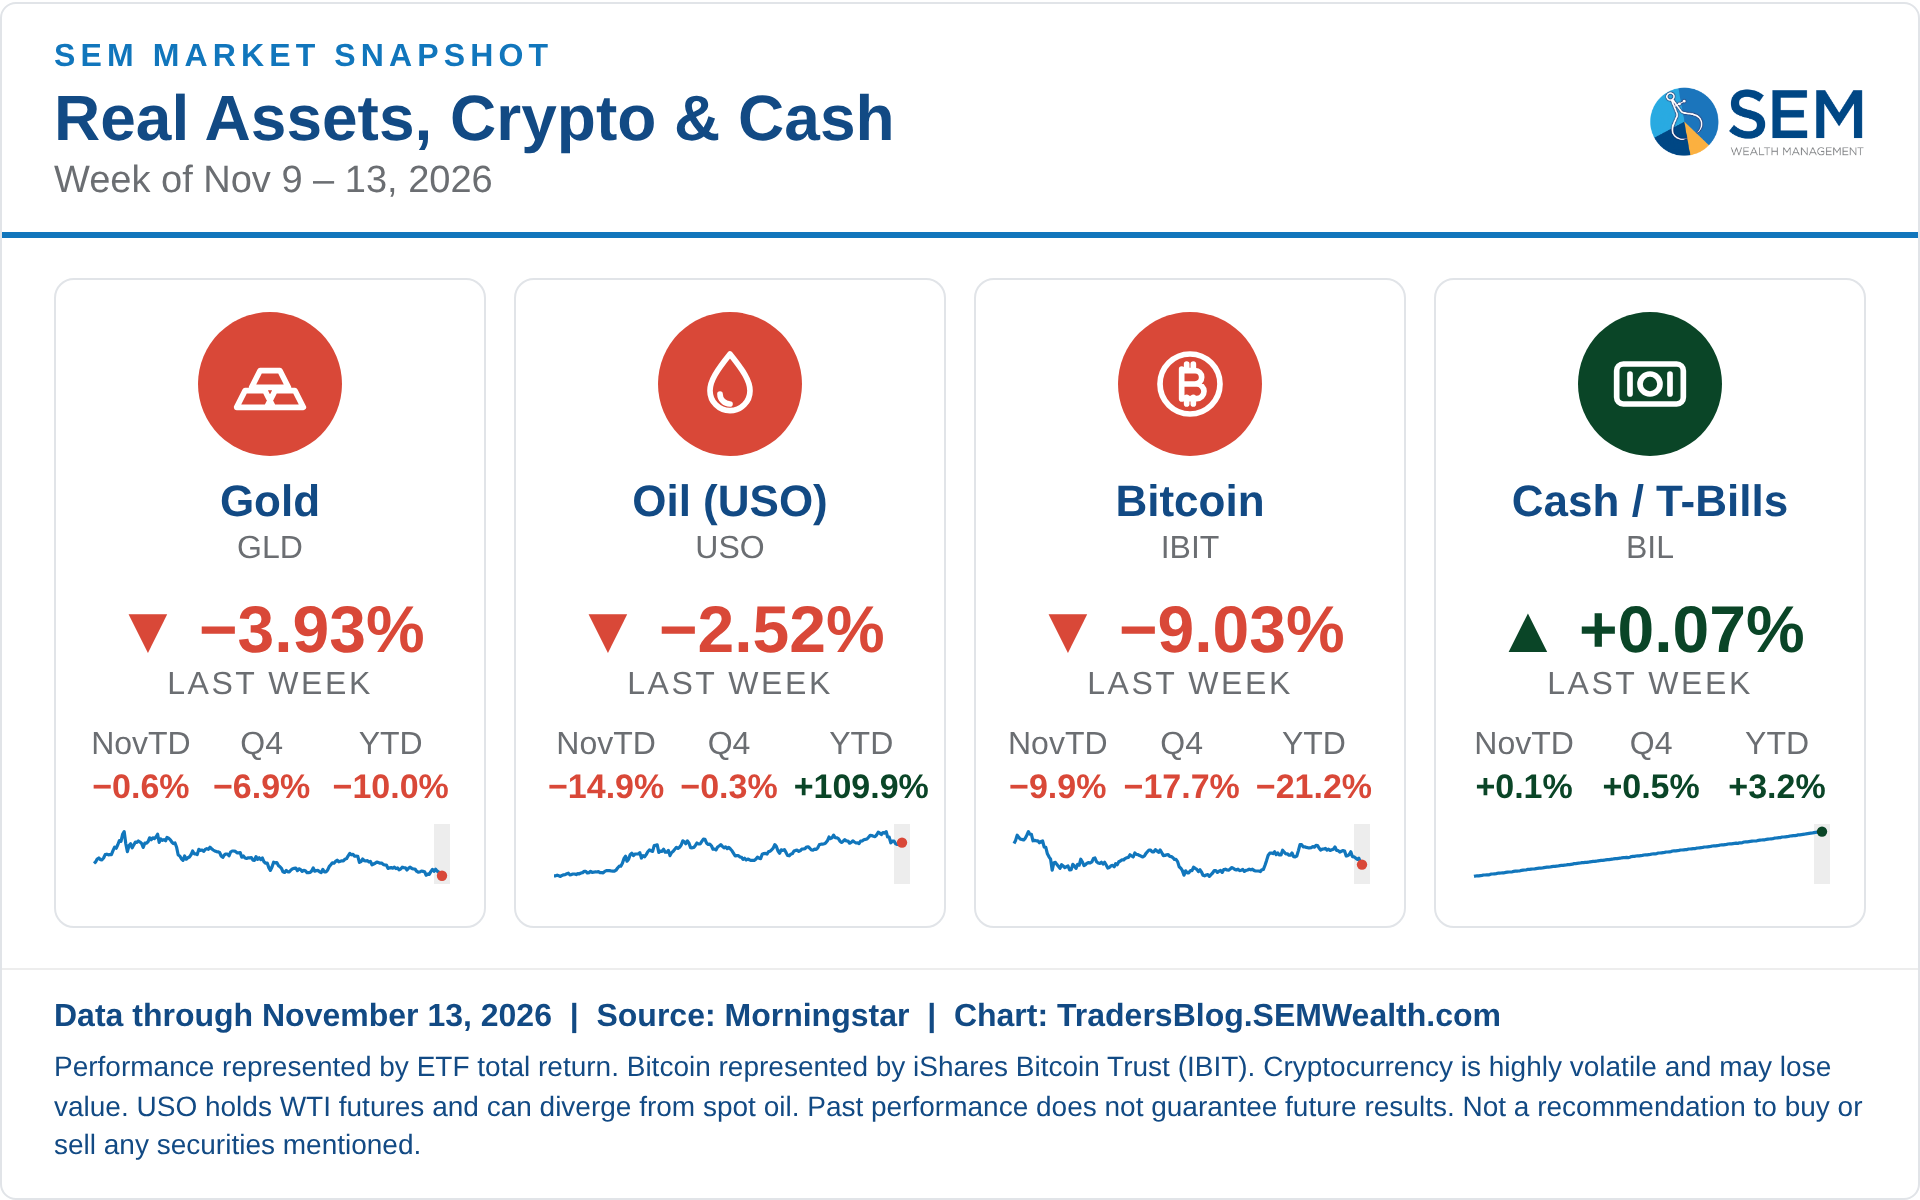
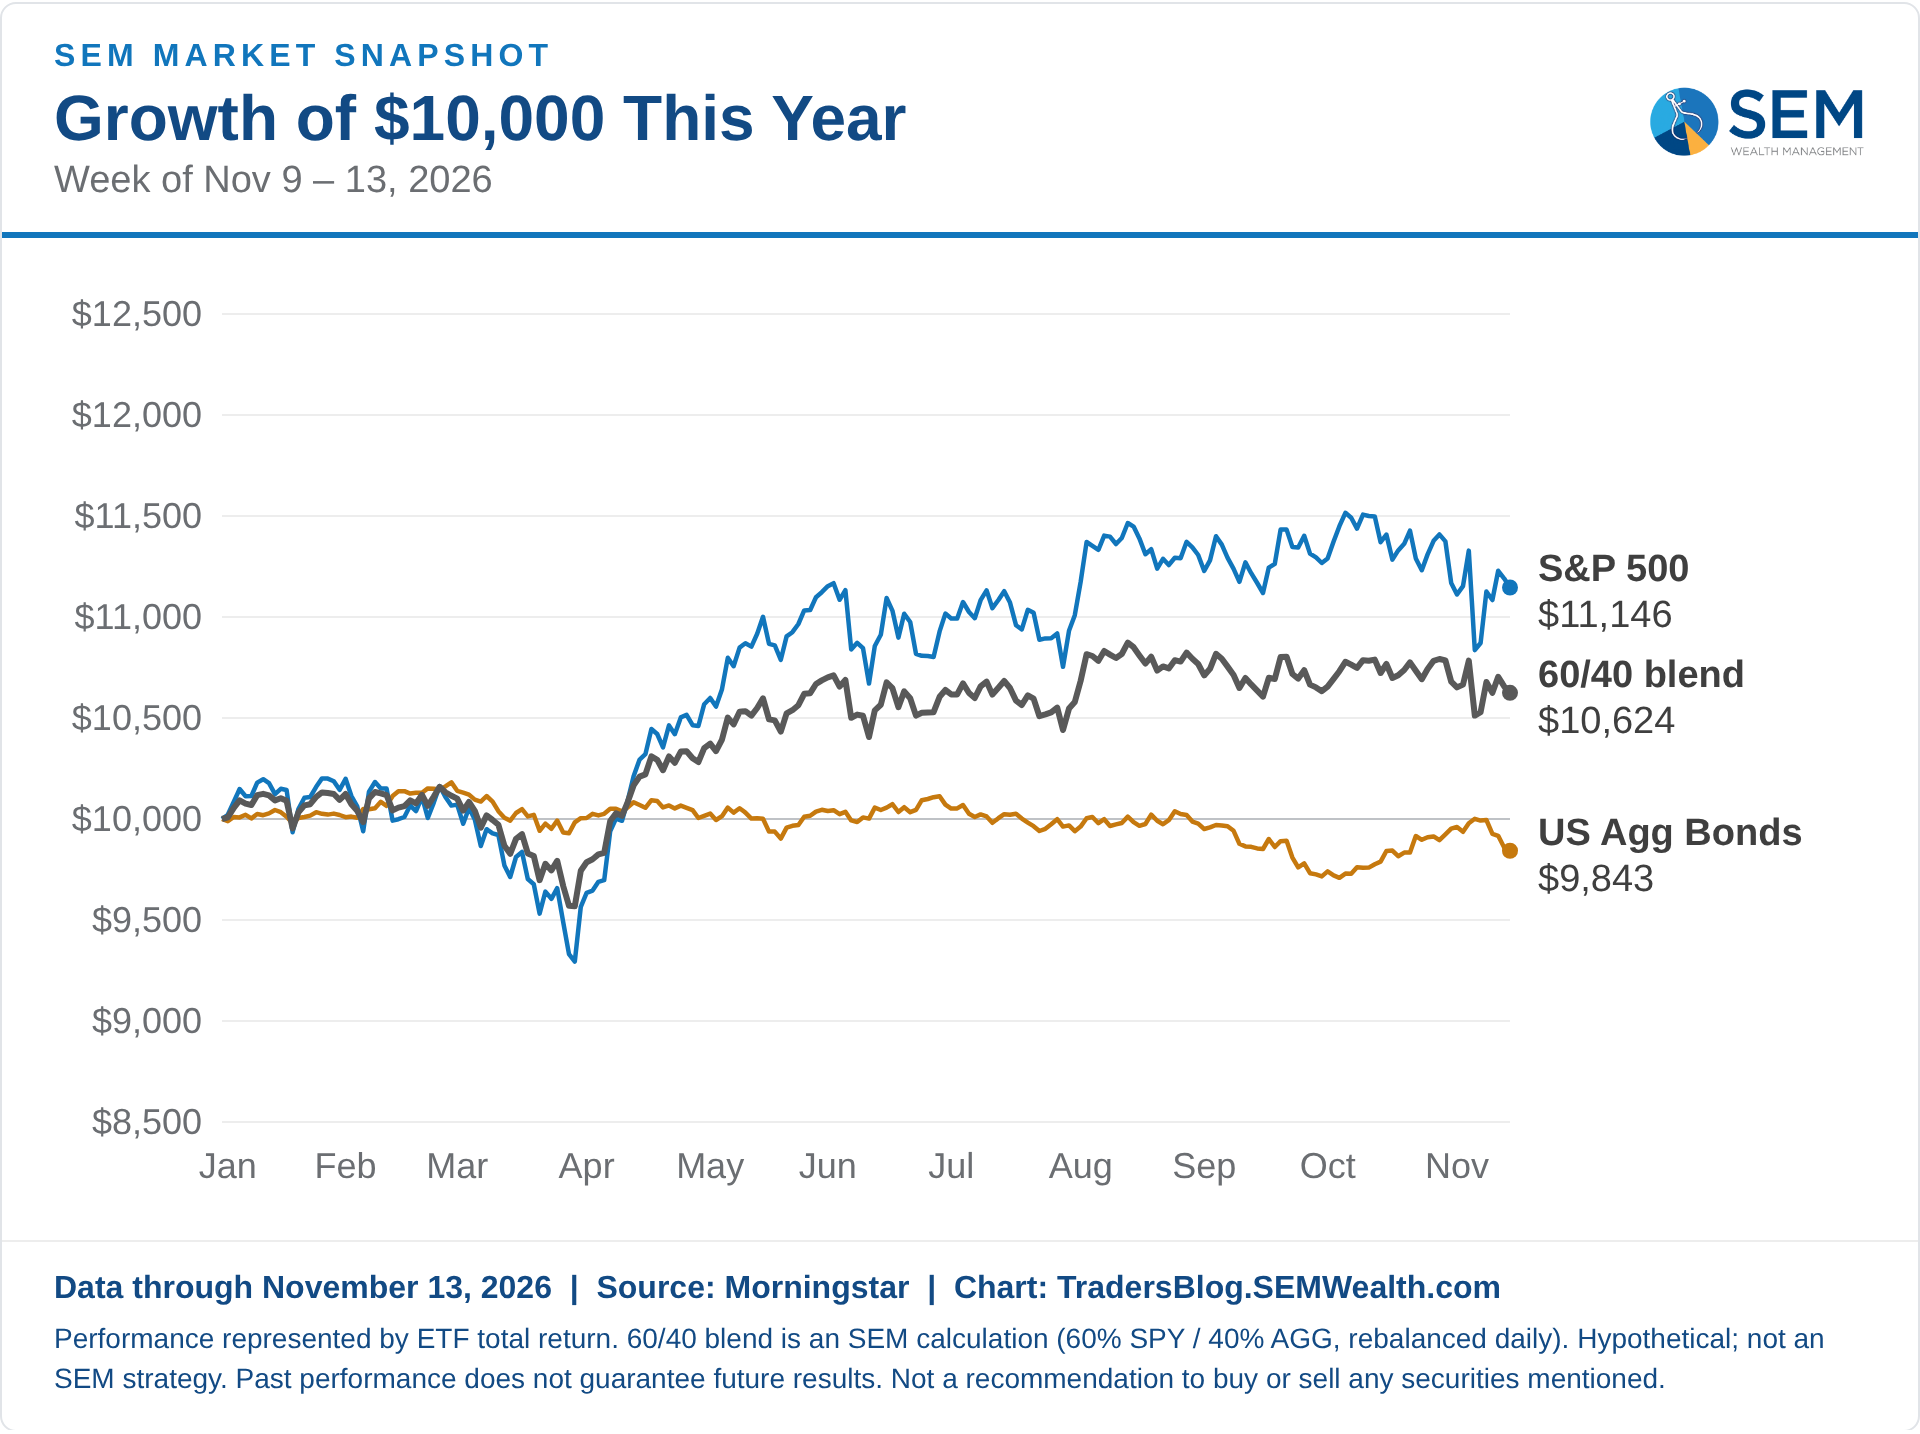
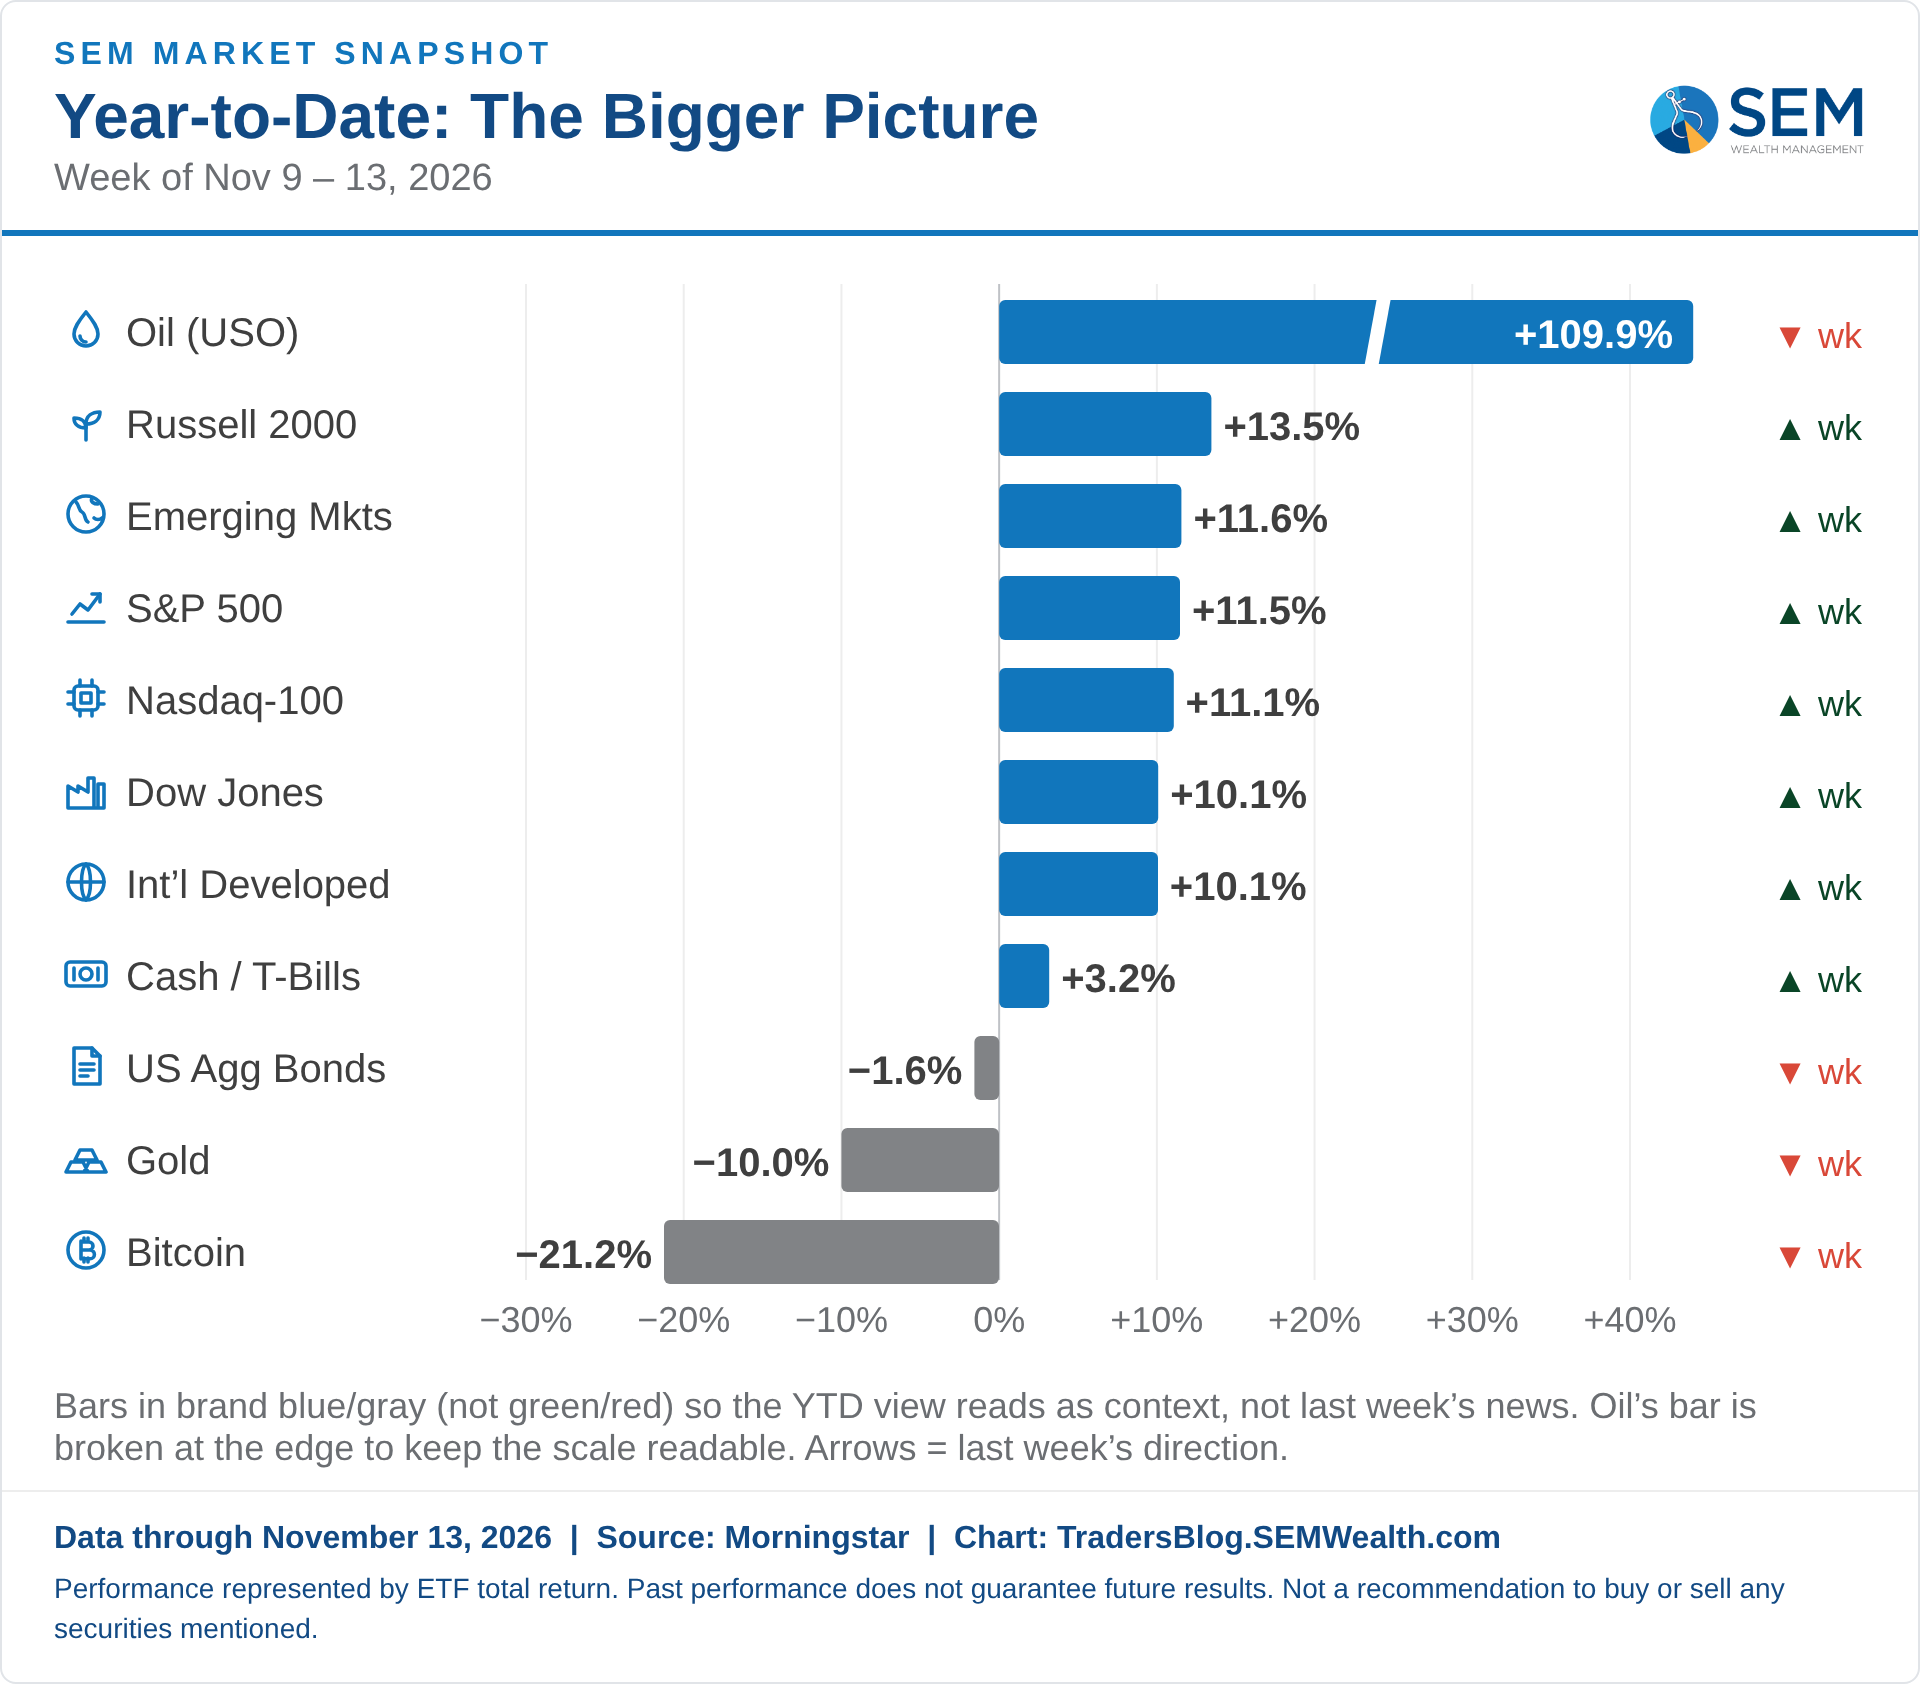
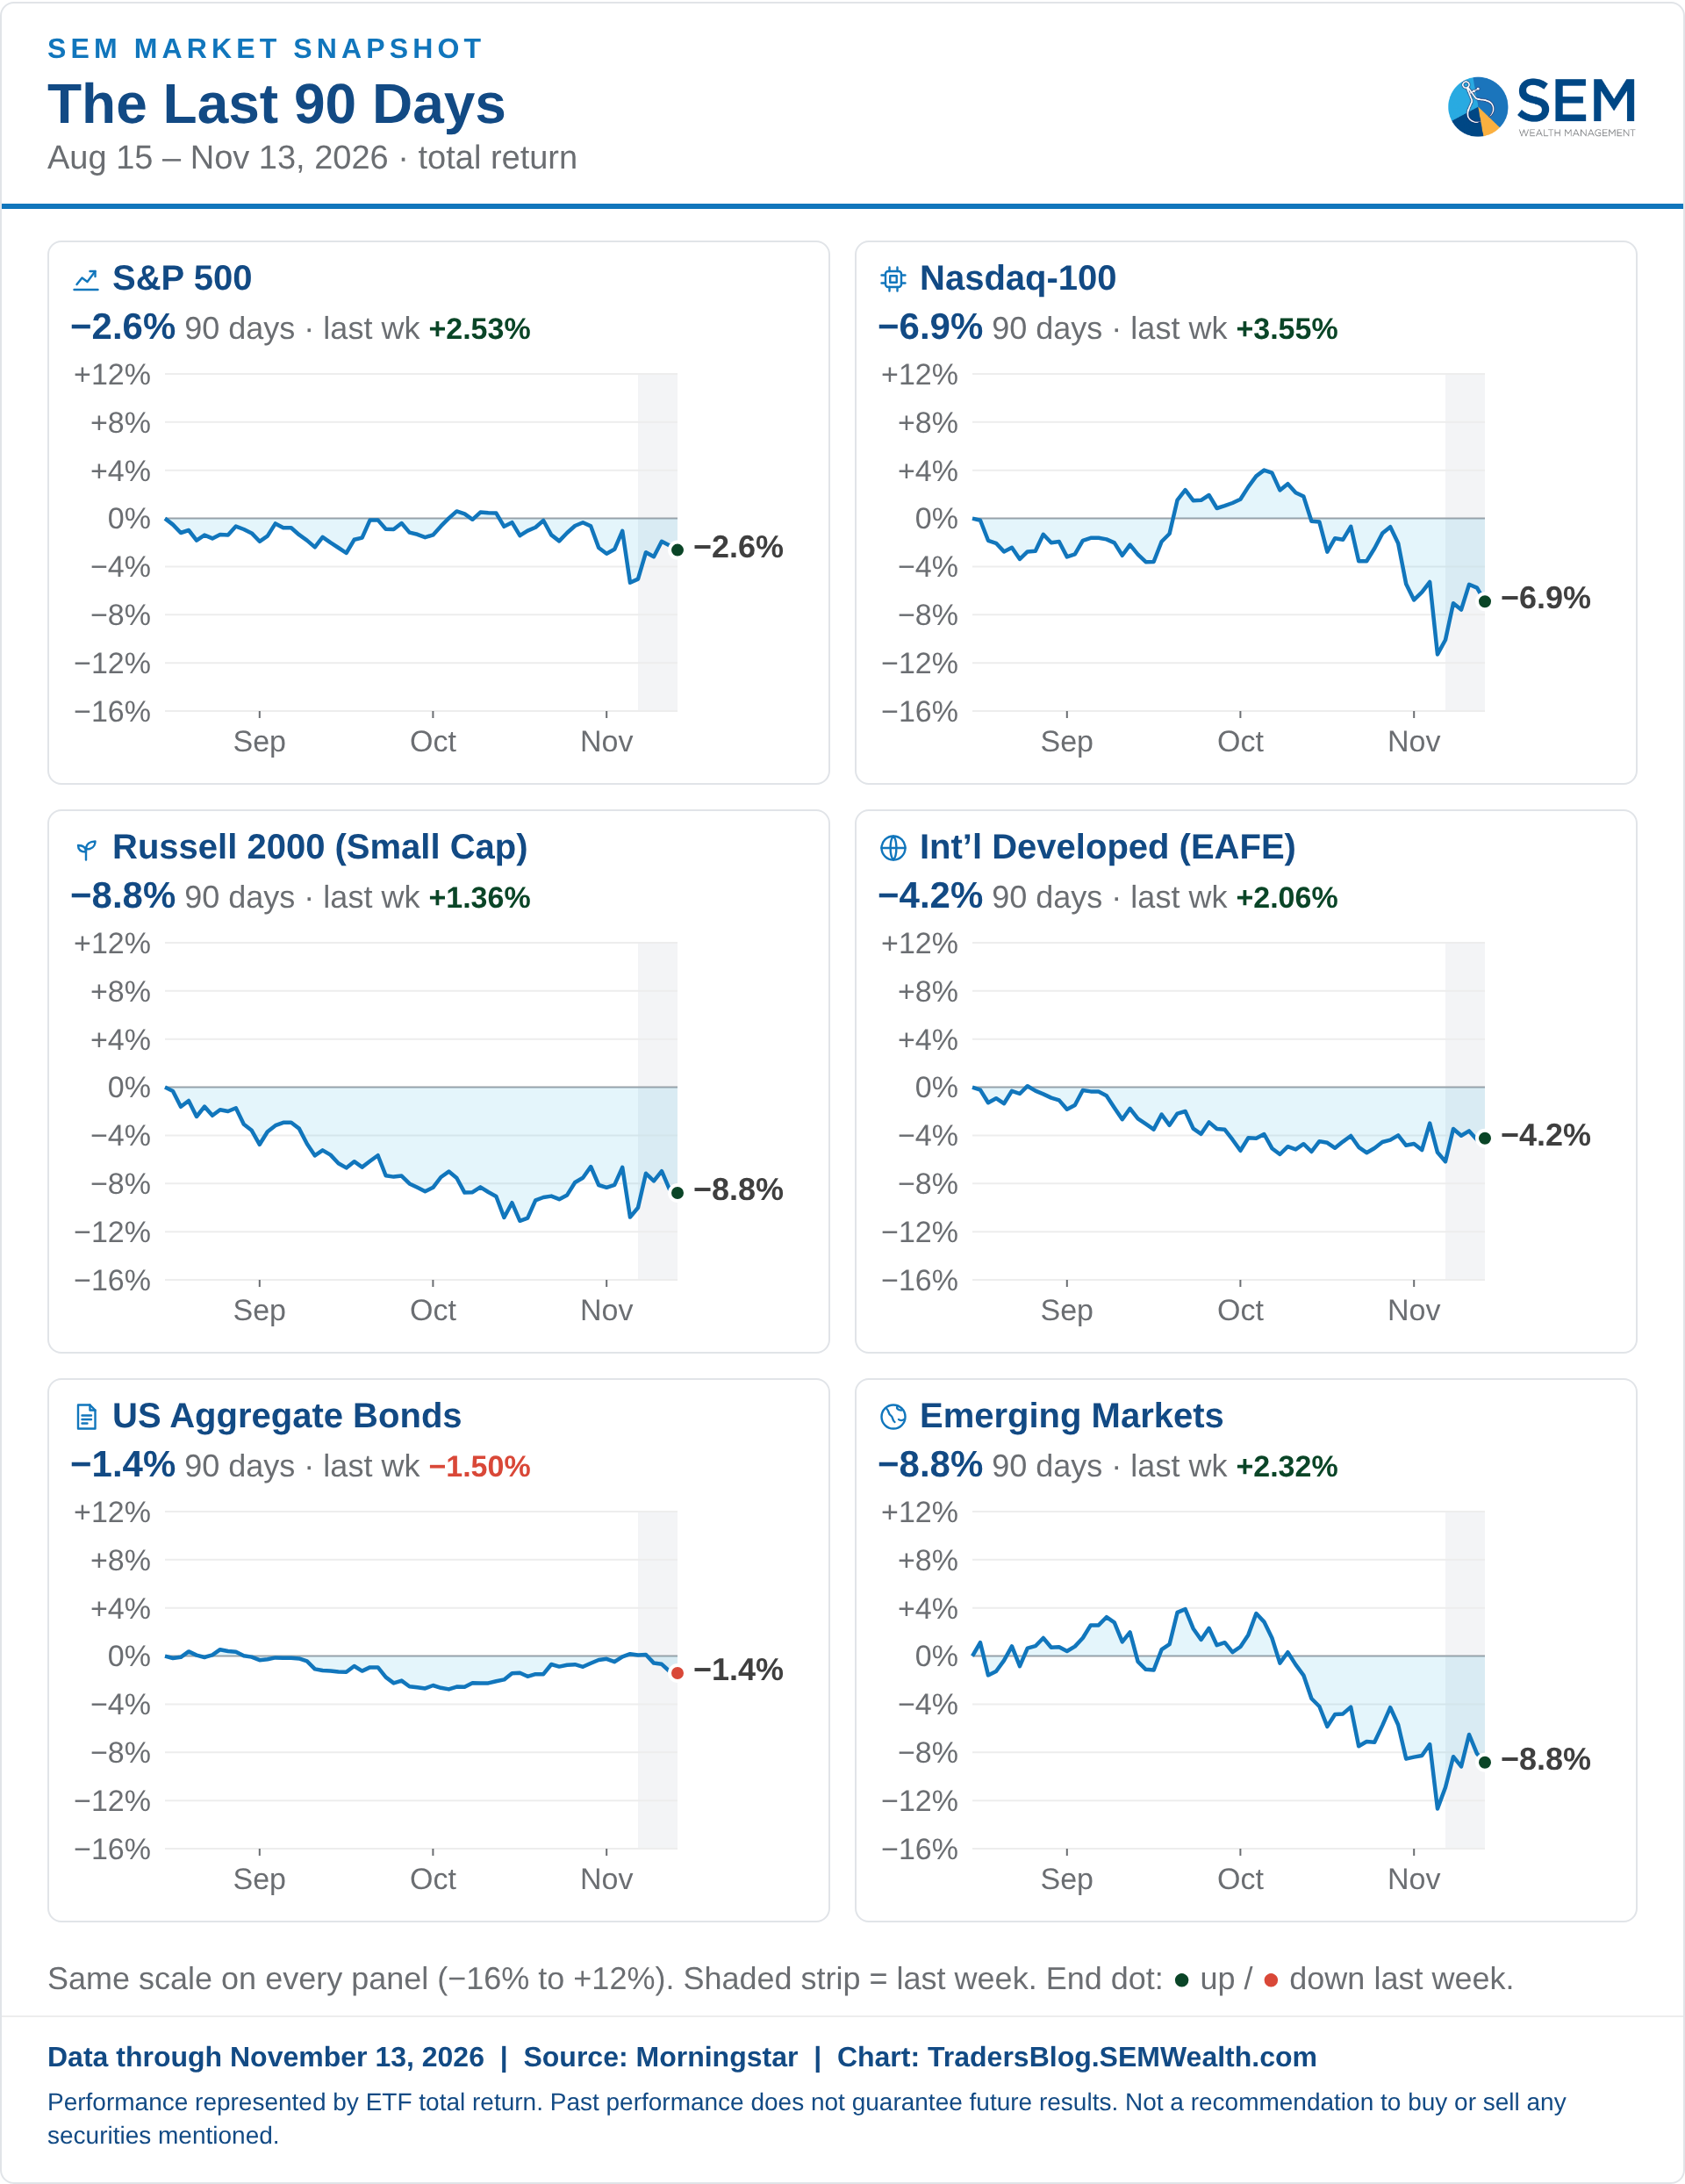
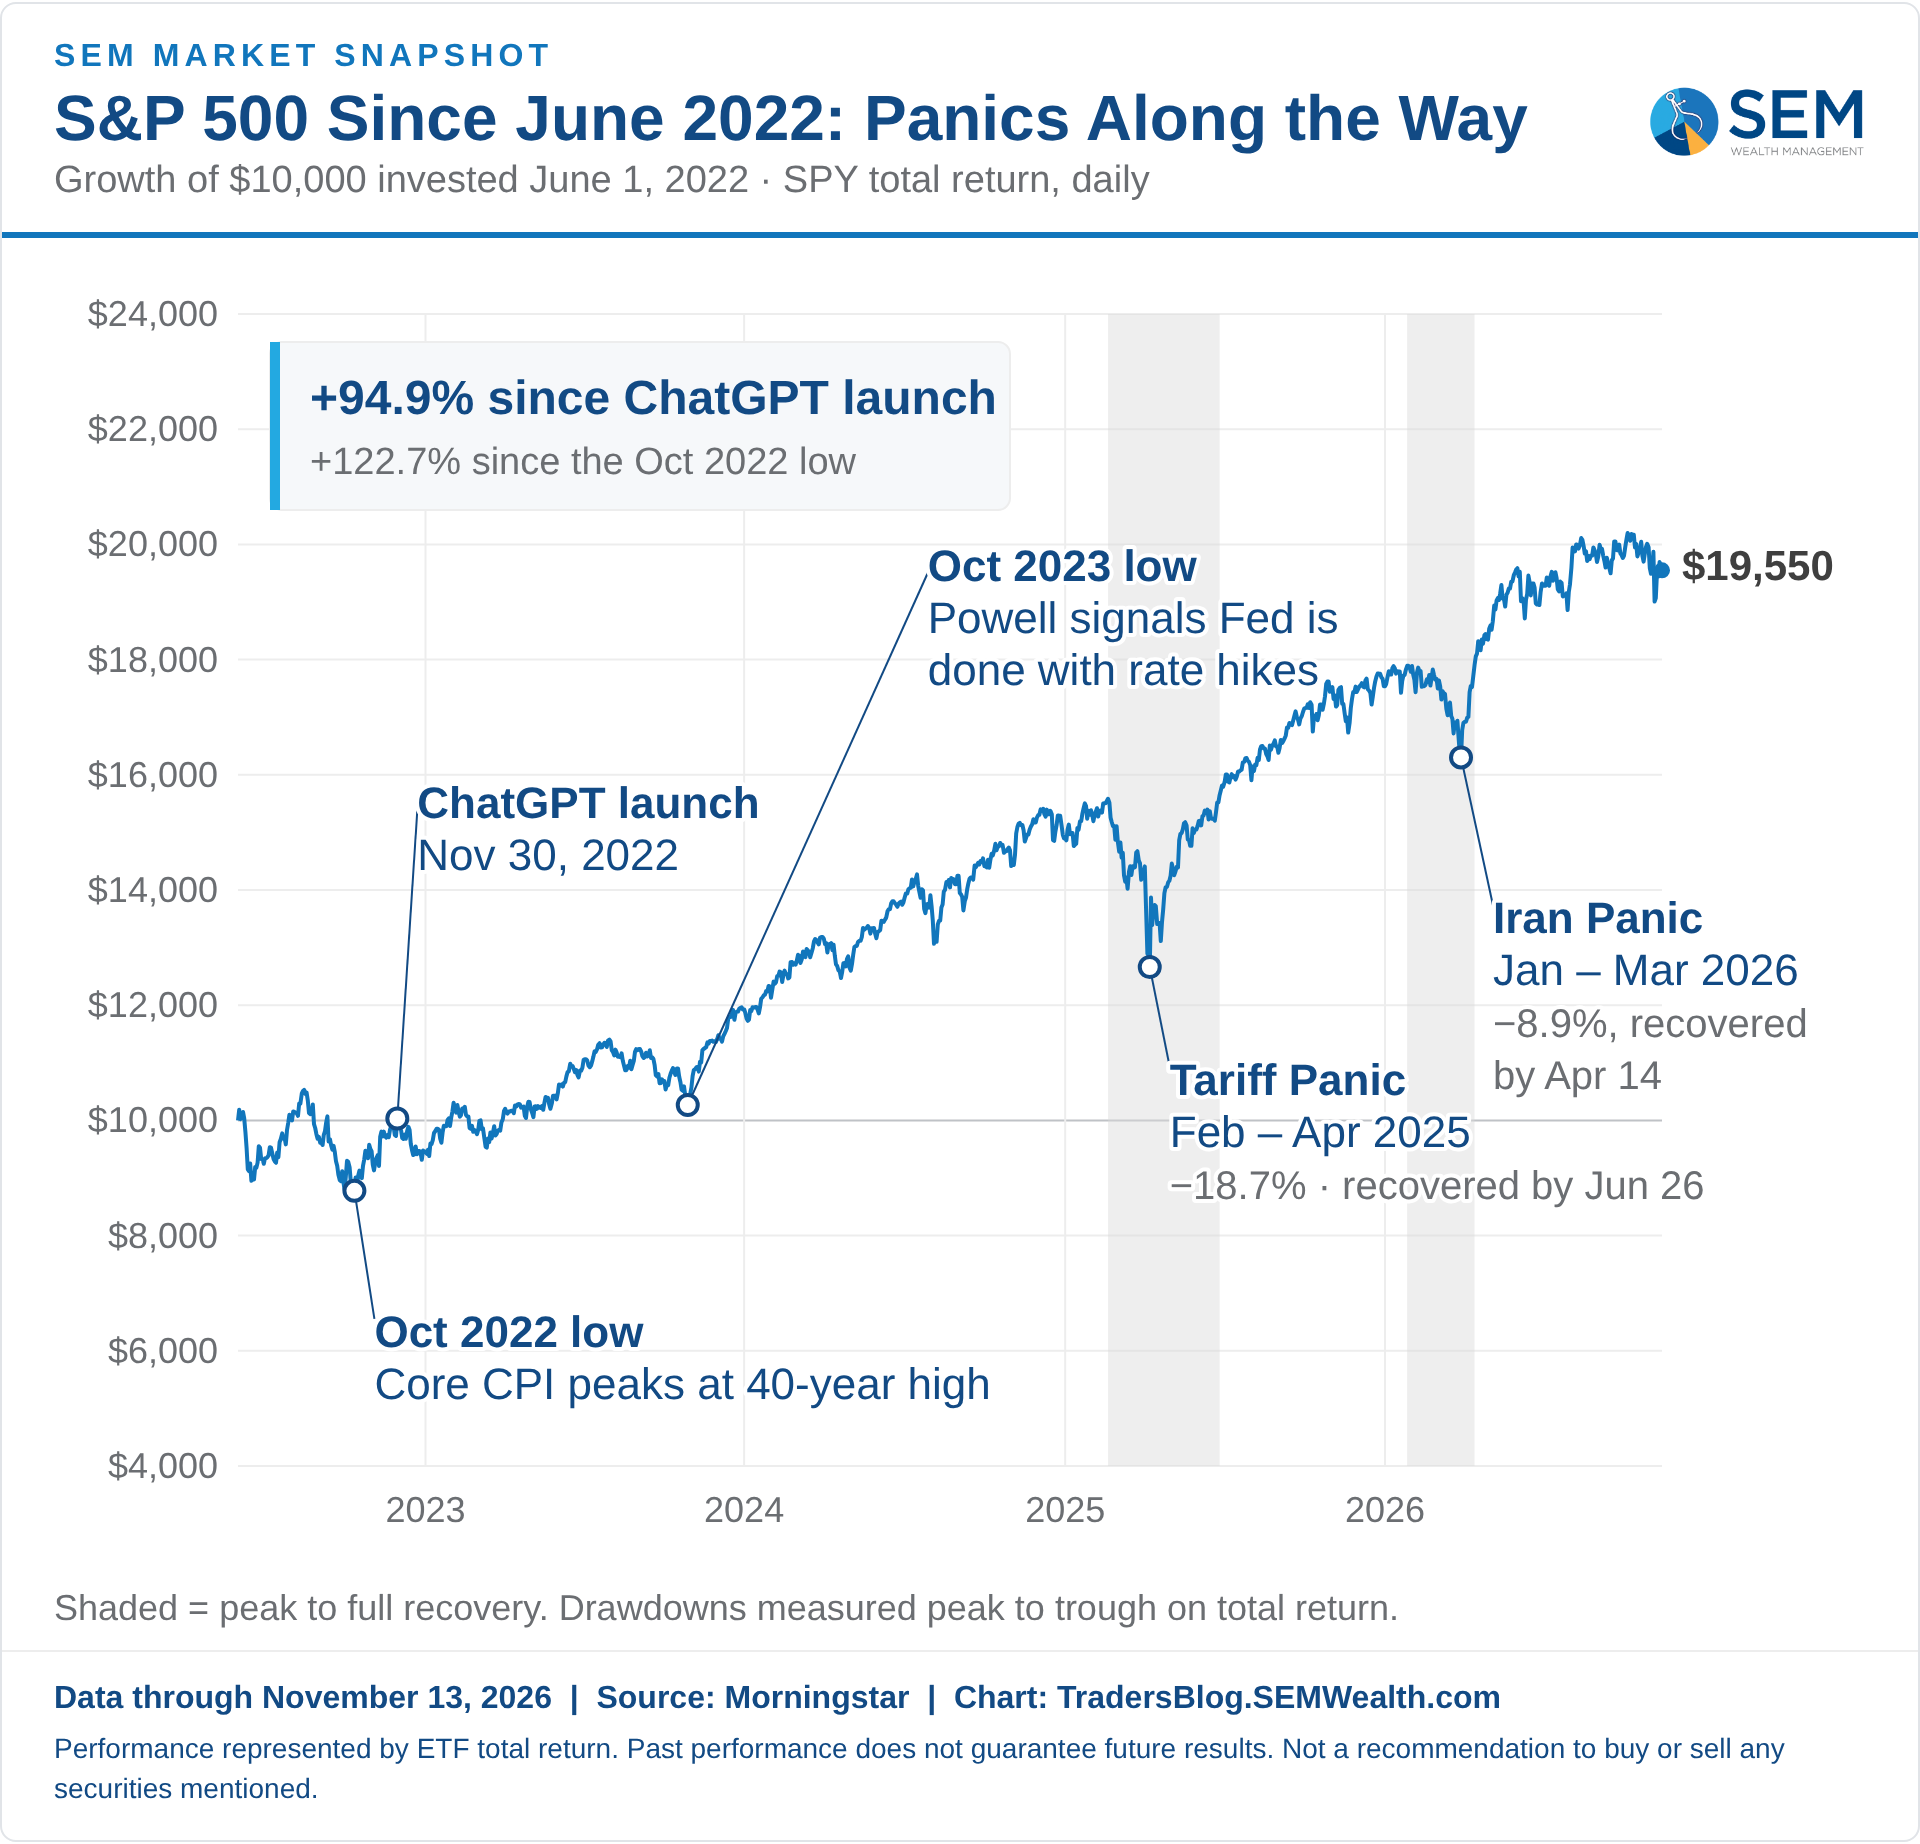
U.S. stocks were higher last week: the S&P 500 rose 2.5%, the Nasdaq-100 jumped 3.6%, the Dow rose 2.1% and small caps (Russell 2000) rose 1.4%. Growth beat value while large caps outpaced small caps, with mid growth best in the style box (+4.2%) and small value worst (+0.9%); energy led the sectors (+5.3%) and materials lagged (+0.4%). Elsewhere, bonds fell 1.5%, gold dropped 3.9%, oil fell 2.5% and bitcoin dropped 9.0%; the S&P 500 is up 11.5% so far this year.
SEM Market Positioning
SEM deploys 3 distinct approaches – Tactical, Dynamic, and Strategic. These systems have been described as 'daily, monthly, quarterly' given how often they may make adjustments. Here is where they each stand.
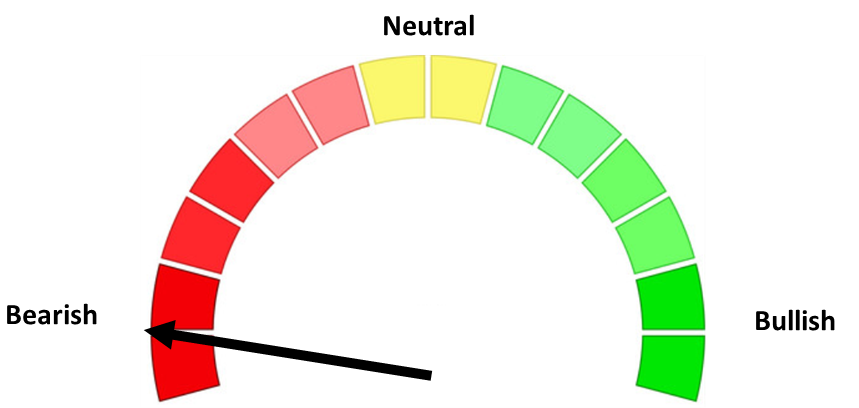
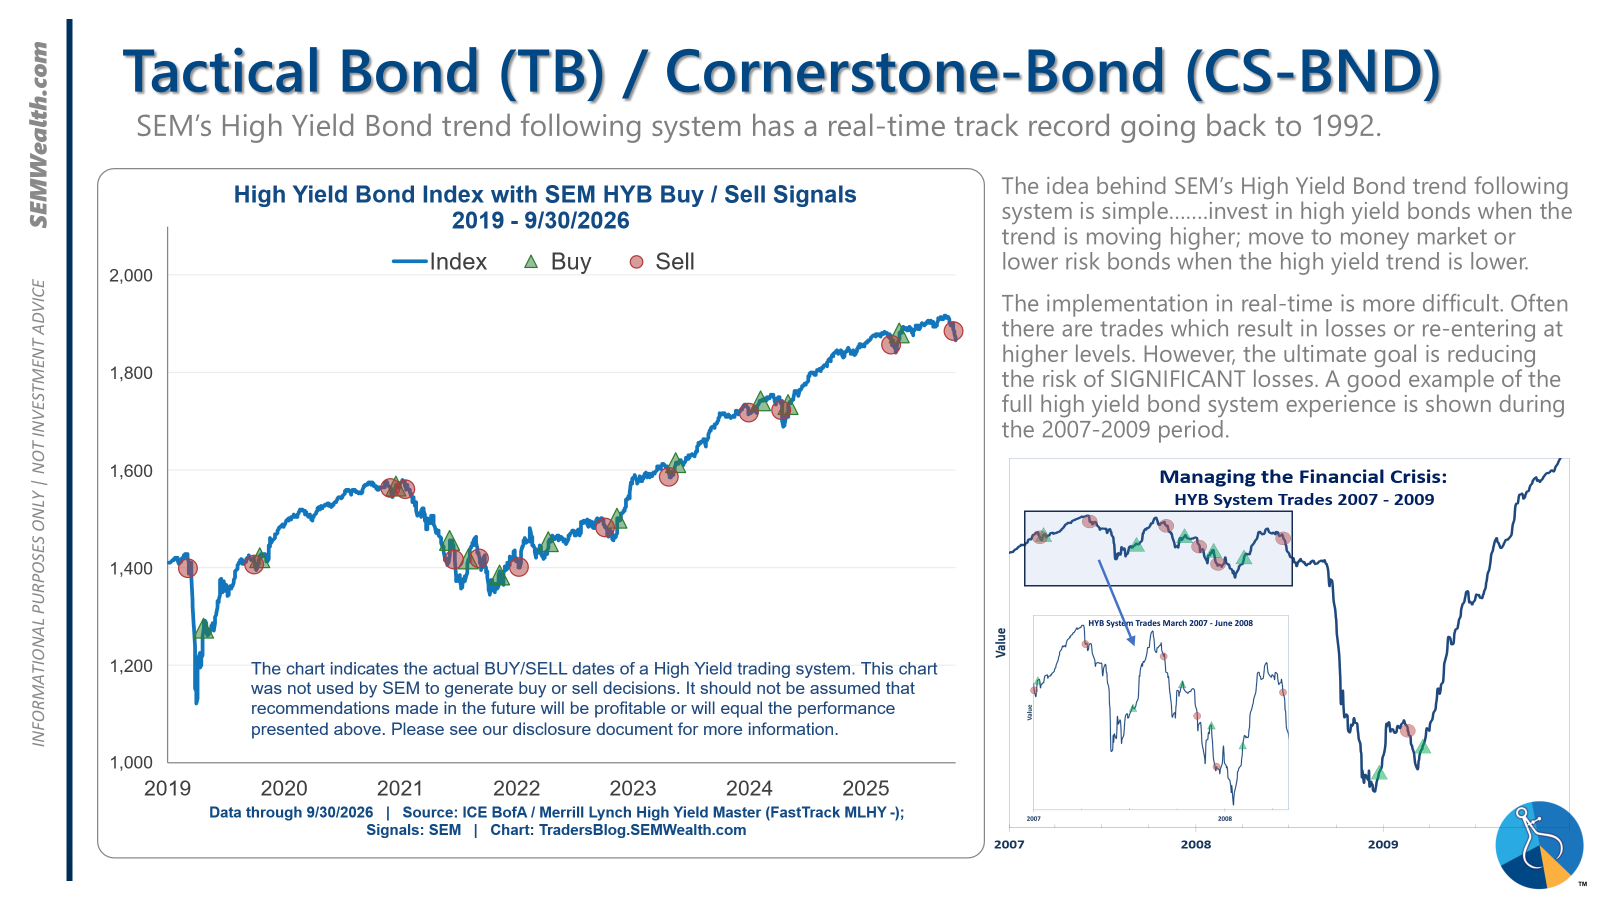
- Tactical = BEARISH (9/24/26) | 100% Money Market / Short Term Bonds (9/24/26) | High-yield trends reversed lower with spreads near historic lows.
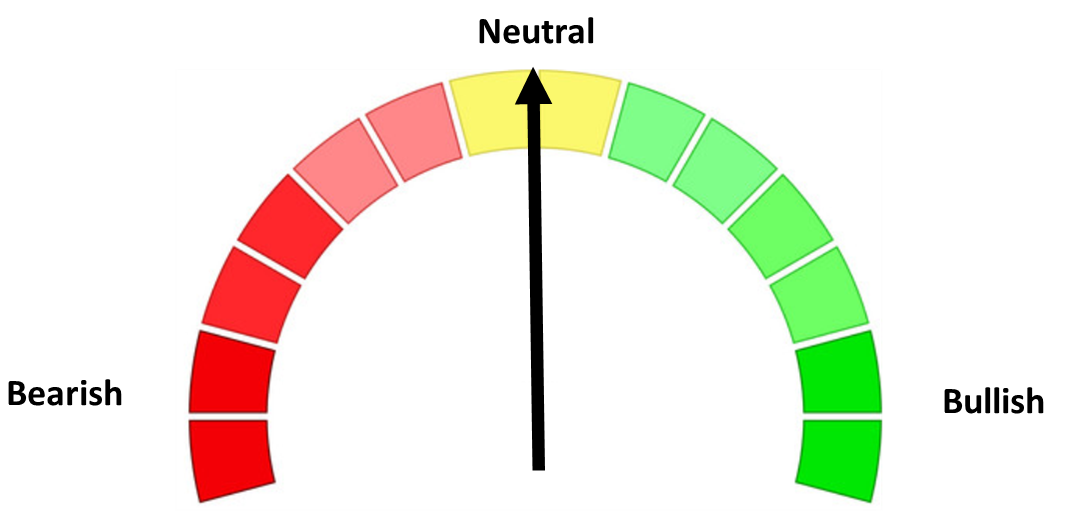
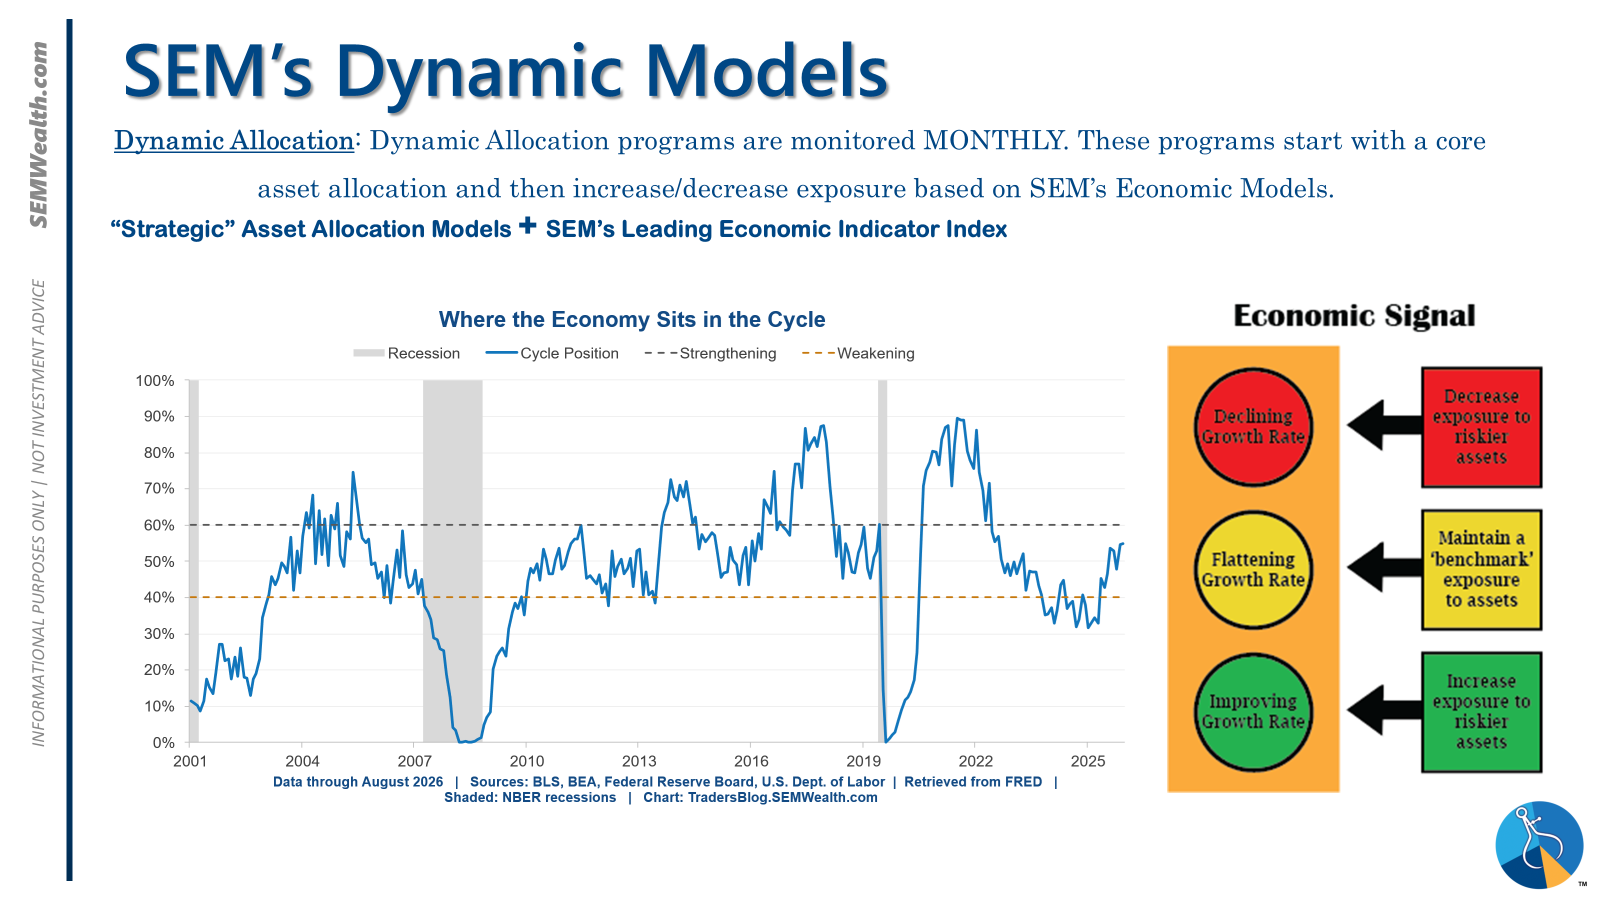
- Dynamic = NEUTRAL (2/15/2026) | "Benchmark" Allocation | Economic model inconclusive
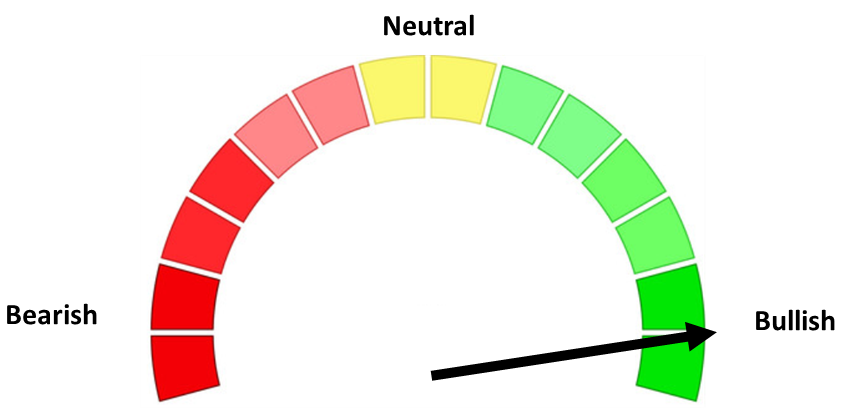
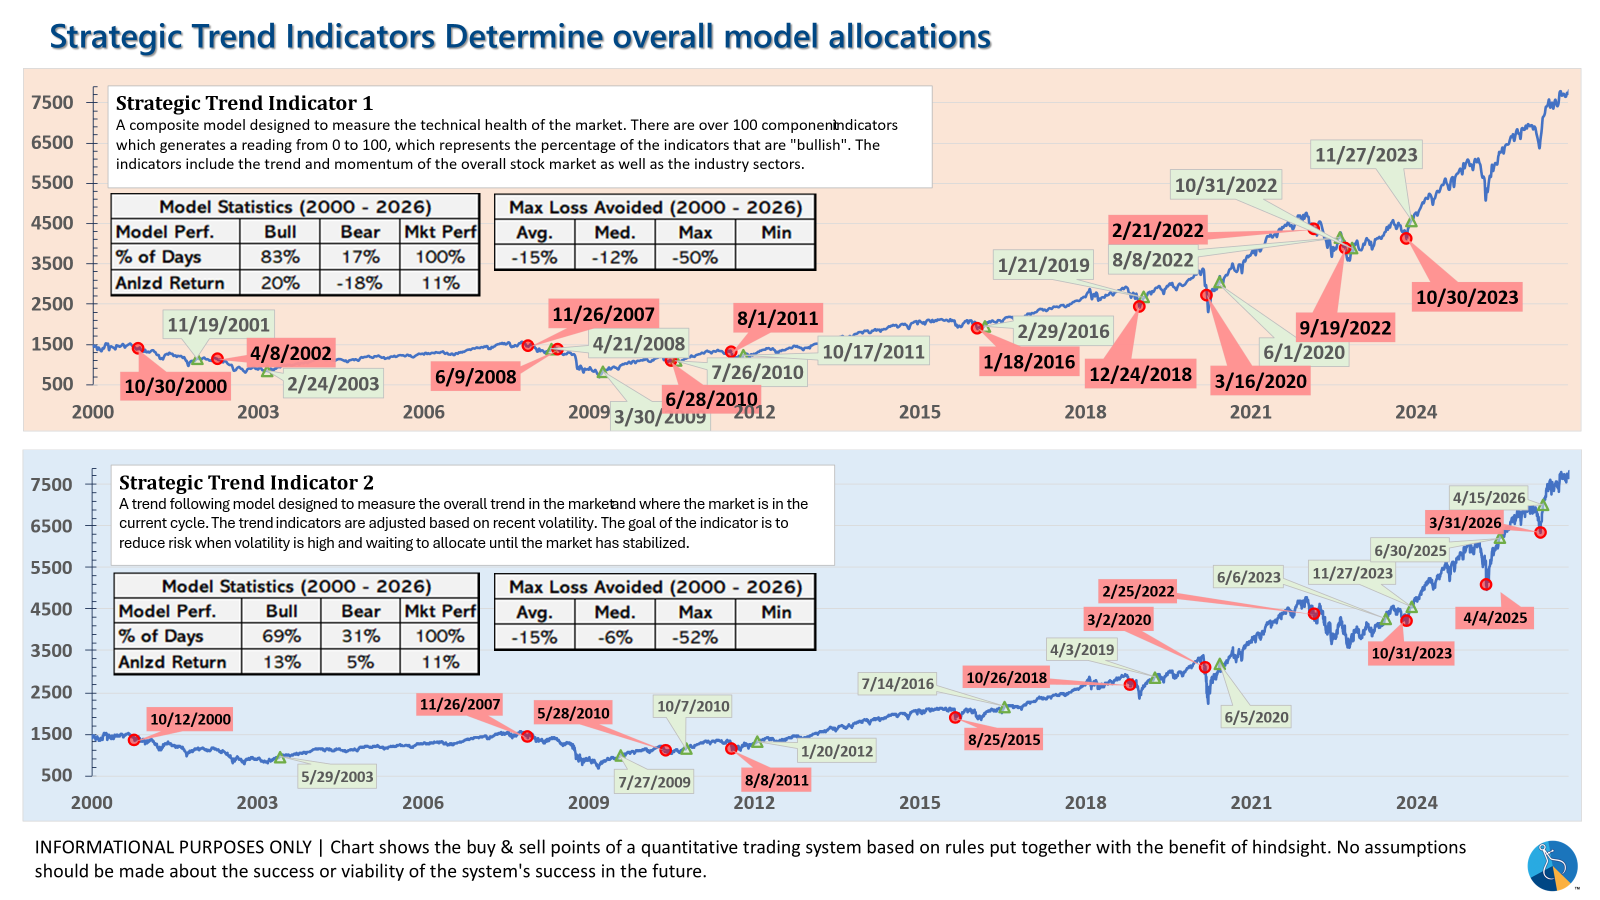
- Strategic = BULLISH (4/15/2026) | V-Bottom projecting "end" of Iran War
Tactical (daily):
- Monitored DAILY
- Models: Tactical Bond, Cornerstone Bond, Income Allocator, Tax Advantaged Bond
- Designed to follow the trends for use in our lower risk models
- SELL Signal issued September 24, 2026 (exiting the buy from April 8, 2026)
Dynamic (monthly):
- Monitored MONTHLY
- Models: All "Dynamic" Models (Income, Balanced, Aggressive Growth, and Asset Allocator)
- Uses SEM's Quantitative Economic Model
- Designed to overweight riskier assets if economic trend is higher & underweight those assets if economic trend is lower.
- NEUTRAL signal issued February 15, 2026 (following BEARISH signal from July 2025)
Strategic (quarterly)*:
- Monitored QUARTERLY
- Models: AmeriGuard (Balanced, Moderate, & Growth) and Cornerstone (Balanced & Growth)
- Core Component: Quantitative Filter using 4 different time horizons across universe of asset classes
- Trend Indicator: Two different Quantitative Systems monitoring the intermediate-term trend, health of the market, and volatility
- CORE eliminated small cap in AmeriGuard and reduced it in Cornerstone in October 2026; overweight international since October 2025.
- Both TREND INDICATORS are BULLISH following 10% drop and "V-Bottom" reversal in early April
- AmeriGuard & Cornerstone Max DO NOT use the Trend indicator and are always 100% invested in stocks using our CORE rotation model.
The core rotation is adjusted quarterly. To start the 4th quarter we saw all of our small cap position in AmeriGuard eliminated and the Cornerstone small cap position cut in half. We remain overweight international (at least for these models where the benchmark is 0% international).
The * in quarterly is for the trend models. These models are watched daily but they trade infrequently based on readings of where each believes we are in the cycle. The trend systems can be susceptible to "whipsaws" as we saw with the sell and buy signals in the spring of 2025 and 2026. The goal of the systems is to miss major downturns in the market. Risks are high when the market has been stampeding higher as it has done since 2023. This means sometimes selling too soon. If "wrong", the systems can quickly reverse.
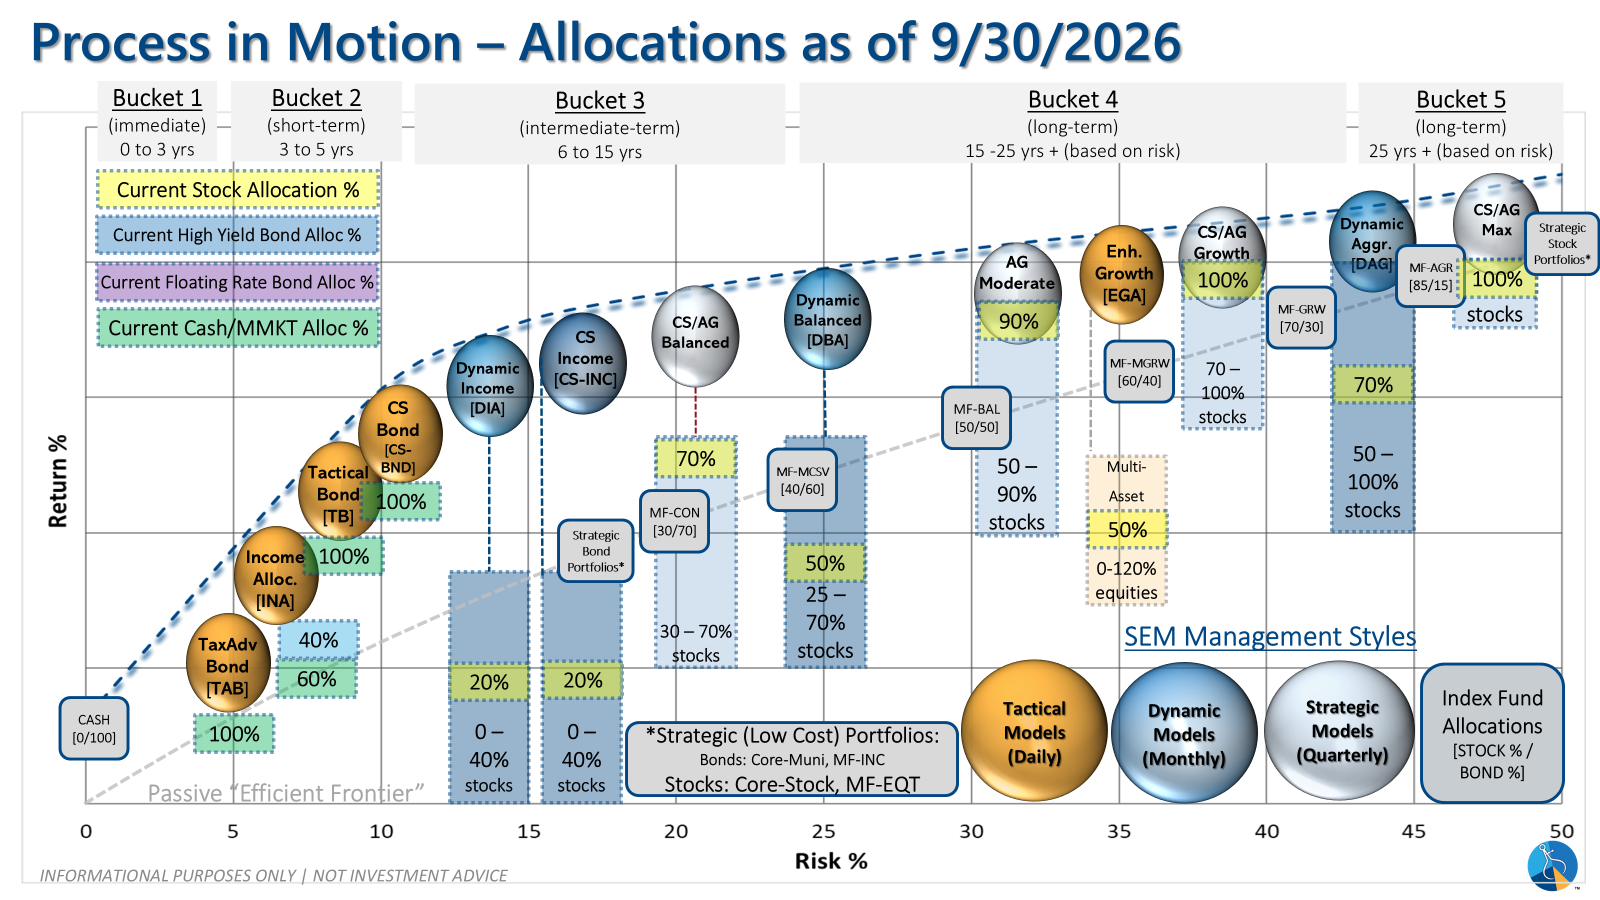
Overall, this is how our various models stack up based on the last allocation change:
Curious if your current investment allocation aligns with your overall objectives and risk tolerance?