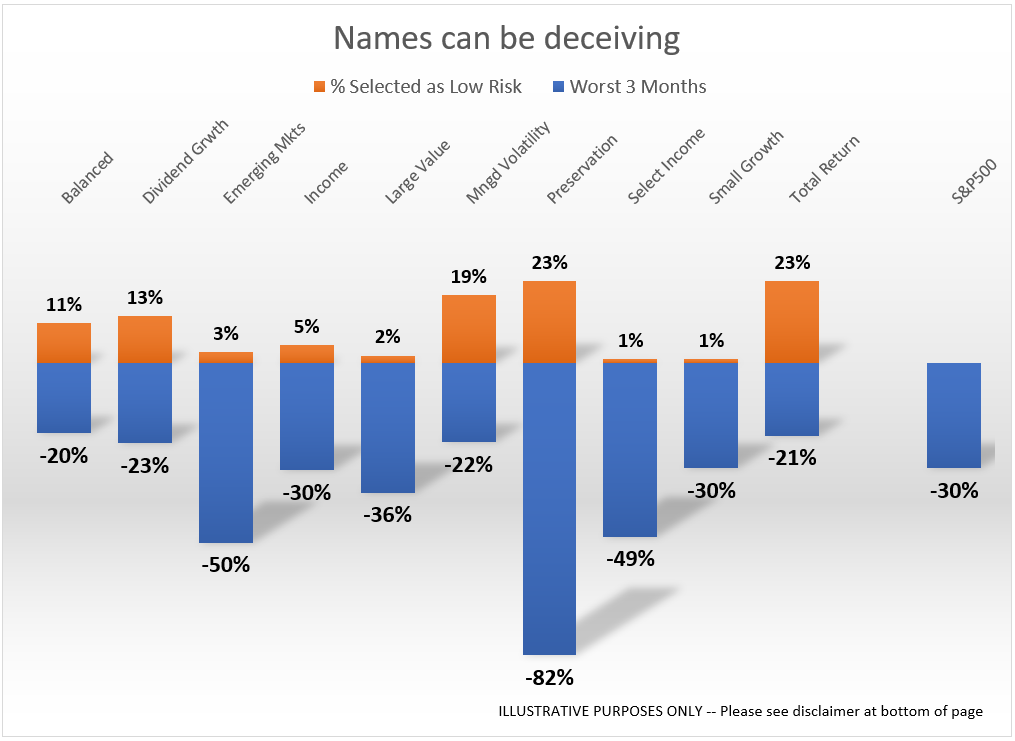
We recently conducted a survey of individual clients and professional investor advisors asking them to look at some data to select the most and least risky investments on the list. This is an exercise both groups are asked to do frequently. For individual investors, they have lists of investment choices
Tag: Chart of the Week
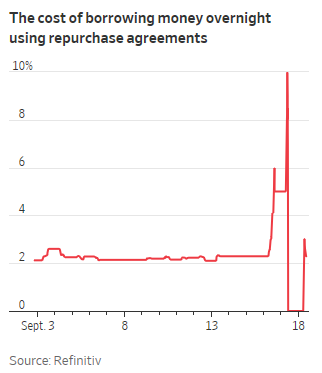
You can only manipulate the financial system so much without causing a large disconnect in the free market. This week we briefly saw what can happen when too many people want to get cash out of a system the Federal Reserve has been micro-managing while trying to stimulate economic growth.
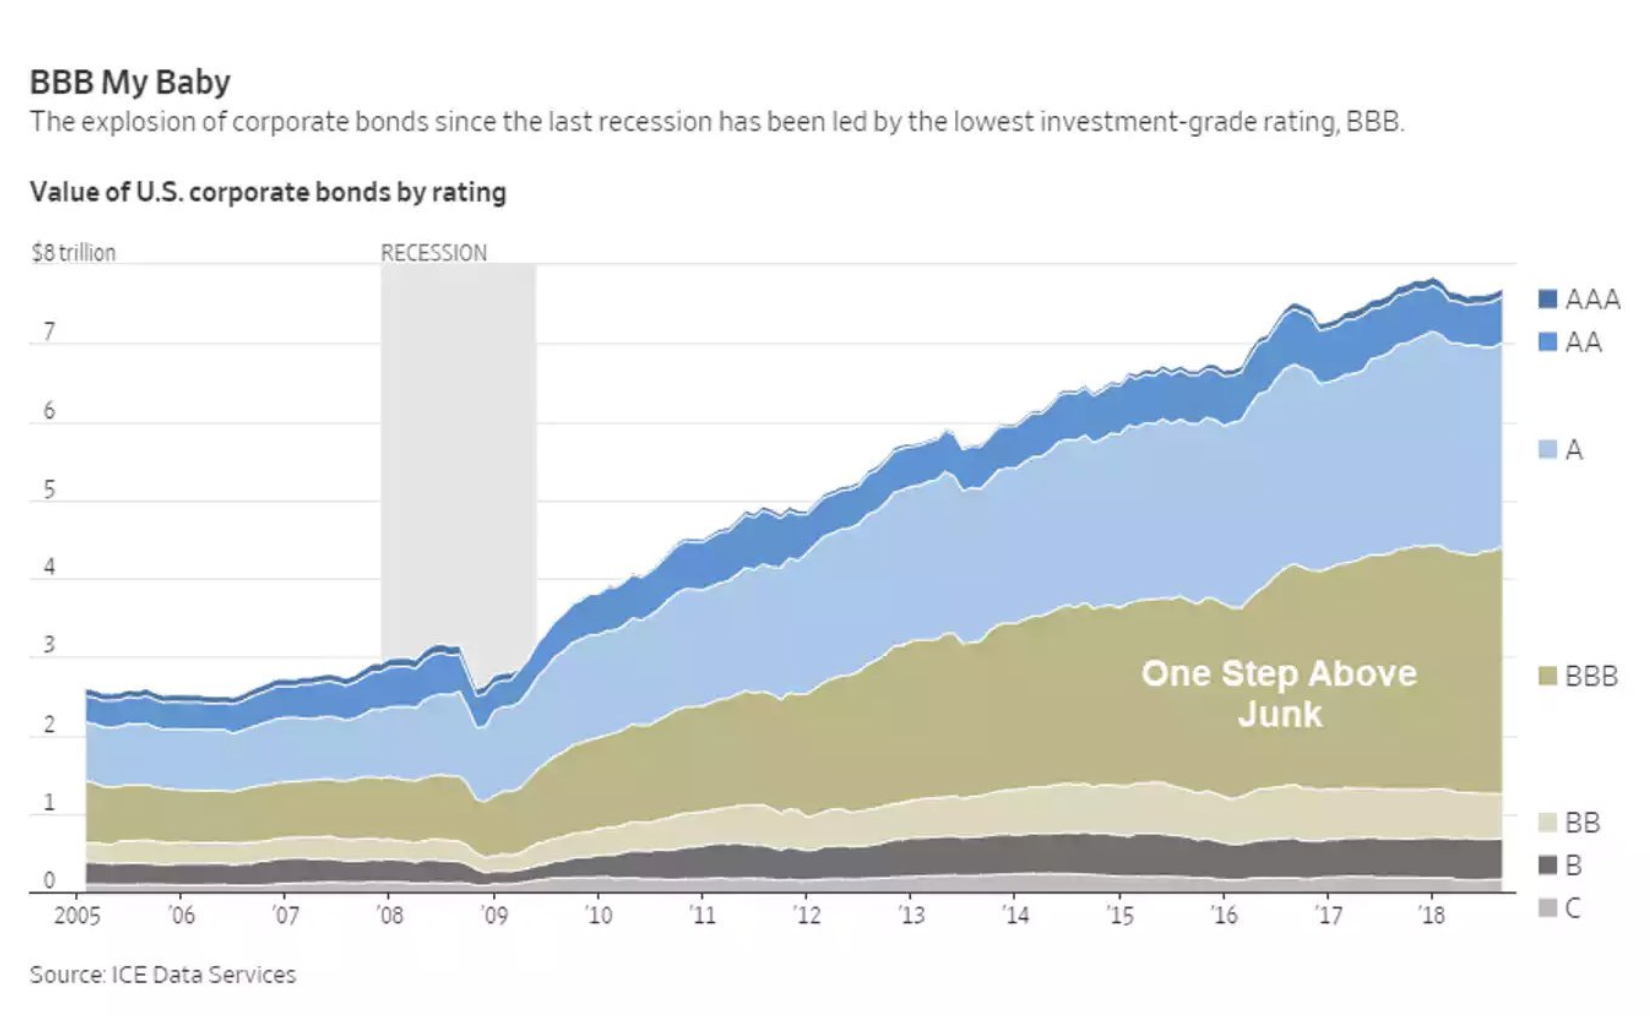
“One person’s financial assets are another’s financial liabilities (i.e., promises to deliver money). When the claims on financial assets are too high relative to the money available to meet them, a big deleveraging must occur.” – Ray Dalio, Big Debt Crises
“Debt
There are a lot of opinions floating around about who caused what, when it changed, and what the future impacts will be. At SEM we choose to ignore those opinions and instead focus on the data. This week’s Chart of the Week will take a closer look at
Stock market cheerleaders often point to the high earnings growth rate projections when recommending investors “buy any dip” in the stock market. Last week we highlighted both the very high expectations for earnings growth along with a big increase in the “multiple” (Price/Earnings ratio). Essentially,


