
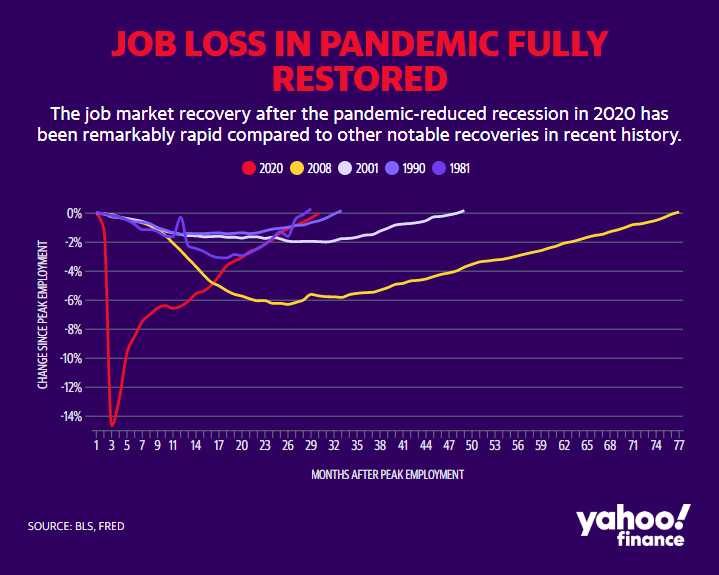
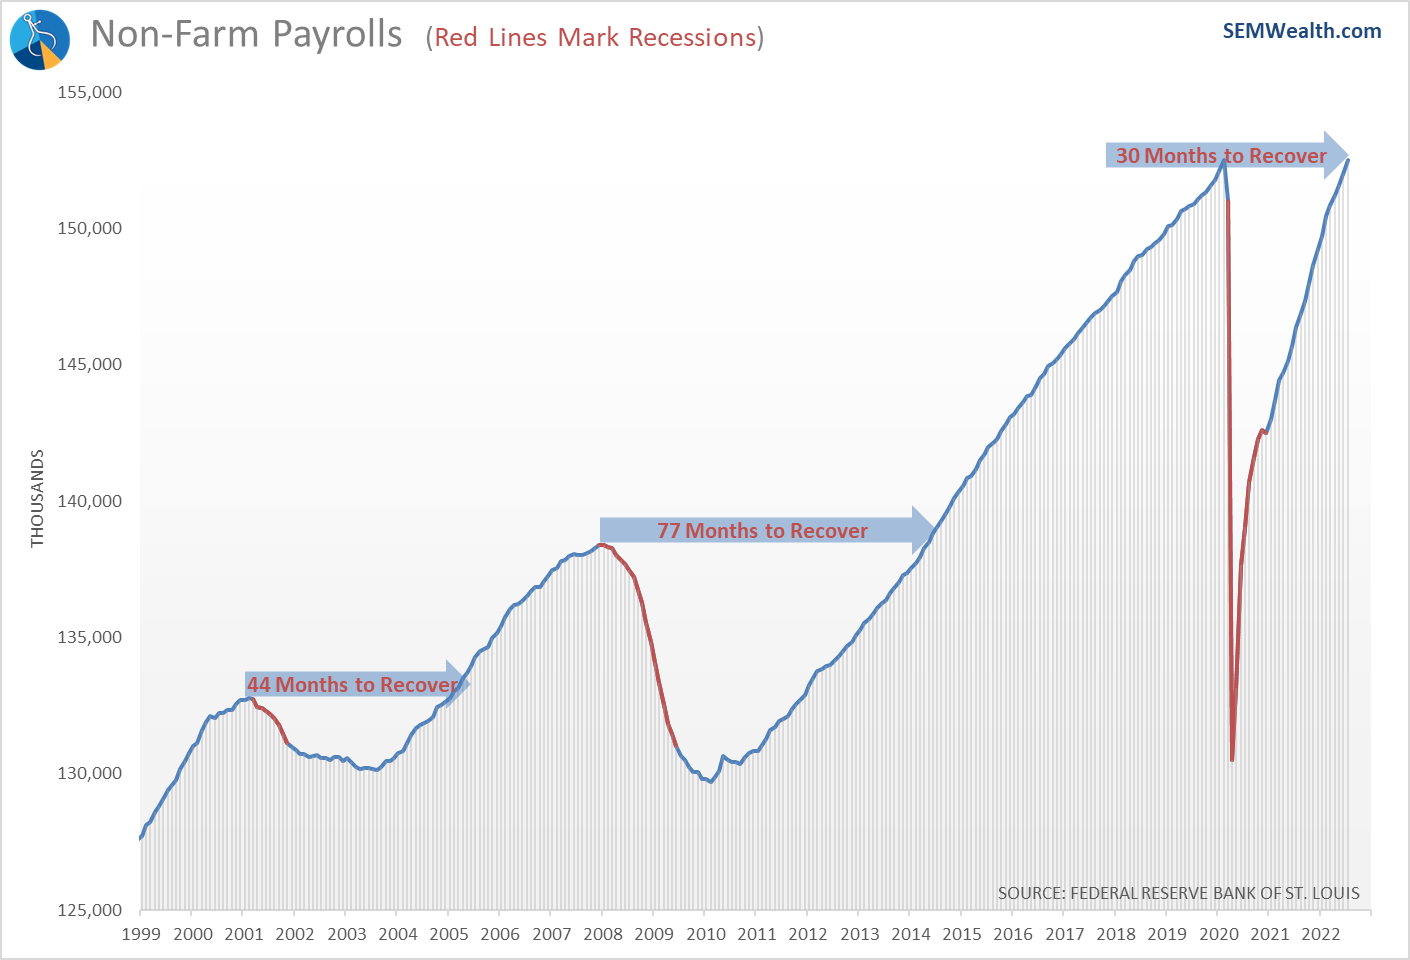
Talk about conflicting data points. Two weeks ago the data told us we just had our second consecutive decline in economic output (which used to be how we defined a recession). Last week, we learned the labor market fully recovered all of the jobs lost during the short pandemic recession. This was the 2nd fastest recovery of jobs on record, falling just 2 months shy of the 1981 record.
I'm not going to waste time debating the definition of recession or even talking about the "strength" of the labor market. We see plenty of that in the financial, mainstream, and social media. Our readers are smart enough to know what really matters is what happens in the future, not who or what is to blame/receive credit for the current economy.
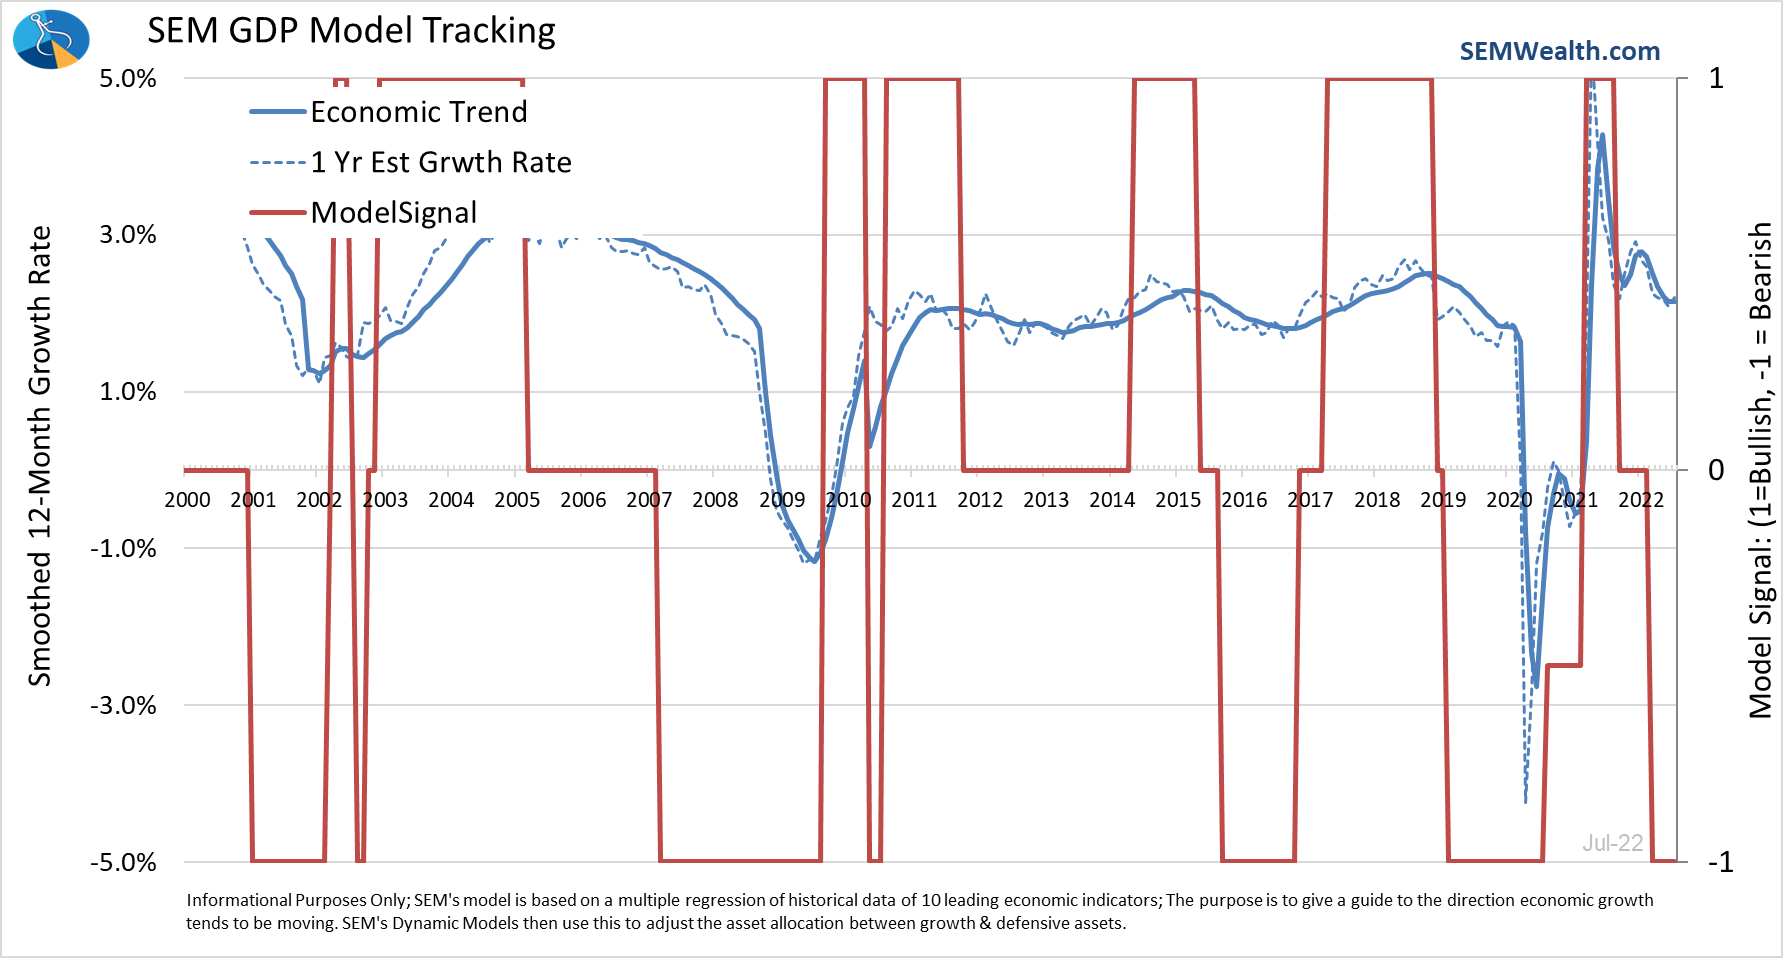
All economic data is backward looking. With a $20+ trillion economy and over 300 million people, it is difficult to have accurate, timely data on how the economy performed. We don't know until several years after the fact how the economy actually performed. That said, the data is the best gauge we have on the health of our economy. SEM's economic model was designed using statistical analysis of the "older" data to find more timely data points that are "good enough" to tell us the general direction of the economy. It's not perfect, but historically has given us a solid indication of where we are likely heading.
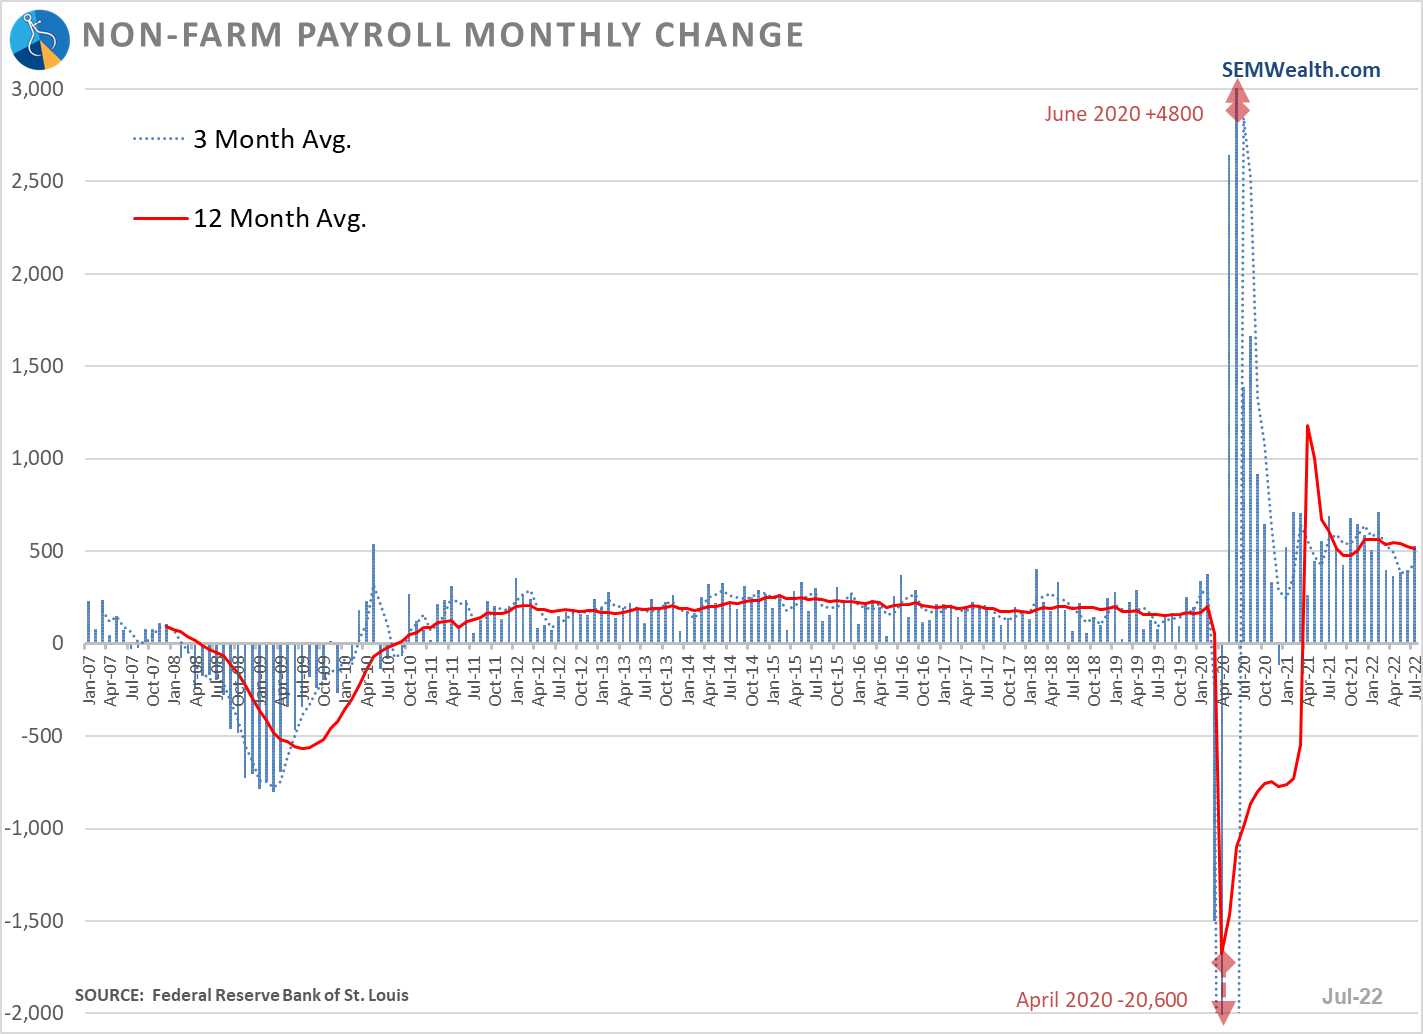
The official jobs numbers show an impressive recovery.
What is not showing up in this survey data is a continued increase in initial unemployment claims. This is a very early sign the job market is not as healthy as the official payrolls data makes it appear.
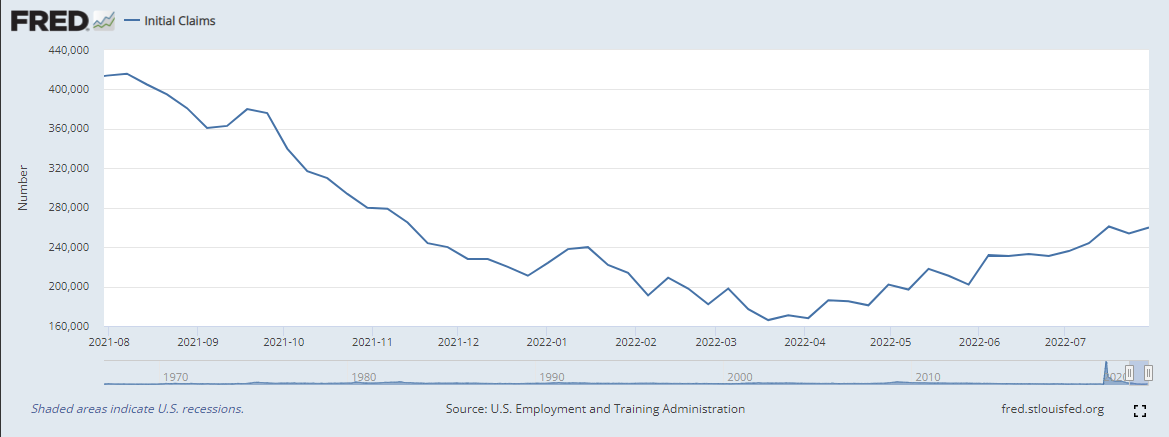
For perspective, the pre-COVID claims in early 2020 were 190,000. Last week we saw 260,000 NEW claims for unemployment. If this trend continues, we could easily see the "official" payrolls numbers declining again in the fall, especially if you look at the other economic data points we've discussed the last few months.
Overall, our economic model remains "bearish". This doesn't mean it is necessarily calling for a recession, but slowing growth, which should be a concern for those betting on continued above average growth for corporate earnings (and stock prices.)
The stock market (temporarily) bottomed under the assumption the Fed was not only close to ending their series of rate hikes, but also could be cutting rates in 2023. This week numerous Fed officials went out of their way to say they are nowhere near the point of rate cuts. Their number one focus is cutting inflation down to 2%.
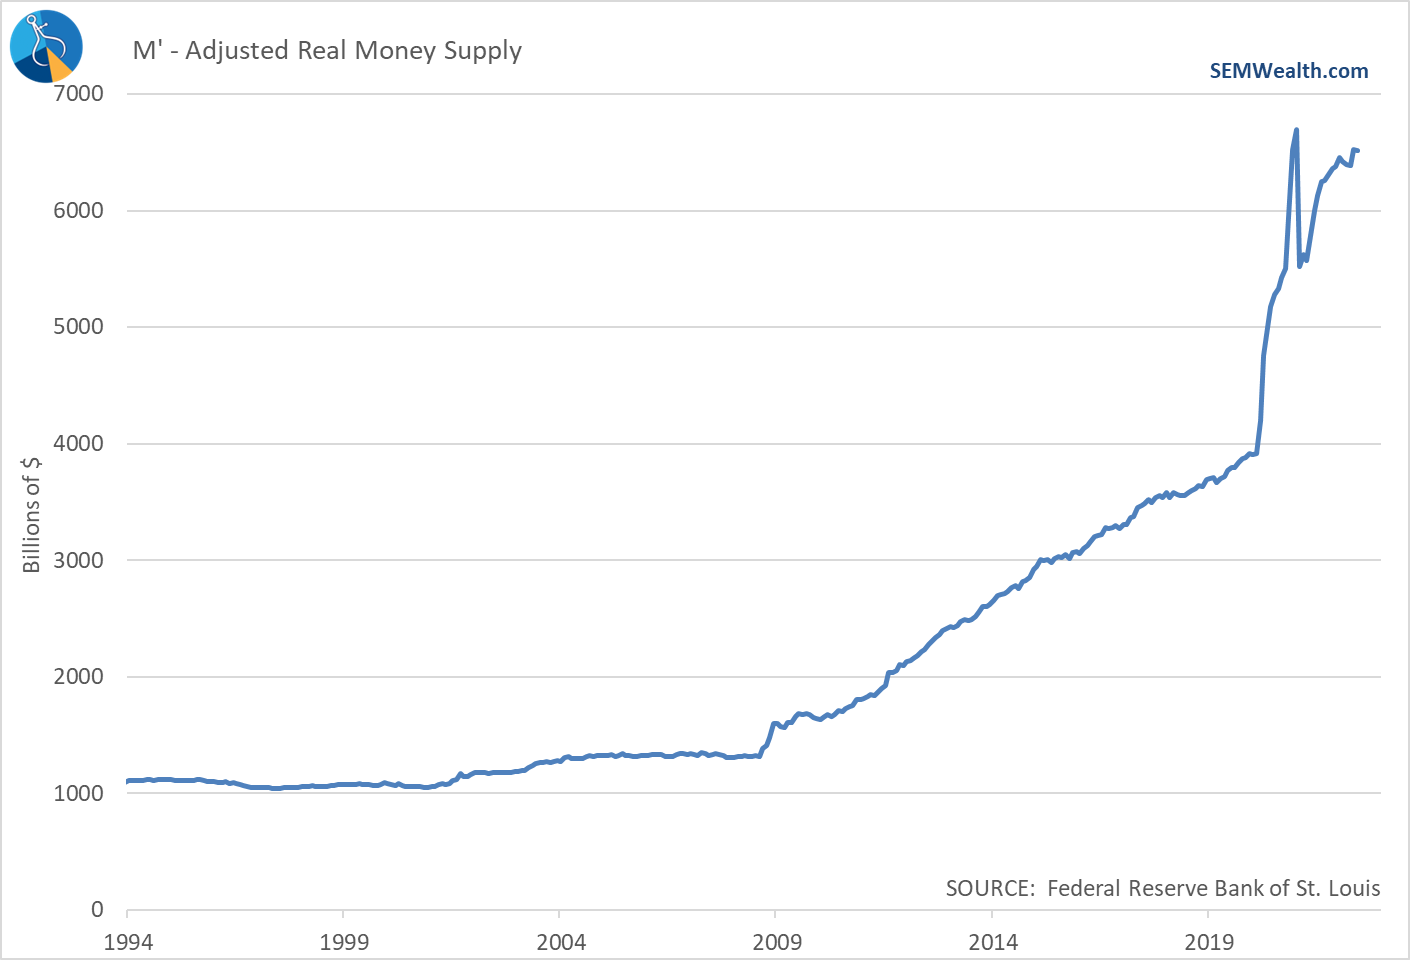
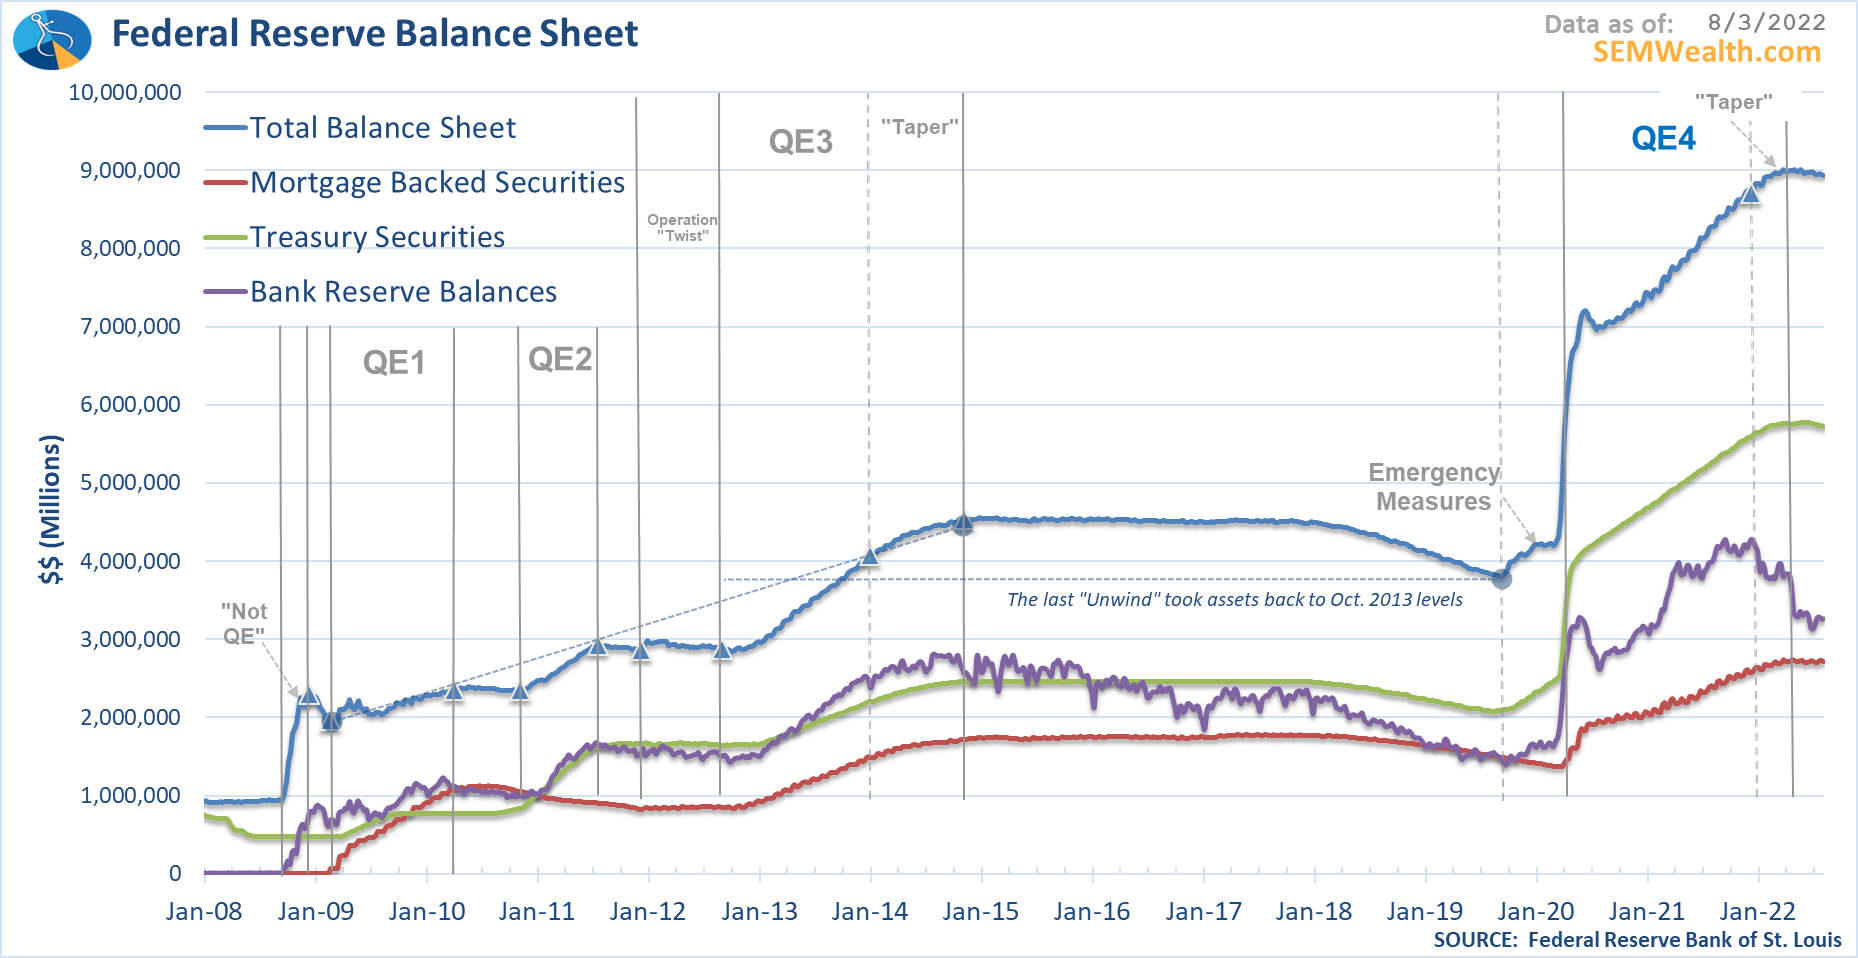
What I think most "experts" are missing is the fact the Fed has essentially done NOTHING so far to slow the economy (or inflation). Historically it takes 9-12 months for one change in Fed policy to filter through the economy. We're not even feeling the impact of the first rate hike of 25 bp back in March, let alone the additional 1.5% in combined hikes in June & July. Looking at both the Fed Balance Sheet and the Money Supply you have to squint to see any slowdown in the amount of money floating through the system.
The fact the economy is slowing (beneath the surface) even before we've felt an impact from higher rates and "tightening" Fed policies should be a concern for the bulls.
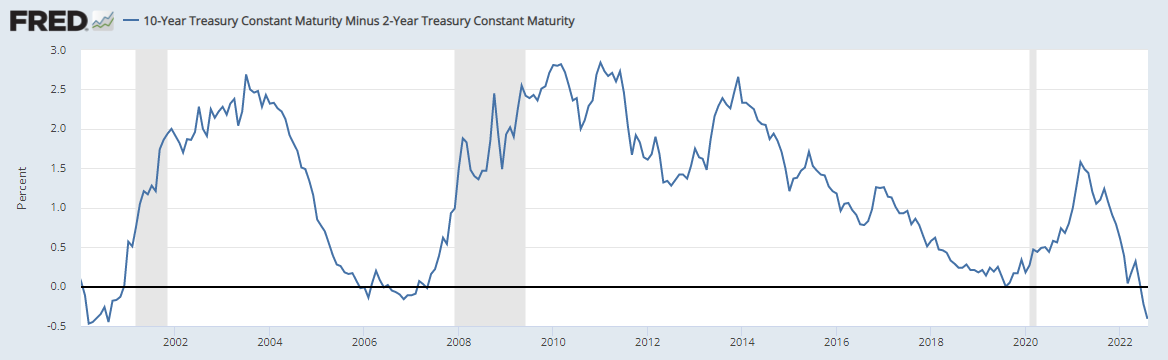
Looking at bond yields, I had said throughout the first half of the year the long-term bond market was screaming at the Fed to raise rates and because they ignored them they took rates up themselves. Once the Fed appeared to get "serious" about raising rates, it is no coincidence long-term rates peaked (for now).
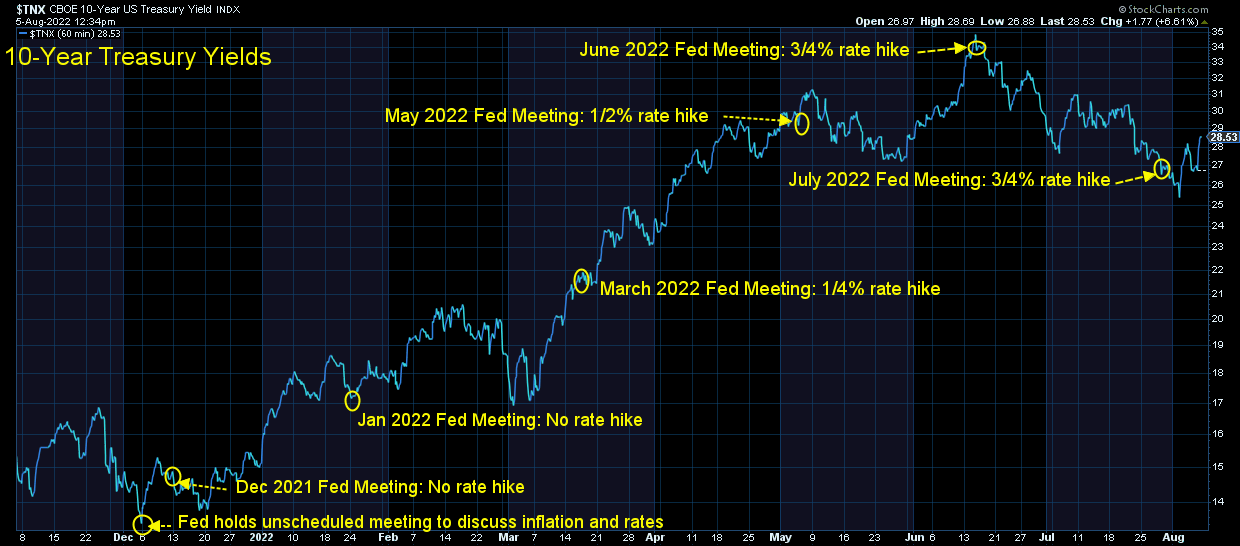
With the "new" expectation the Fed was nearly done raising rates and could cut rates next year, notice on the far right of the chart what the bond market thinks about this (they aren't happy.) The bond market is also signaling a recession in the next 6-9 months by pushing the yield curve to "invert" (shorter-term rates higher than longer-term rates).
This chart illustrates how an inversion of the yield curve (negative spread) tends to lead the actual recession (grey bars).
Turning to stocks, the S&P 500 has pushed to the top of its 90 point trading range from 4080 to 4170. Technical levels tend to work because as humans we look at different points where we bought (or thought we should have sold). When you have a point for a major index where there were big reversals multiple times you end up having a large number of people who could look to buy/sell when the market returns to that point.
4170 was support (where the market stopped going down) in February, twice in March, and again in April before it gave way and then plummeted. The market attempted to break through again in late May and early June, but failed. After that attempt the market hit new bear market lows. Now that we are back to these levels, all of the people who bought (or considered selling) are now back to "breakeven". It will be interesting to see if the appetite for risk taking that drove the market higher since mid-July will lead to a breakout.
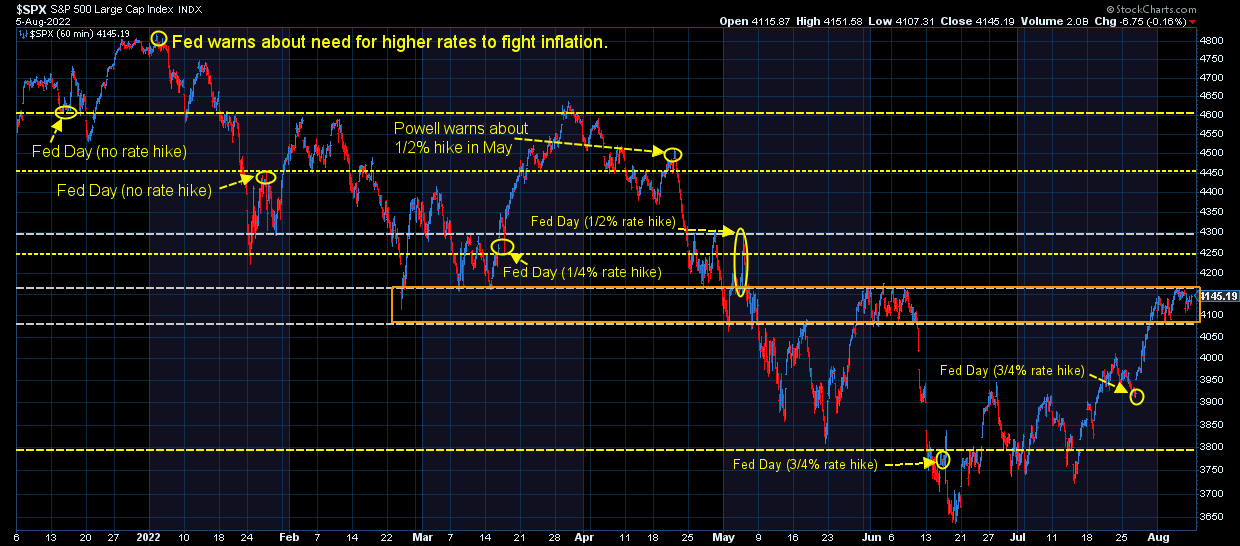
Ignoring fundamentals, I'd say the chances are decent we do get a breakout above 4170. However, when you look at the slowing economy, the fact the Fed has said they are going to continue being a headwind, and the once again above average stock market valuations, I subjectively wouldn't get too excited even if it does.
That said, our models will be watching closely this week to see if a.) the S&P can break above 4170 and b.) if it brings higher volume (conviction). If it does, it doesn't matter what my opinion is, the trend model that sold in mid-March would likely jump back into the market inside AmeriGuard & Cornerstone.
Stay tuned.


