
Winter has arrived here in Virginia. We woke up to snow flurries south of Richmond. You'd think with virtual school there would be no more snow days, but that is not the case apparently even with the snow not sticking to the pavement and expected to be done by 10 am. Go figure.

Looking at the economic and virus data there are a few metaphors we can apply here. First, is some people will freak out at the first sign of snow regardless of what the data says.

That said, we know the first snowfall is a warning the season has changed and a much tougher road is ahead.

The first look at November's economic data certainly qualifies as the first snow of the season. The data was cooler and could be a sign we have a much tougher environment ahead. Manufacturing data was weaker and service business activity fell sharply.
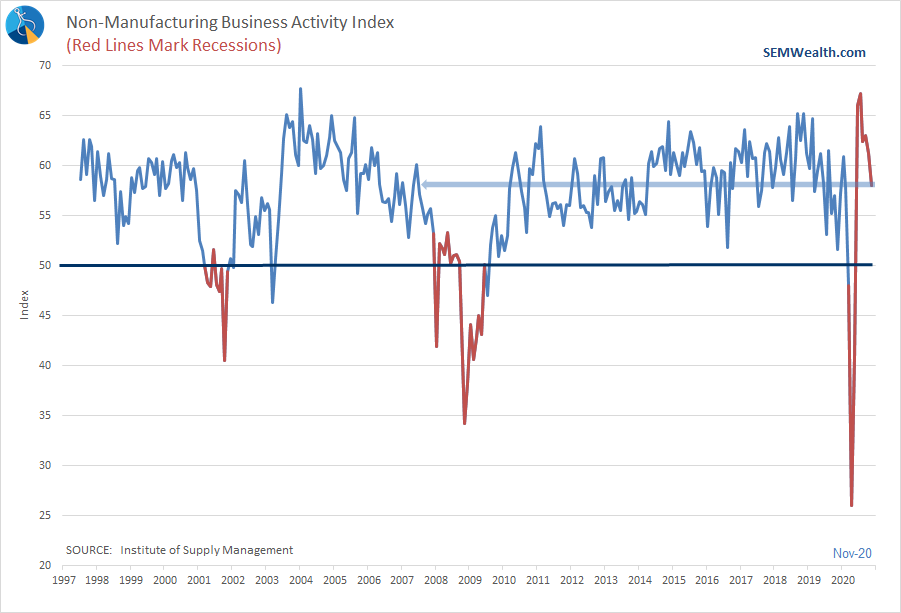
Any reading above 50 still indicates expansion, but the speed of that expansion is certainly cause for concern. The employment data is a bigger concern.
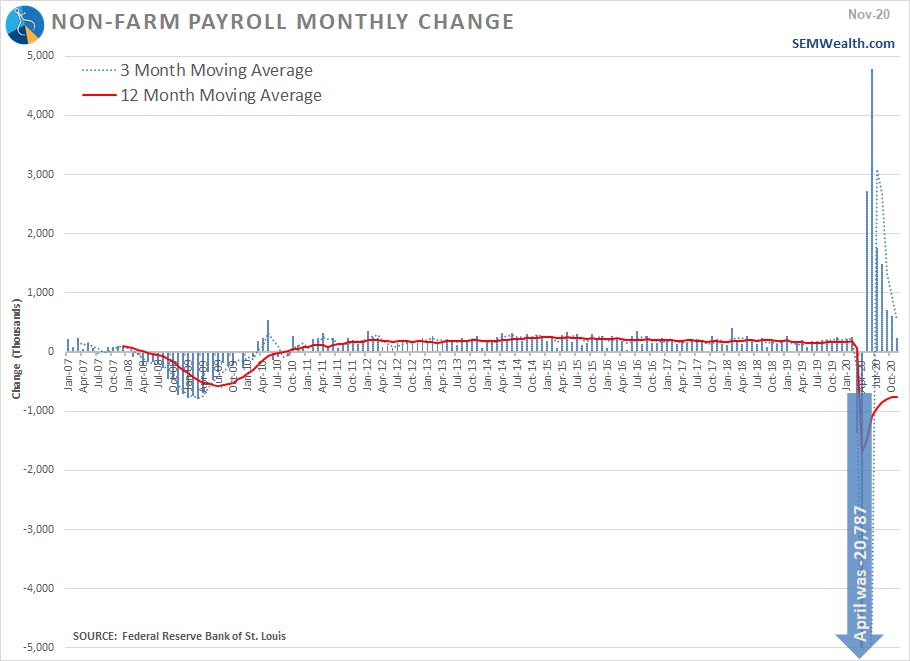
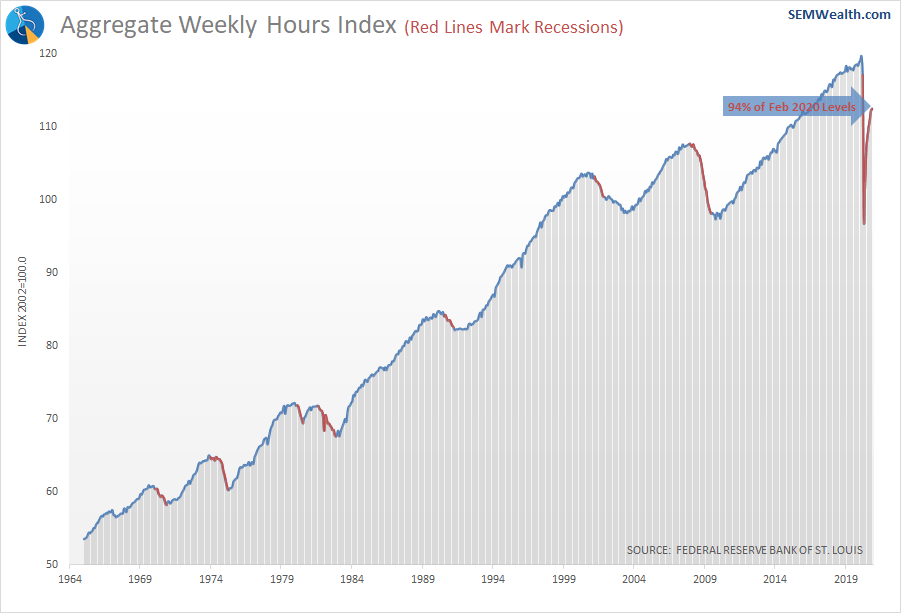
This chart illustrates the change in the number of jobs. I truncated the negative axis so we could better see the more recent data.
I've often talked about the 95% economy, which is the possibility that the "new normal" could be 95% of what we had at the start of the year. Looking at the overall number of jobs, that is still a distinct possibility.
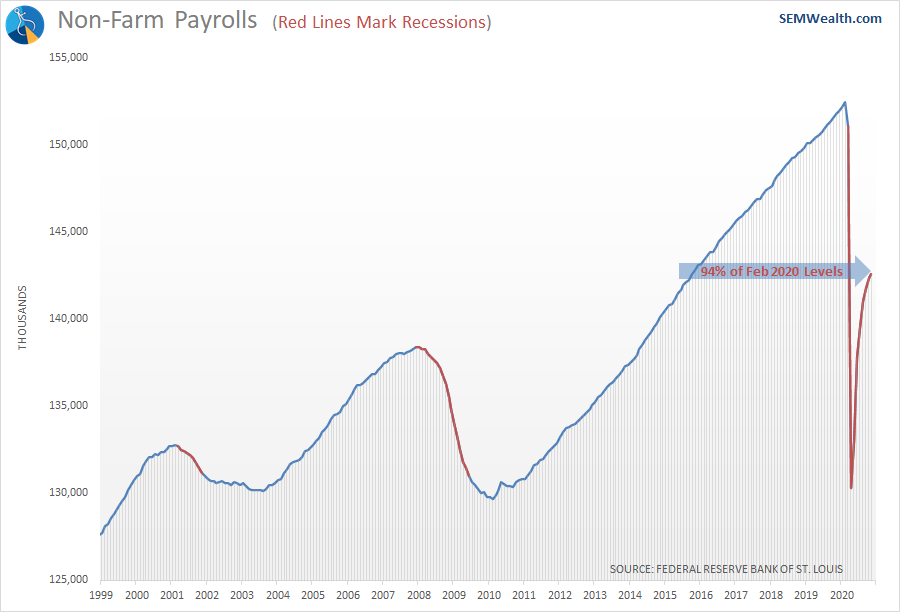
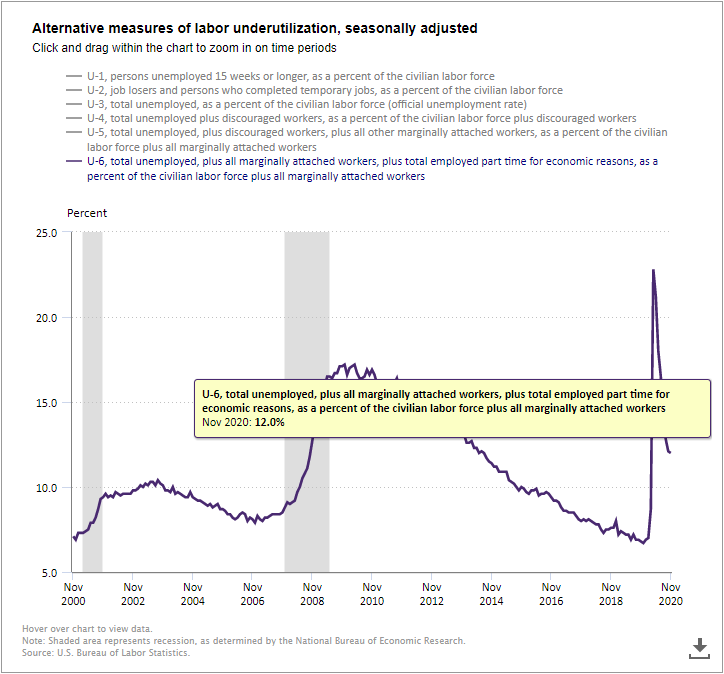
In addition to being so far below the February high, we are back to 2015 job levels. Keep in mind a job is a job regardless of how many hours are worked or how much it pays. Somebody working 3 part-time jobs who used to work 1 full-time job would be counted as 3 jobs in the official payrolls report. The U-6 unemployment number gives us a better idea of the health of the labor market. It is declining, but still uncomfortably high for our economy.
Included in that number is those employees not working as many hours as they would like. The hours worked index continues to show underlying economic weakness.
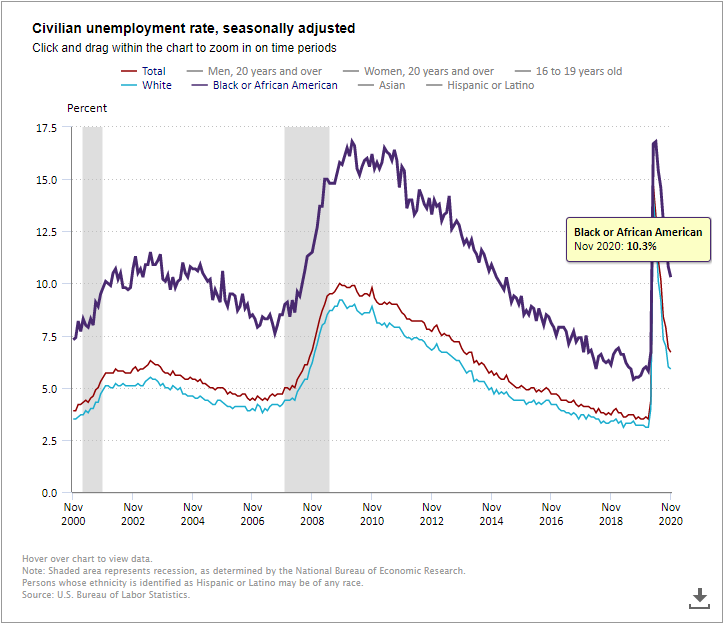
We don't have data on the U-6 by race, but we can still see a large gap between Black and White Americans in the official unemployment rate. Black Americans were hit far harder during the recession and have recovered their job losses at a much slower rate.
My favorite chart in the BLS release each month is this bubble chart. It shows the largest areas of job growth versus the wages those jobs paid. The size of the bubble represents the size of the industry in terms of overall jobs.
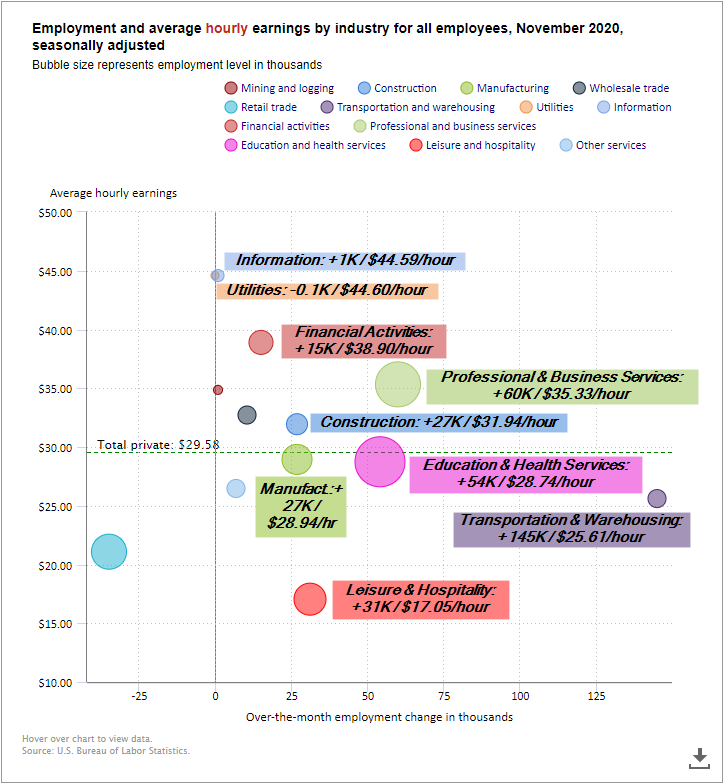
Transportation and Warehousing added the most jobs. 82% of those jobs came from "couriers & messengers" (Fed Ex/UPS), "warehousing", and "warehousing support". Even though the data is seasonally adjusted, with delays due to COVID and a mass shift to online shopping, the coincidental data shows the transportation companies ramped up hiring sooner than usual this year. The rest of the data shows very few jobs being created in the higher paying industries.
I've been discussing the "K-Shaped" economy. We can think of the majority of jobs below the average earnings of $29.58 as the lower part of the K and most of the ones above that line as the upper part of the K. Most of those jobs can either be performed from home easily without revenue interruptions or in the case of construction have enjoyed a COVID-driven boom. The highest paying jobs (Information and Utilities) have had very little growth and employ very few people overall.
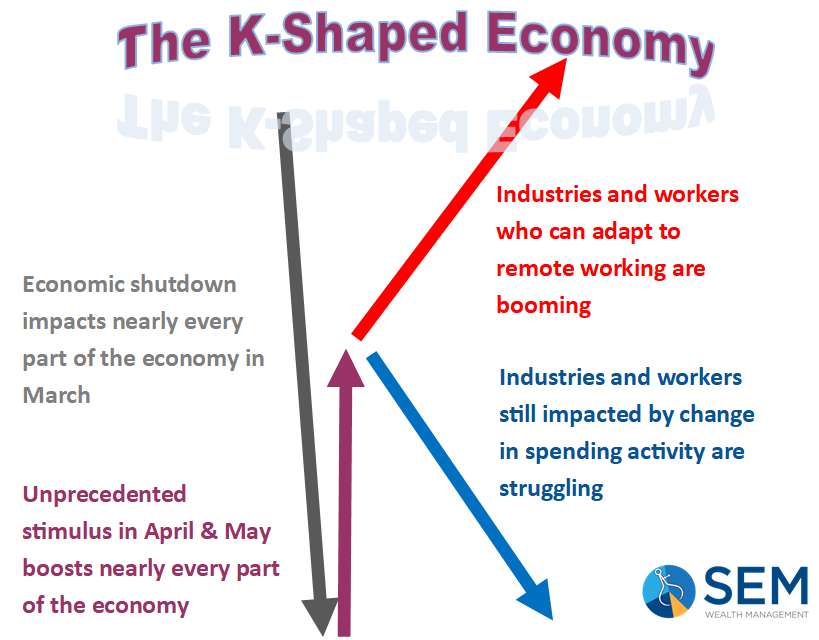
With increased shutdowns again we risk seeing the lower part of the K hurt again. If you think of the structure of the K, if that leg gets weaker, the upper part of the K will be hurt. This is both a short-term and a long-term issue that needs to be addressed. Short-term Congress seems to be willing to work on some sort of stop-gap spending bill to help the lower part of the K. Long-term it's going to take much more work as I detailed here.
 Jeff Hybiak, CFA
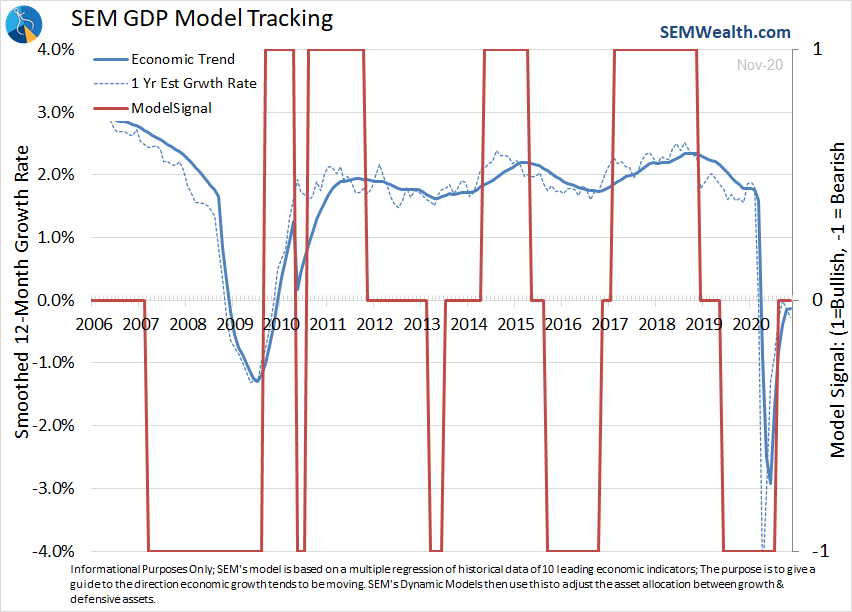
SEM Economic Model Mixed
Our economic model has been "bearish" since the spring of 2019. It was moving towards a "bullish" rating prior to the November data update. The weakness has it teetering between the two. As new data comes in it could shift to "neutral".
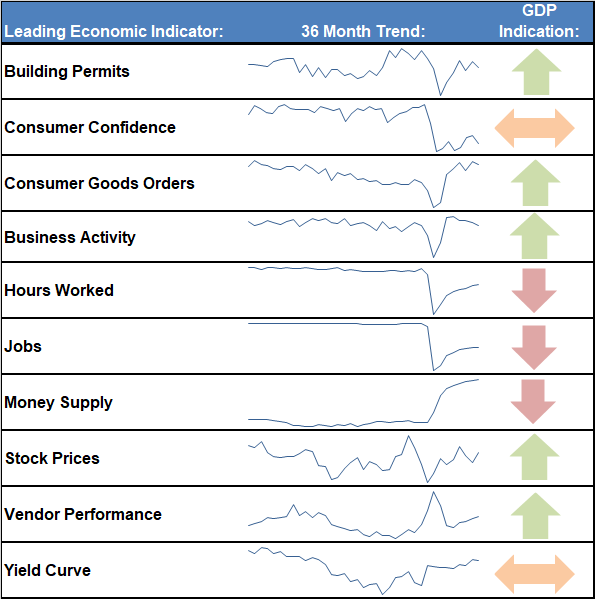
The fast moving recession has given us a chance to look closely at all the indicators. We remain pleased with the way the model has adjusted and may have discovered a way to shift the timeliness of the indicators during an employment recession. The indicators which historically led the economy again proved to be the best indicators.
In November our global economic model generated a buy signal which shifted our Dynamic Aggressive and Dynamic Balanced models into emerging markets. From a subjective standpoint, emerging markets have much more attractive valuations along with much higher growth rates, so I was pleased to see that shift. In addition our interest rate economic indicators had shifted us out of longer-term Treasury exposure in August. Subjectively, this is also a positive shift as the messaging from the Fed along with the shift towards a Congress more receptive to stimulus means a likely continuation of the upward trend in long-term interest rates while short-term rates remain close to zero.
We will have to wait and see what happens the rest of this winter.
Complacency is Dangerous
For 39 weeks I've been writing about COVID. We had a bit of a reprieve early in the fall, but now we are in the midst of the feared winter wave. We've been able to stay fairly isolated living in a 100-square mile county with just 22,000 people. Our office is 5 minutes from our house. We're right in between Williamsburg and Richmond and have barely gone to Richmond since the outbreak started. Williamsburg is so much more sparsely populated than Richmond, plus our church and soccer clubs are both based there.
I had our closest brush with COVID this week. One of the singers in our church band tested positive last week. I had been on stage with her the prior weekend, but thankfully the instruments are on the opposite side of a 25-foot plus stage. Mask wearing and social distancing seems to have kept it from turning into a mass outbreak, but anecdotally it is spreading very rapidly and has caused many people in our community to be admitted to the hospital. Retracing my steps with hers, it easily could have been a different story if I'd relaxed a little bit on my own personal precautions.
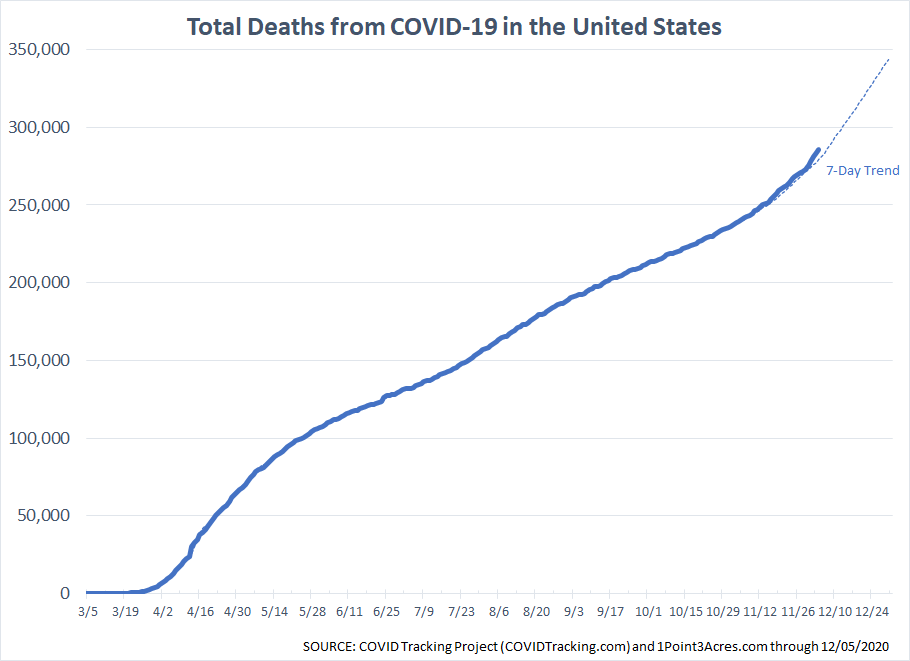
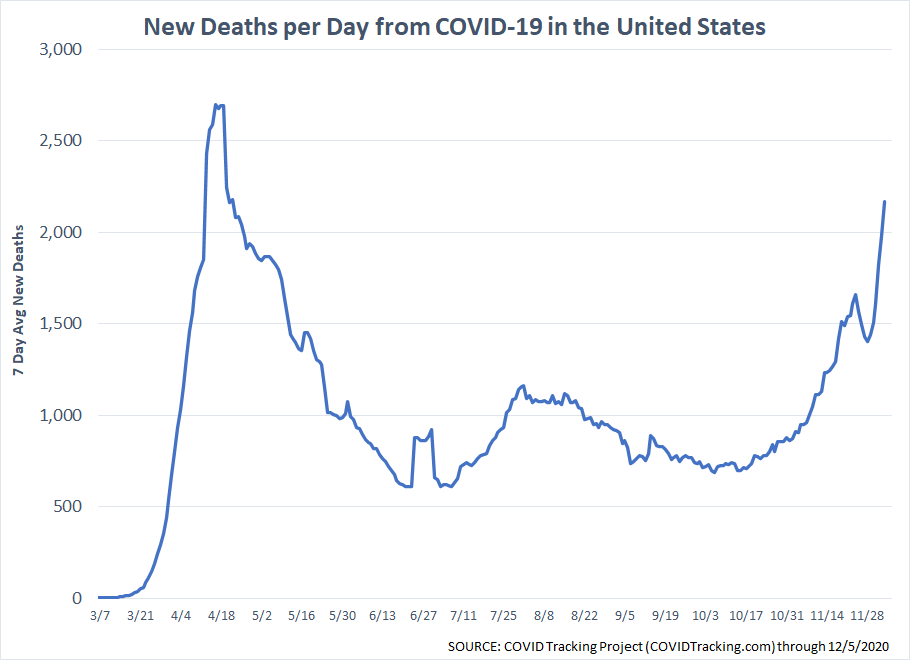
I'd gotten complacent, but not too complacent. Based on the data, complacency is prevailing and could do some serious damage while we wait for a full roll-out of the vaccines. We may have close to 100,000 deaths from COVID between Thanksgiving and the end of the year if these trends continue.
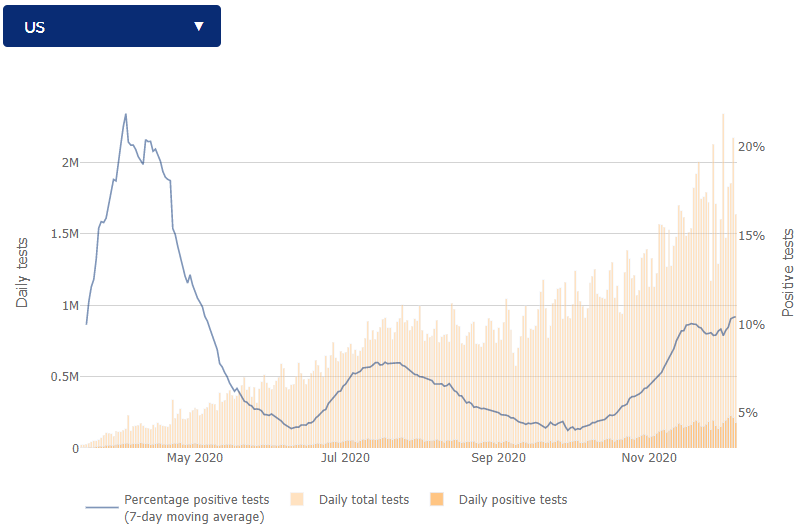
The data is volatile and there are some issues, but it is all we have to go off of. What is important is the trends and they are not looking good. The 5-day average is 2650 through Saturday. It that continues the next few days, this metric will exceed the peak from April.
CDC and other expert guidance has been that the "safe" zone is % positivity between 3-5%. Overall the US is at the worst level since the spring at 10.4% positivity.
I realize this has become political. I said from the outset hindsight bias along with several others will tilt the way we make our assessments. As an independent, I continue to see merit in decisions and ideas from both sides. I also see serious problems with the leadership and decisions made by others. It shouldn't be about which political party you belong to. This is a random, but dangerous disease. Whether blown out of proportion by the media or not, the fact is several hundred thousand Americans have died this year than would be considered normal.
My only hope is we weather this winter with logic, compassion, and patience. We are almost through it, but decisions made today will impact all of us over the next few months and beyond.
Your Checklist
Obviously I'm biased and would prefer you utilize SEM as your Chief Investment Officer. It puts you into a position where you only focus on the data and removes emotions from the investment process. If you are on the fence or still have money in a "do-it-yourself" portfolio, here is the list I put together last week.
Stocks literally could go either way rather quickly. I couldn't imagine not having data-driven, battle-tested, mechanical systems as a guide.
Jeff Hybiak, CFA
Remember – gains are only gains if you cash them in. Now is a great time to evaluate your portfolio and make sure you are positioned for winter before the real storm hits.


