Do you know what you do in August in Arizona? You start power ranking months because there is nothing to do in August in Arizona unless you want to lose your sanity. And surprise, surprise, August finds itself dead last in my rankings. If you have any outside activities to do, you better get them done before 9 AM. All of the fun summer activities you did in May and June have become stale. We don’t even get a holiday to break up the monotony. Which is why, if I must say, my wife and I’s decision to get married in August was the absolute best decision. It certainly had nothing to do with the fact that we were college students and an outdoor wedding in Arizona during August was 75% off.
The best part of August, truly, is looking forward of what’s to come. For a lot of the country, the weather will soon become bearable in the next month or two. The fun parts of the sports calendar are upon us shortly (sorry to regular season baseball enjoyers, nothing personal.) There’s fun holidays on the horizon. We are close, we just have to get there. The biggest problem in getting there may be having the patience required to stay sane until we do.
The last blog I wrote back in June I briefly talked about the imminent end of the Iran War, as peace talks had allegedly been reached. That was good news for inflation coming in the form of oil prices. The problem is as of this week the conflict is still ongoing and there hasn’t been any significant reprieve from oil prices. Unlike the return of Fall, which we can look at a calendar and know how many days are left, the end of the Iran conflict isn’t as definite. It’s hard to have patience in these things when the timeline is subjective. However, I maintain that there is a deadline for the end of this conflict, and that deadline is Election Night 2026.
While Americans fight for what they say is their biggest concern, which is affordability, any sort of actions that affect that concern will matter at the polls. Any sort of positive news will likely help the party in charge, but I don’t think Americans will have patience if there aren’t any concrete resolutions before Election Night.
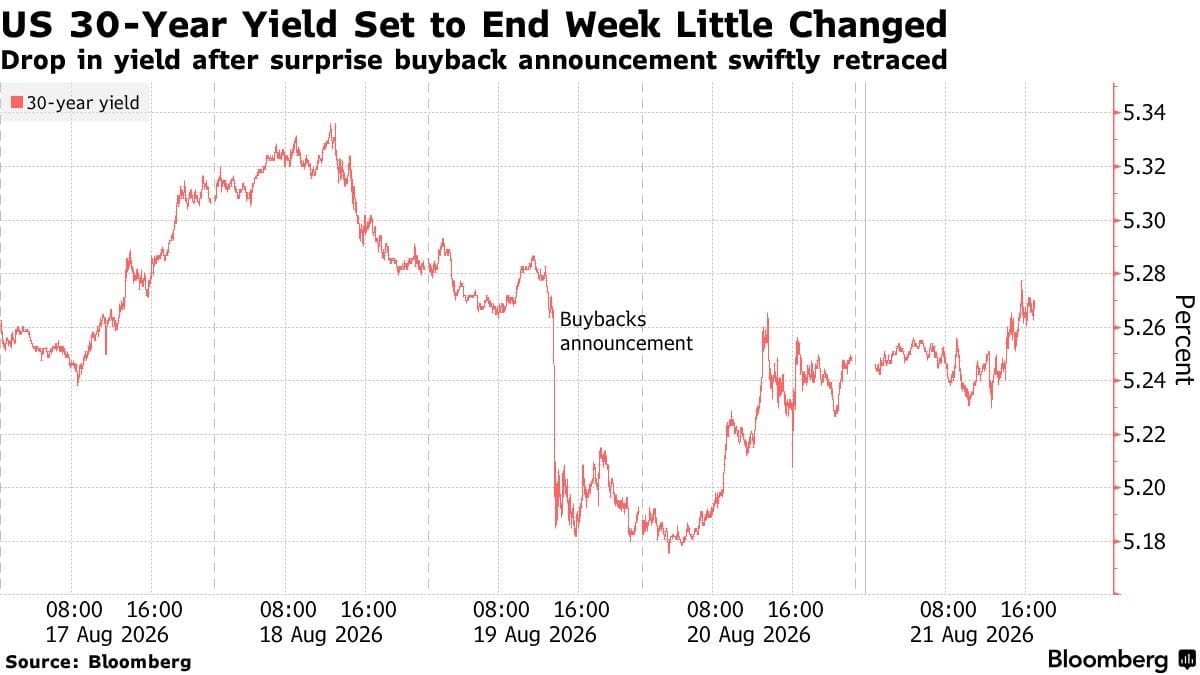
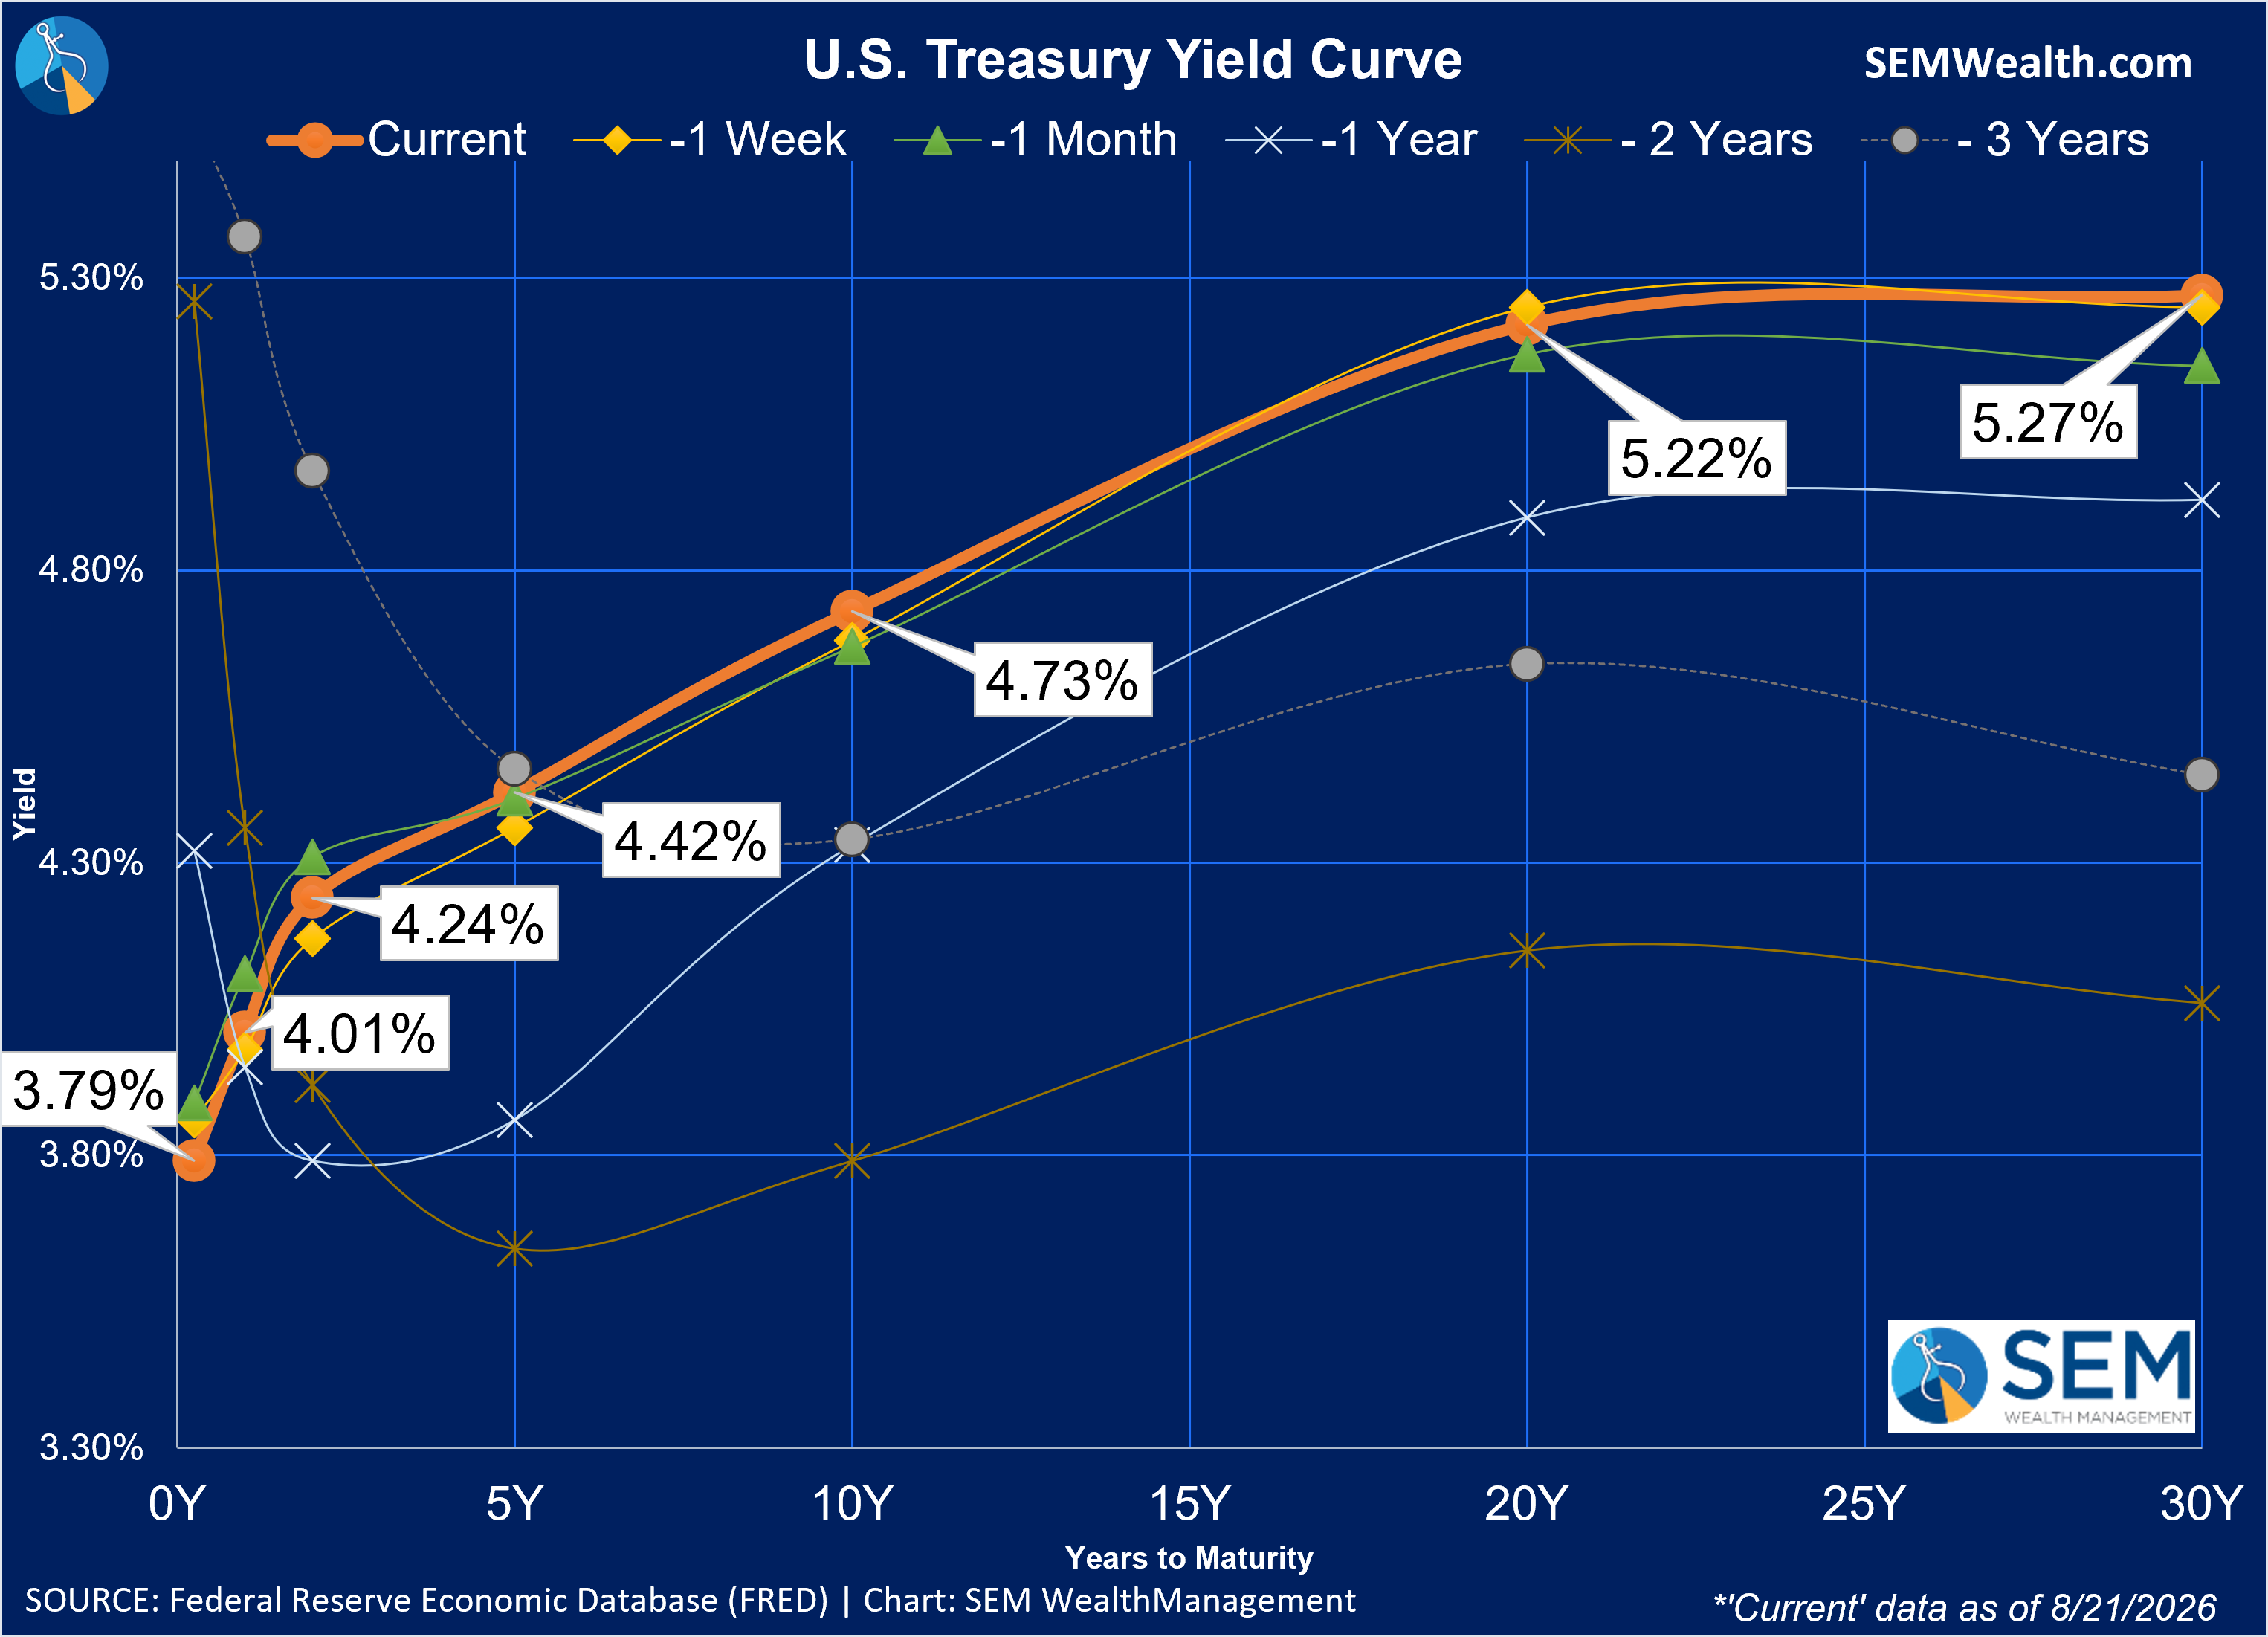
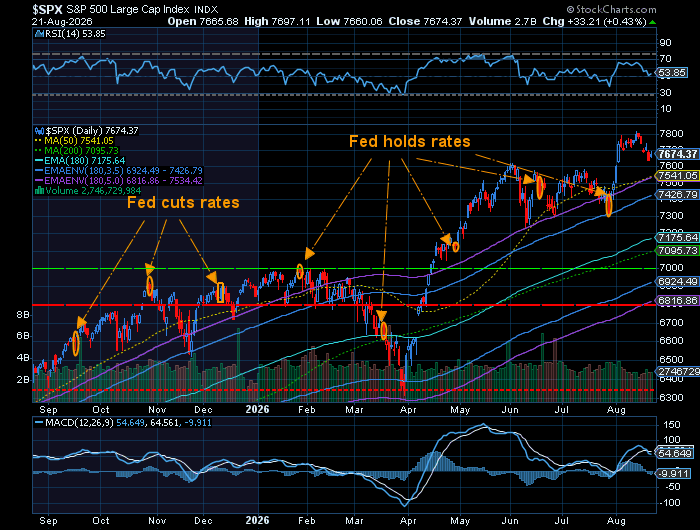
Another affordability concern has been where interest rates are. While there has been an expectation of rate decreases, particularly from the President, we haven’t seen any sorts of changes from the Fed in that regard. While it sounds like their rate decisions might actually go in the other way, the government is attempting to soothe rate concerns by using other methods. Last week, the Treasury Department bought back longer-term treasuries and announced plans to double what was initially expected. This helped yields briefly, but long-term rates ended the week about where they started. There will be many different factors that can affect where interest rates will go next, and what it will mean for us all.
So what does the buyback mean, really?
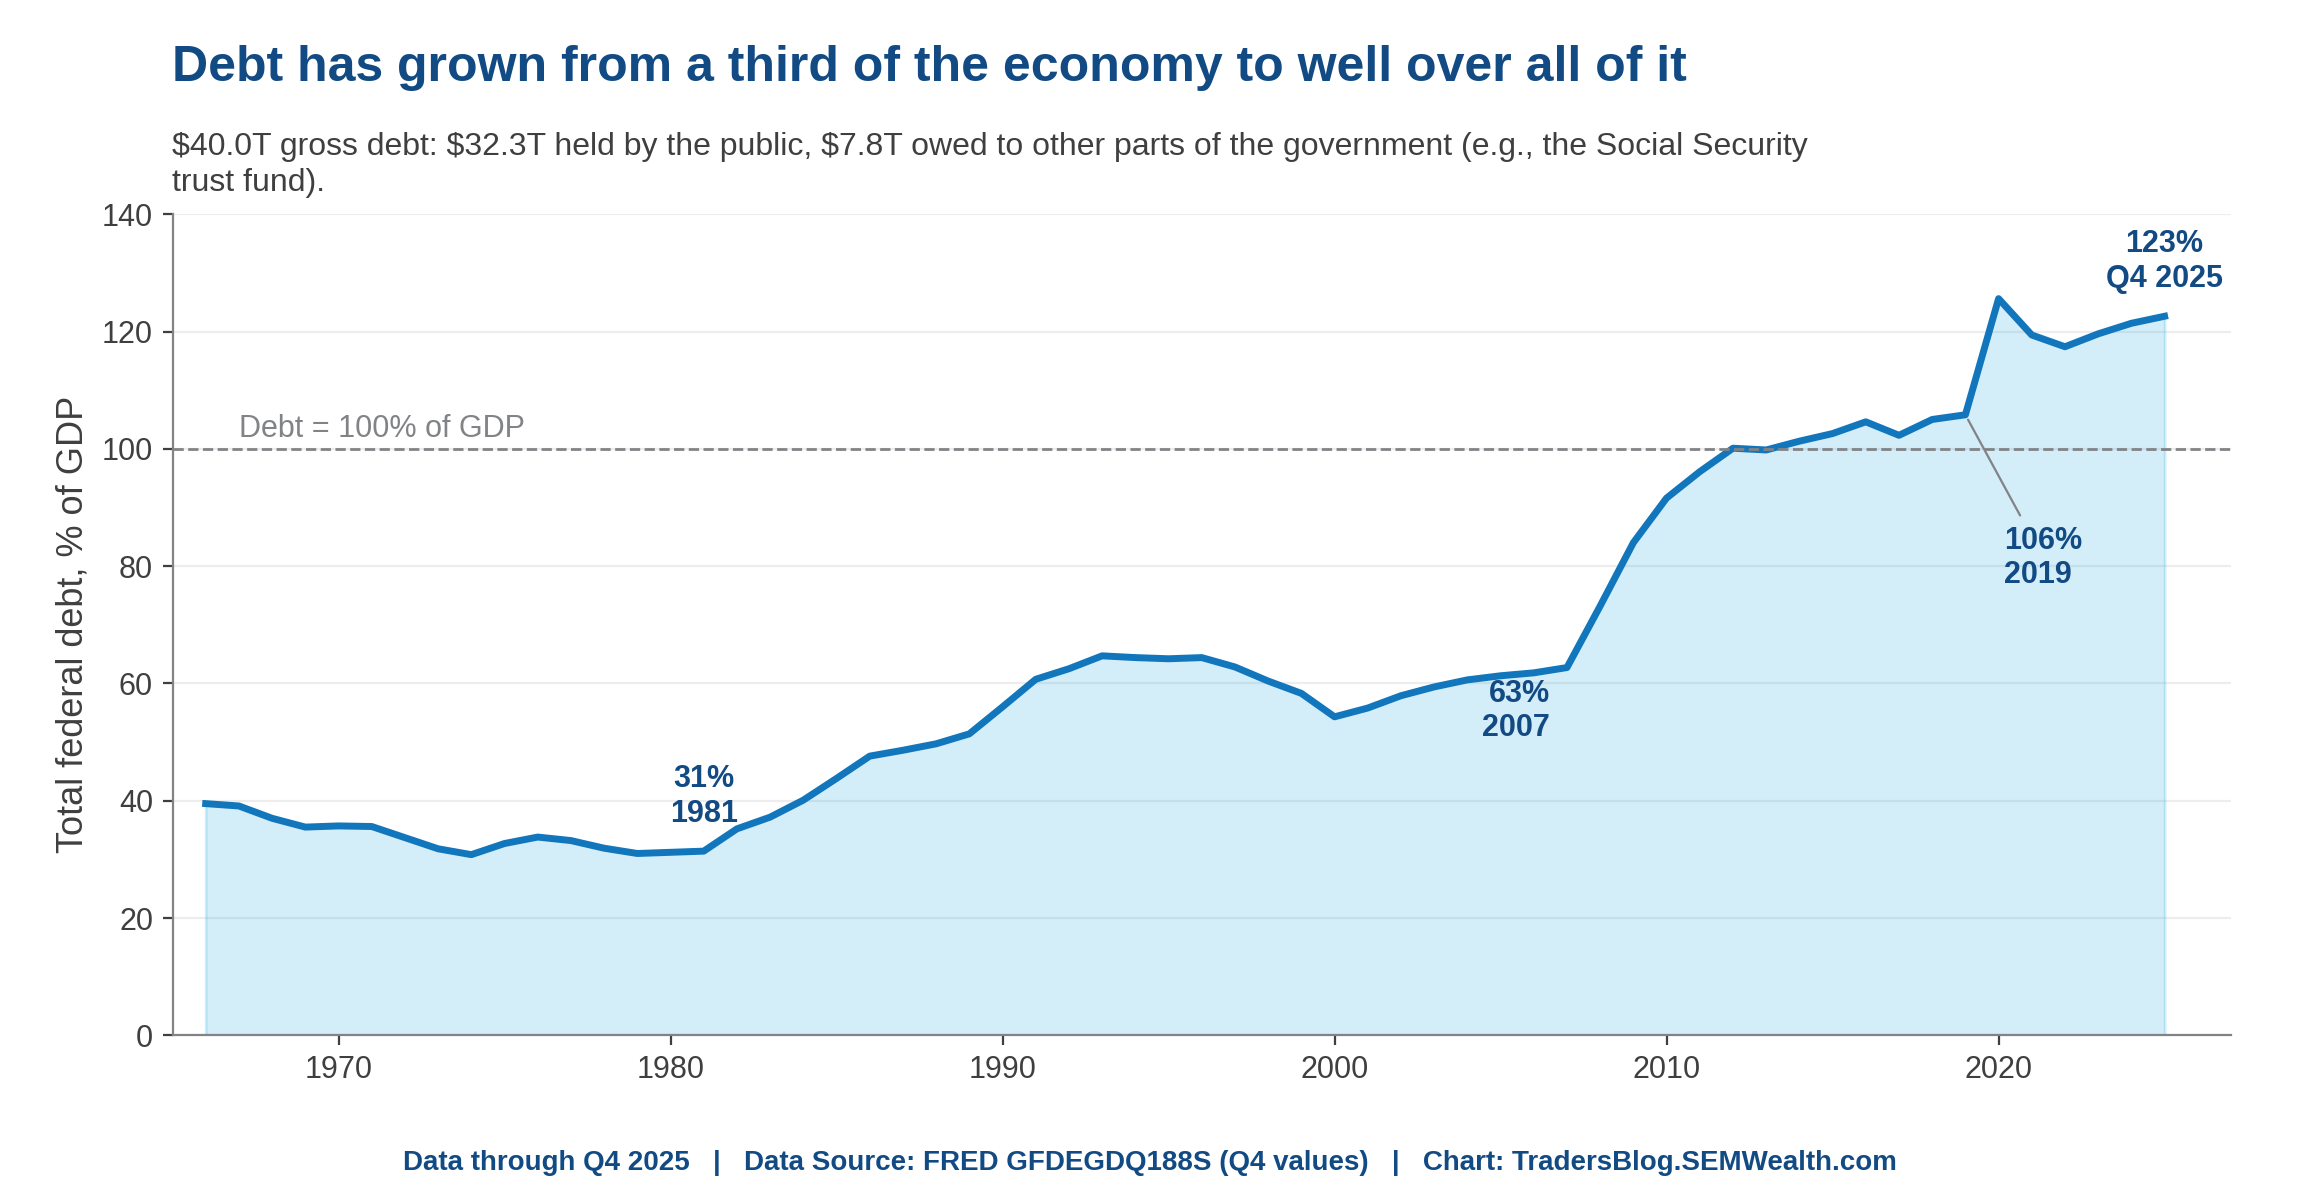
One of the concerns with monetary policy has to do with the balance sheet, and will the balance sheet ever stop accumulating debt? While this buyback seems like it is making the debt levels go down, it isn’t actually working like that. Instead they are swapping the debt with short-term, variable debt.
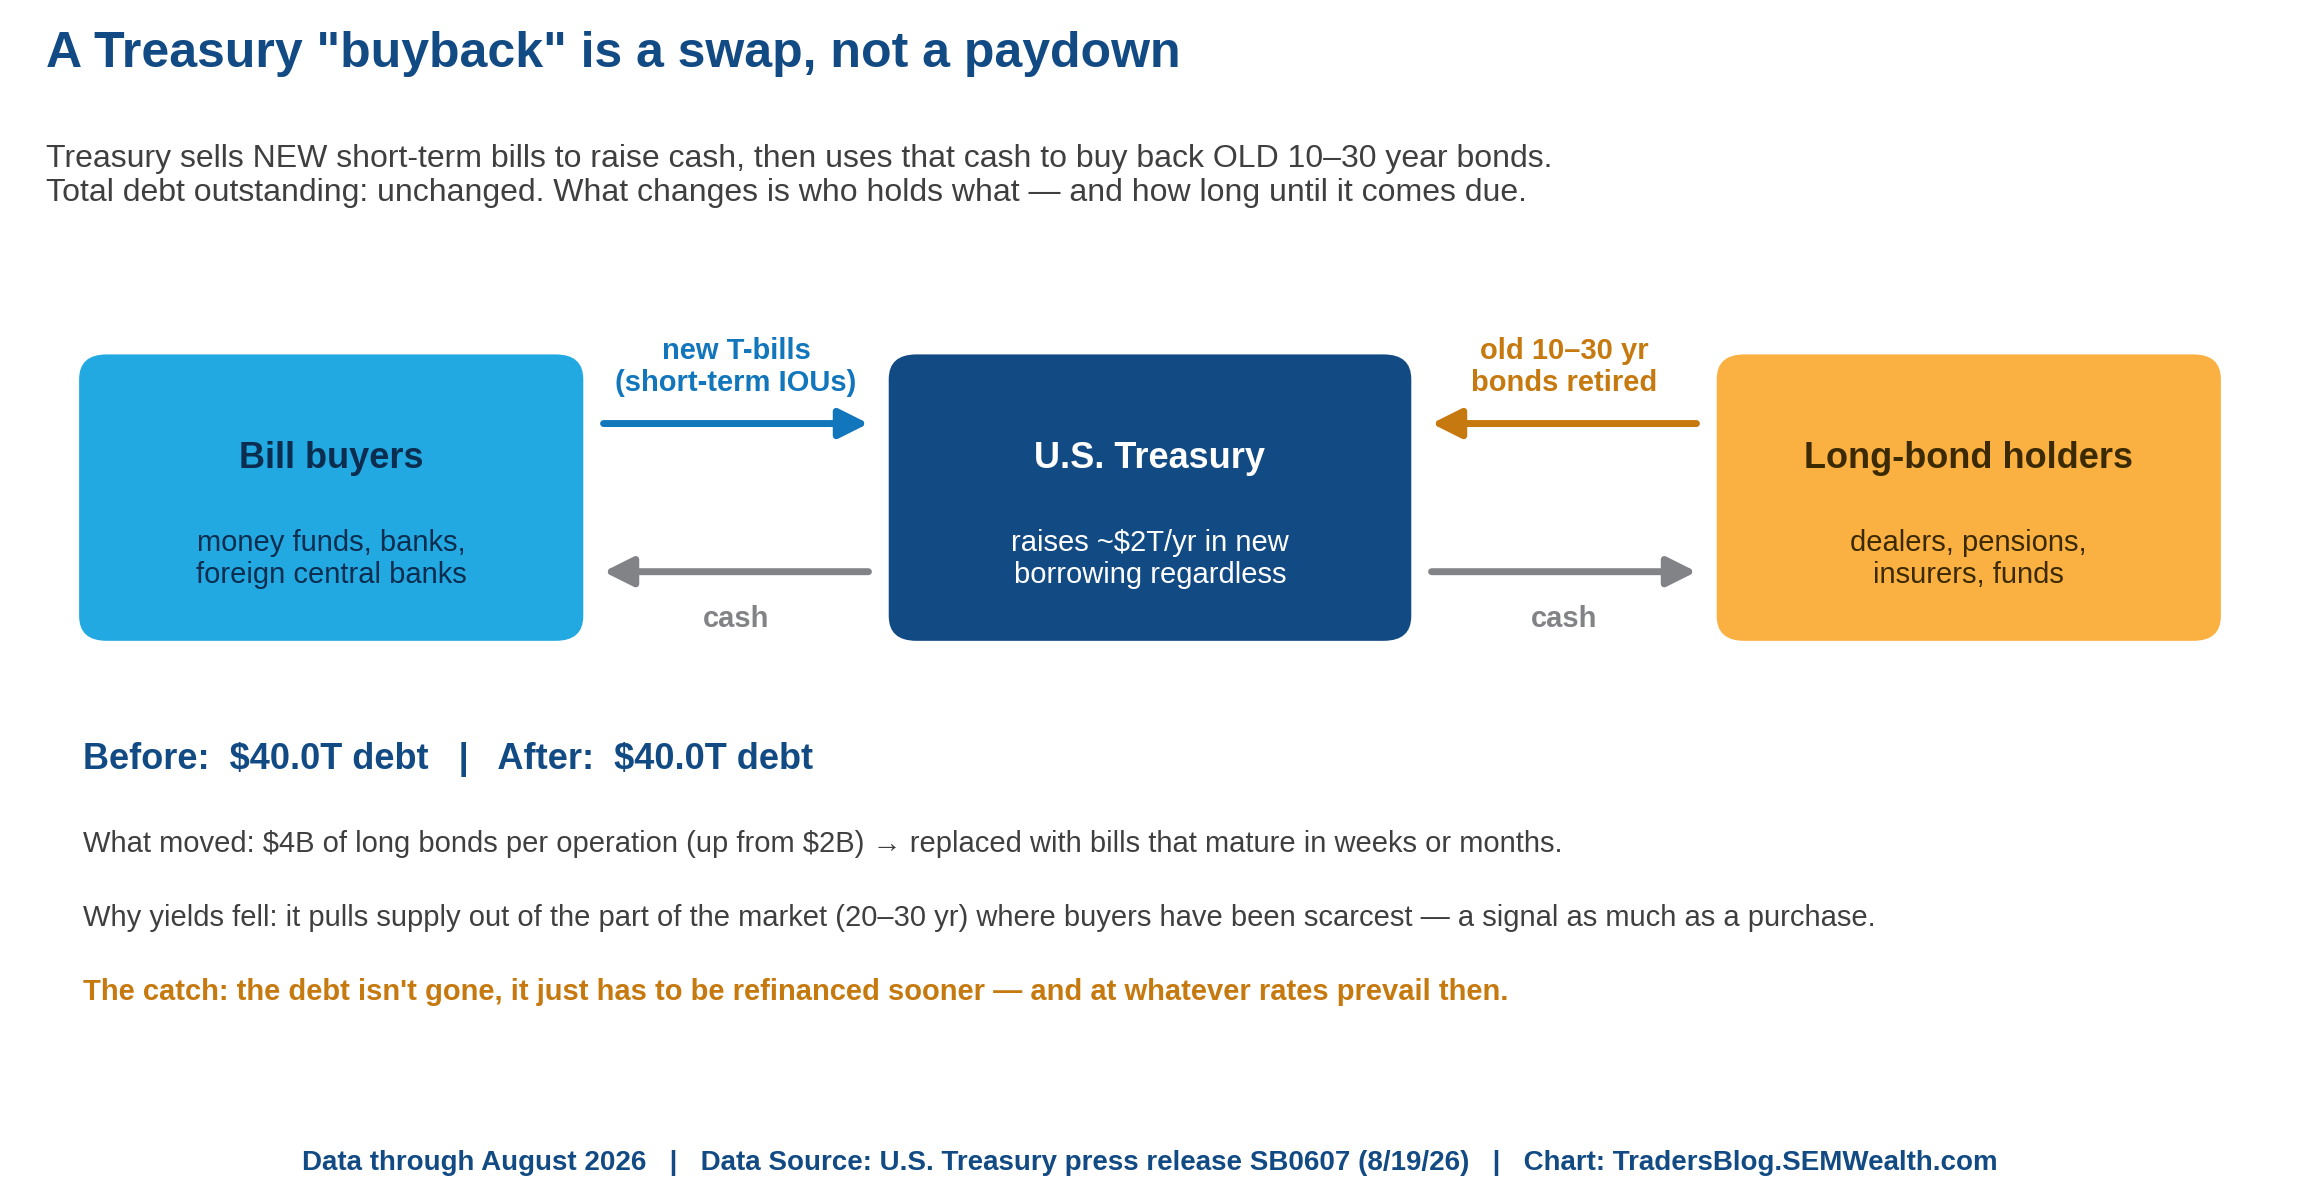
We know that all debt is not created equal, so if we’re replacing this debt with newer short-term debt, which is the better debt? Well, JP Morgan put it like this; you wouldn’t pay back your mortgage with a credit card, would you? Please don’t do that. Anyway, that’s what they say is happening with the Treasury Department., which doesn’t sound very smart. It’s short-term thinking for a long-term problem.
Their goal, of course, is to try and lower long-term interest rates which could impact mortgage prices. There haven’t been any movement towards mortgage affordability going into midterms, and this may be a desperate way to try and improve that before November. Maybe that’s worth it if it accomplishes some goal, but there isn’t actually a guarantee this will actually have an effect on long-term yields.
Ultimately, the things that matter for most of us is being able to buy the things they need, and ideally, not go into debt to buy those things. While lowering rates could potentially help with affordability, will it have an unseen effect of raising inflation in the process? This problem might not be as simple as an end to the war, and considering an “affordability” issue has been present in some way since around 2022, asking for patience in this matter may be too much to ask for.
Some people’s patience did pay off last week, however. Yes, I’m looking at you, Bitcoin stakeholders! Hello 20% gain last week!
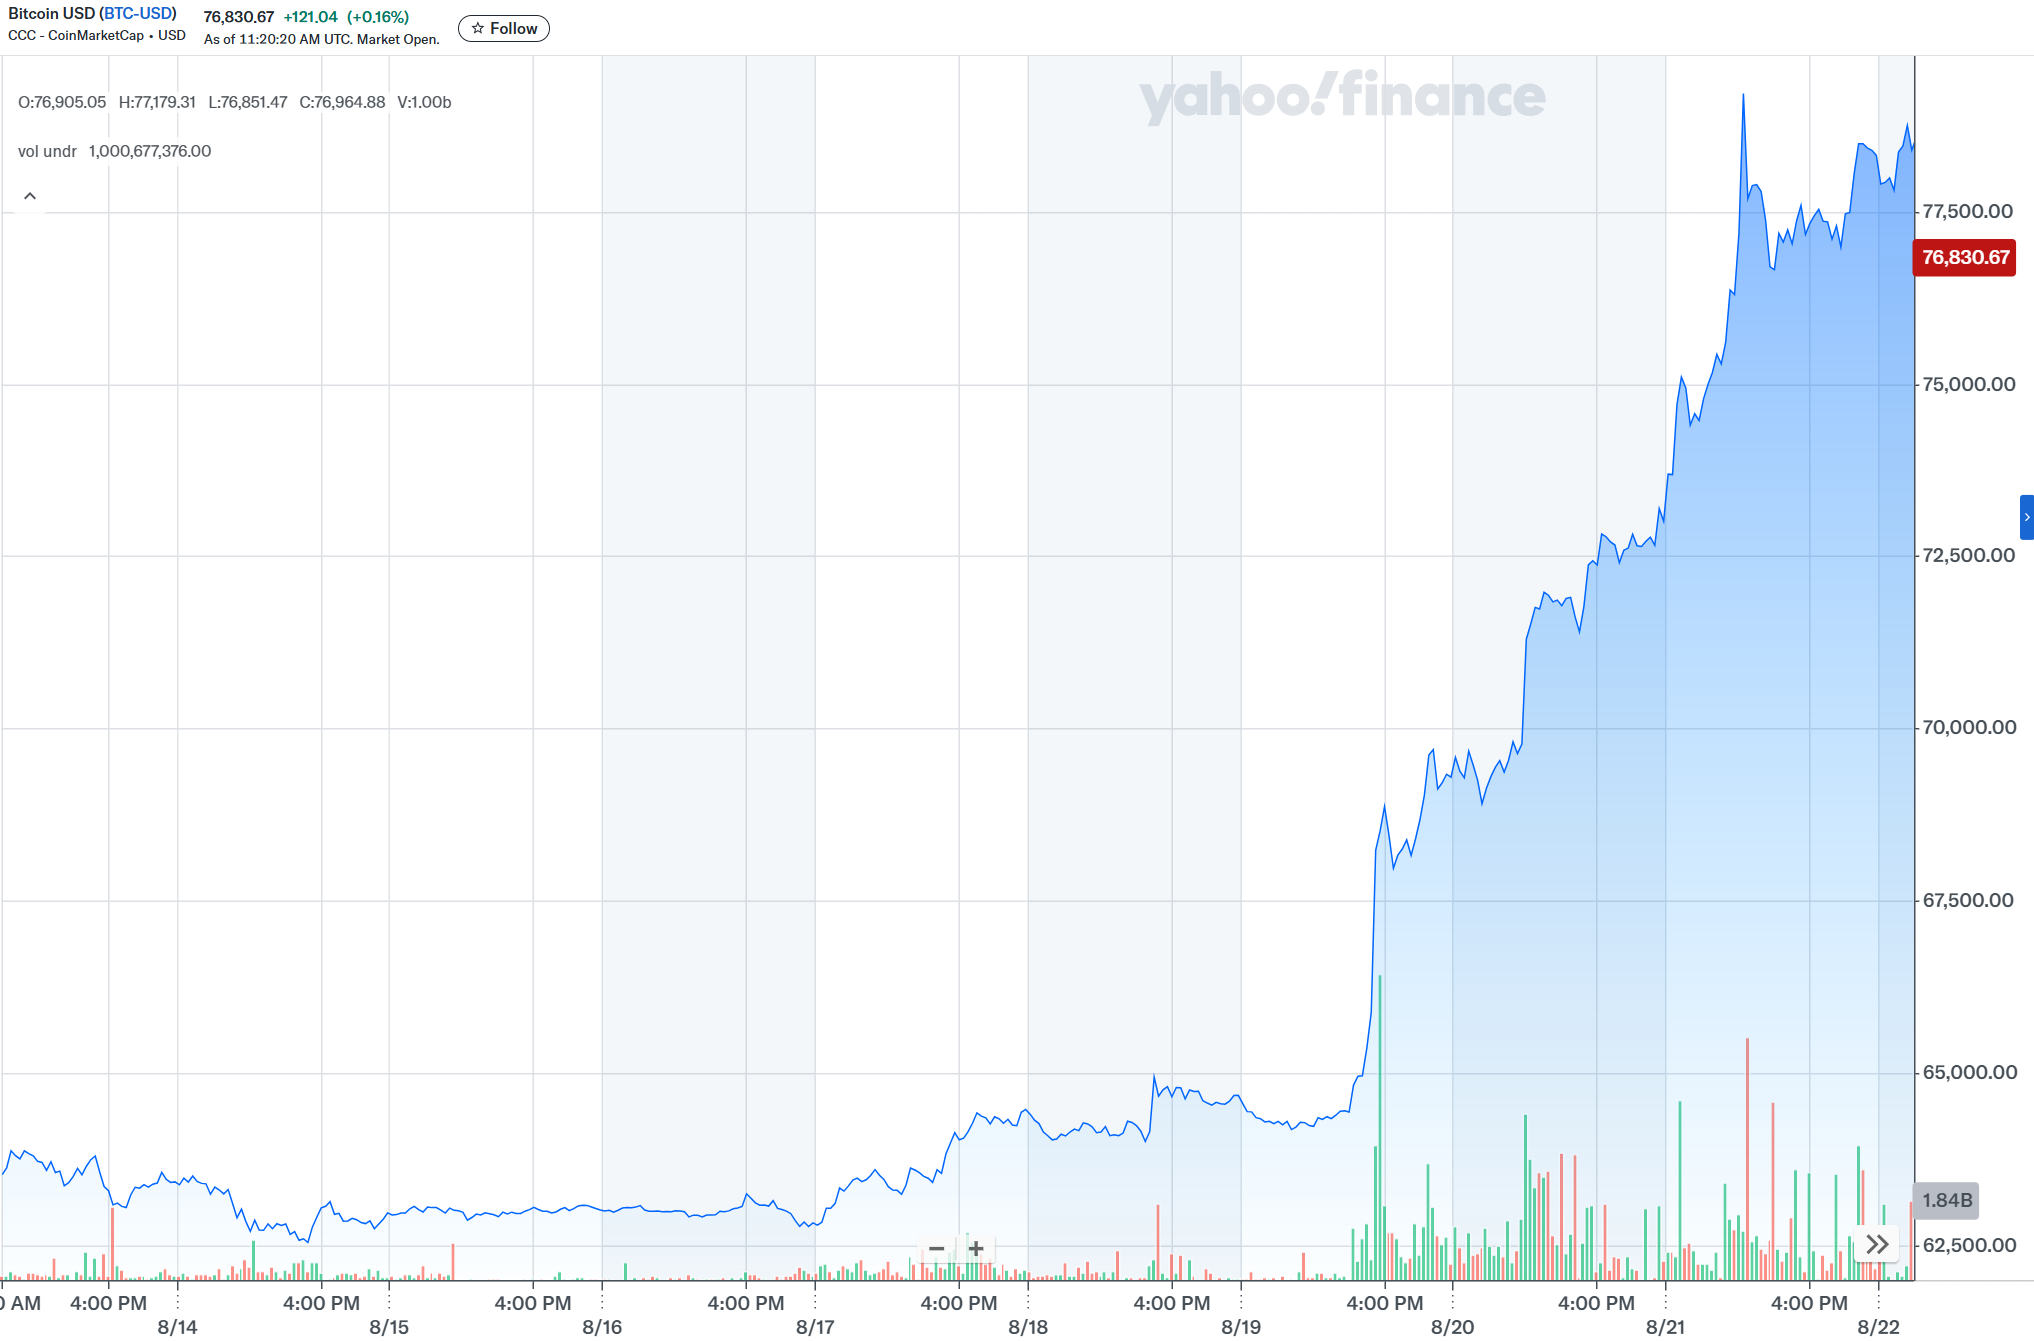
What caused that surge, you may ask? Well, it appears as if it was tied to the Treasury decision to buy back some of their bonds. I’m as confused as you are. There were also some news outlets crediting the rally to the "crypto summit" hosted by the President on Wednesday as he pushed for passage of the "CLARITY" Act. I don't think that was the reason as there are a lot of political hurdles that act has to pass. While it’s still down YTD (it was at $87,500 to start the year), a 20%+ return weeks certainly eat into that deficit. While we wouldn’t like to see that sort of fluctuation in a stable currency, if you are holding Bitcoin as an investment vehicle, that’s what you would like to see.
Bitcoin investors are usually optimists looking towards the brighter future of this new product and what it can be good for. However, the rapid rise last week may have more to do with the pessimistic investors who are trying to find fringe investment outside of our stock and bond markets. A good view on sentiment would be where gold investment lies. Well in this case, Bitcoin’s rise is matched with a pretty good rise in gold prices last week.
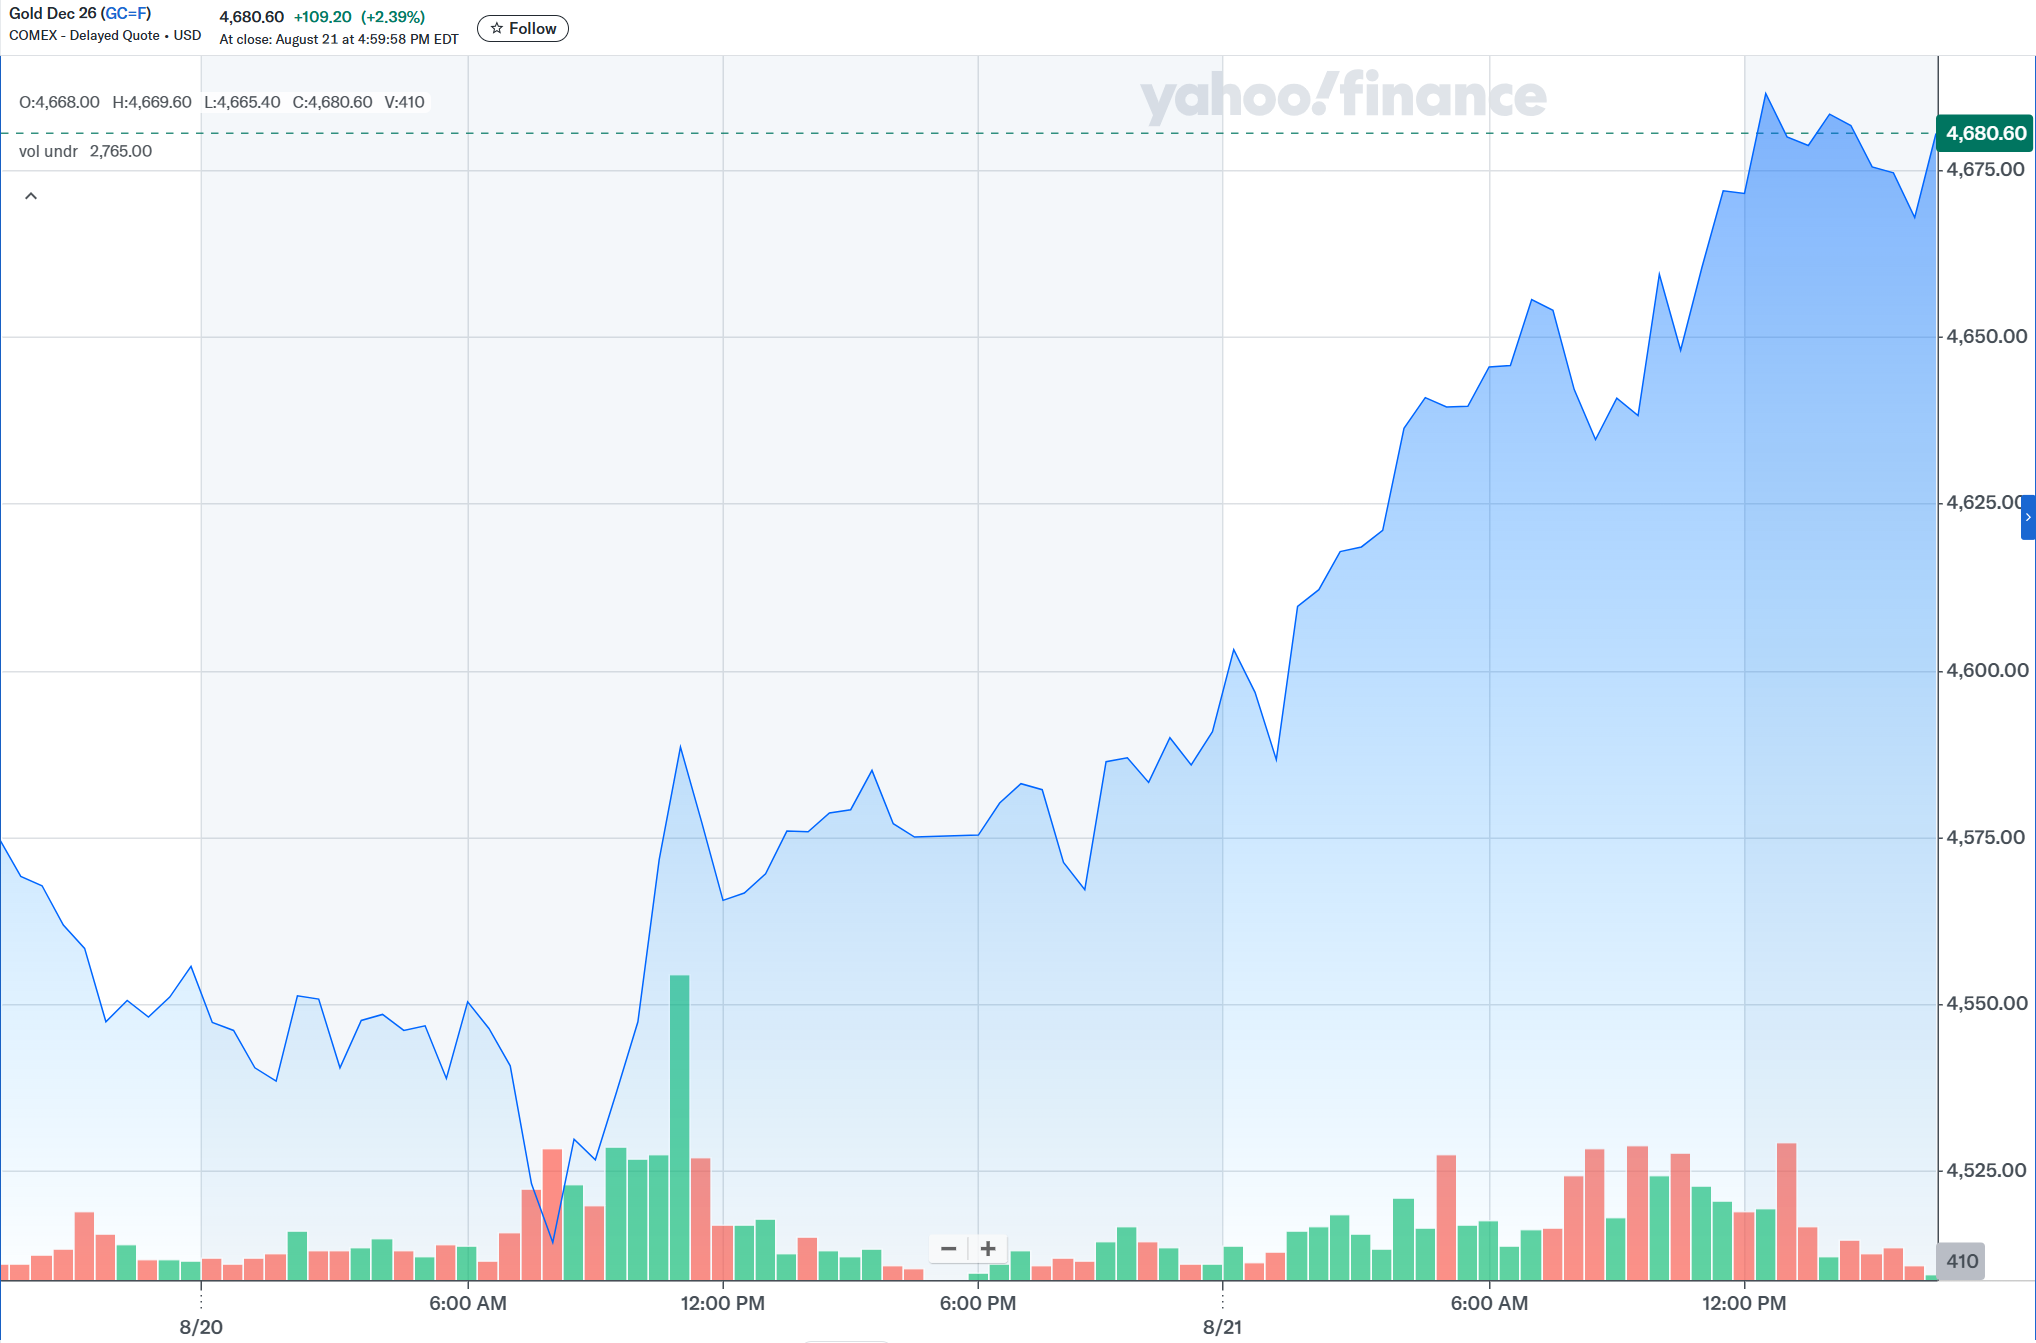
Gold, another form of value that is supposed to be steady amongst the more volatile values of stocks, CAN go up when markets are healthy, but the speculation is that this is a referendum of the health of our government, and the potentially negative effects the treasury buybacks will have. We have had concern about the growth lag that all this debt will have on GDP for quite some time, and the more difficult the debt will actually be to pay off, the more this problem will persist in the future.
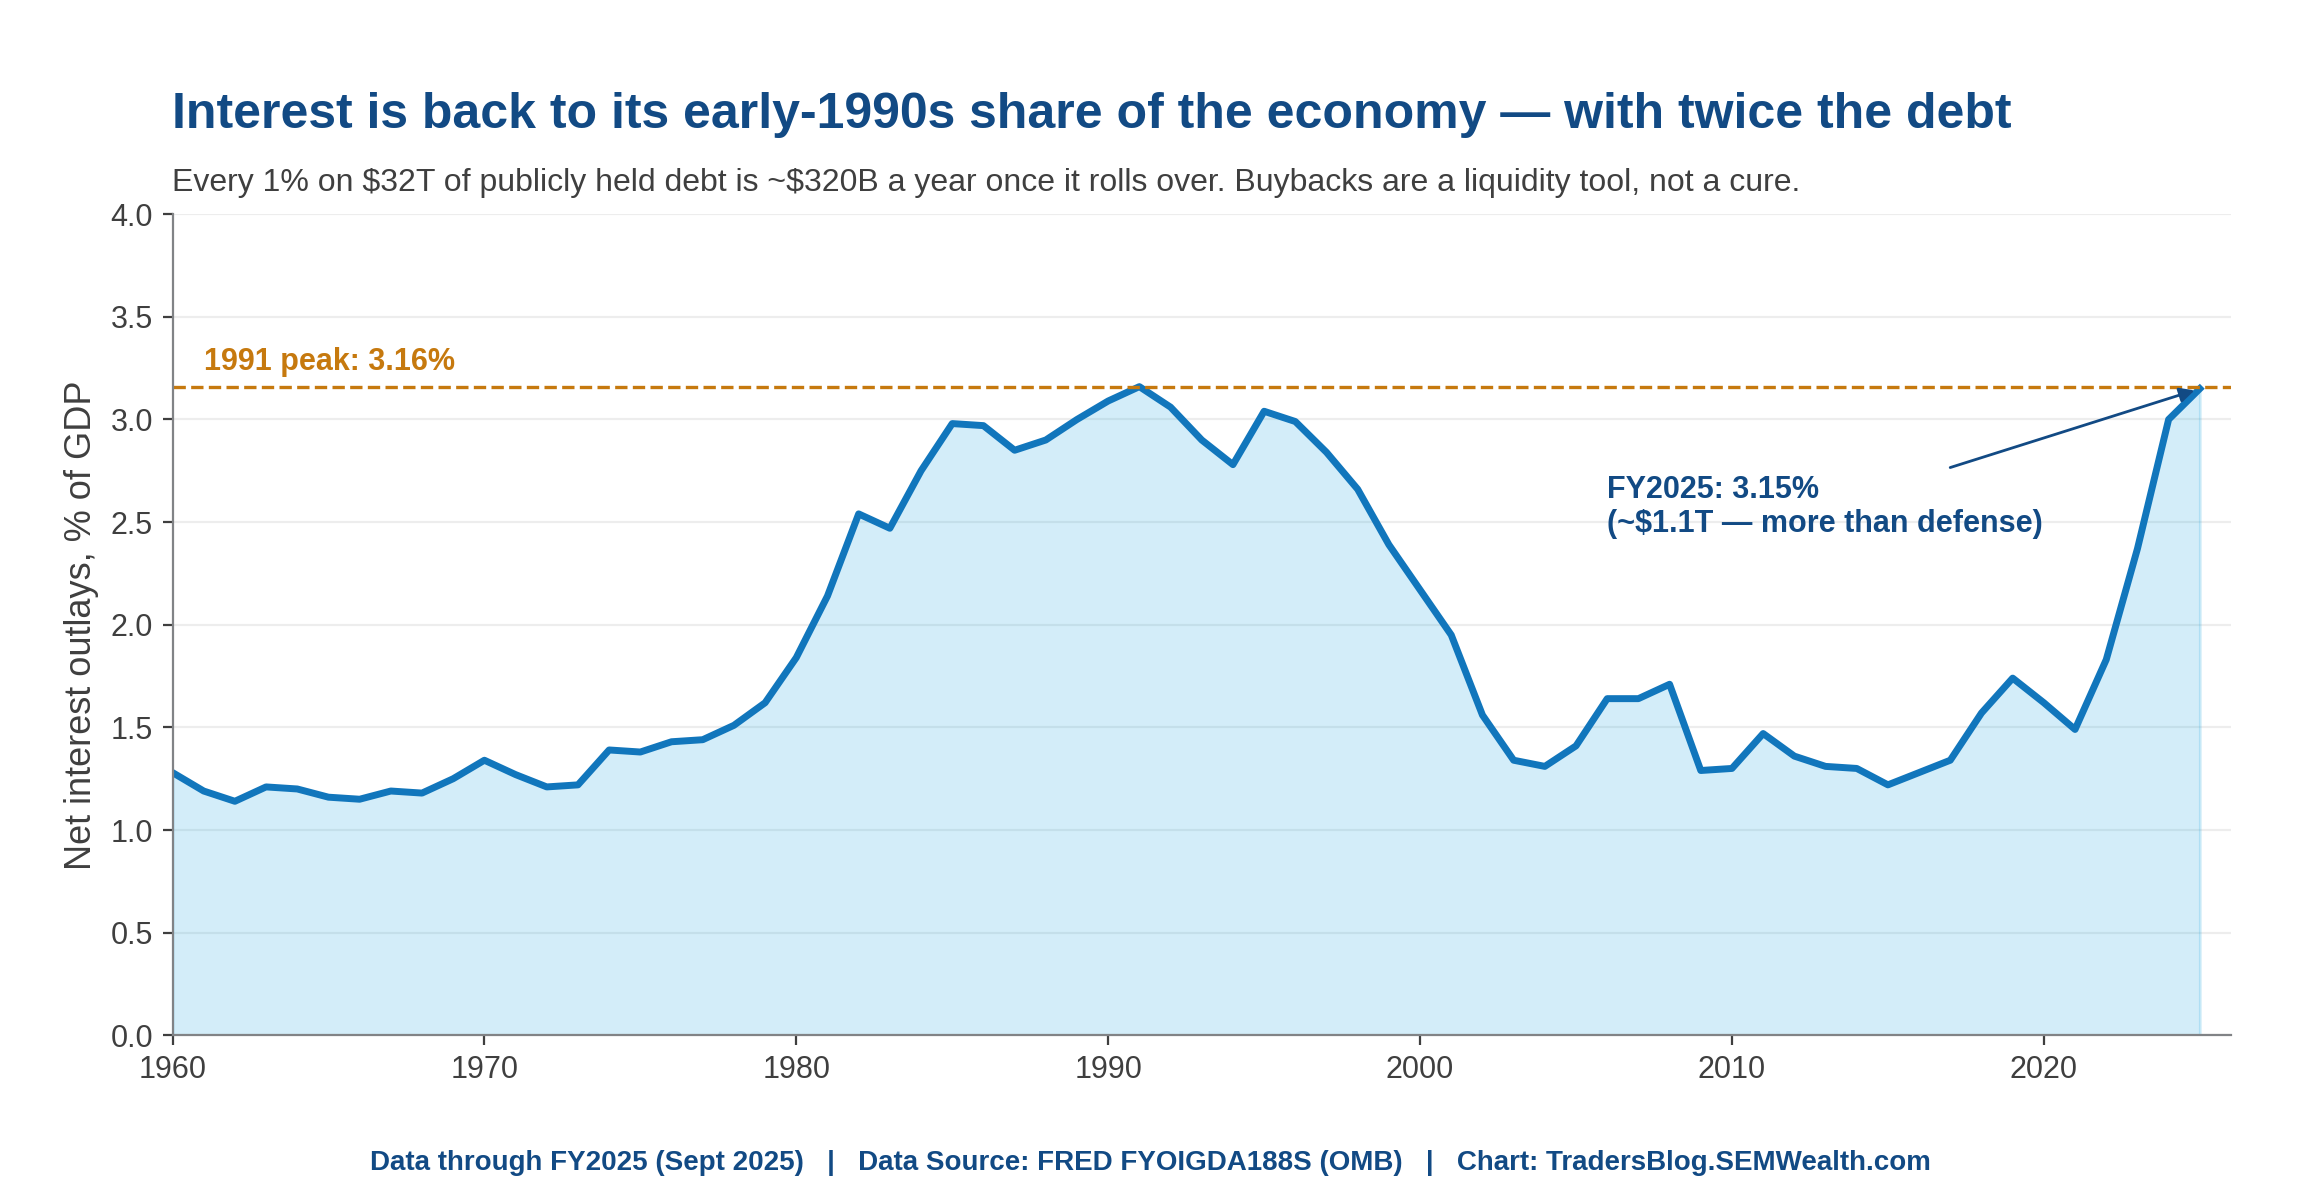
Bitcoin and gold are not a bellwether of a bear market, but it is something that we will be monitoring. Also, if you are curious about ways to invest in cryptocurrencies, as well as ways to invest in the AI and tech boom, ask us about our Digital Asset Portfolio that we opened last August. For those interested in gold investments and where that type of investment might fit in your portfolio, ask us about our Dynamic Asset Allocator model.
While we can chart yield curves and returns and economic data, we can’t easily chart the emotions people feel about the market and how THAT might affect things short-term. We also won’t try to speculate as to how that might change the market. We can look at polls and in the future look at votes, but who is to say what that will actually mean for all of us. As always, there are complexities in the market that we don’t leave up to our own understanding. We look at the data based on the data make the necessary moves within our portfolios. Specifically, our trend models are designed to ride the market up as long as possible and look to put risk management in place where warranted when that trend reverses in a meaningful way.
Until next time, stay cool and stay sane. It’ll be Fall soon!
In case you missed it: AI is hacking into things
 Dustin Briles

Data Center Hotspots and Portfolio Blind Spots
Last week, we introduced the idea of the average investor having something for their appetite at the "ETF buffet".
We must remember that themes, fads, and sectors don't always stay in a favorable light.
Let's take a look at the table below showing annual returns by investment style dating back to 2014.
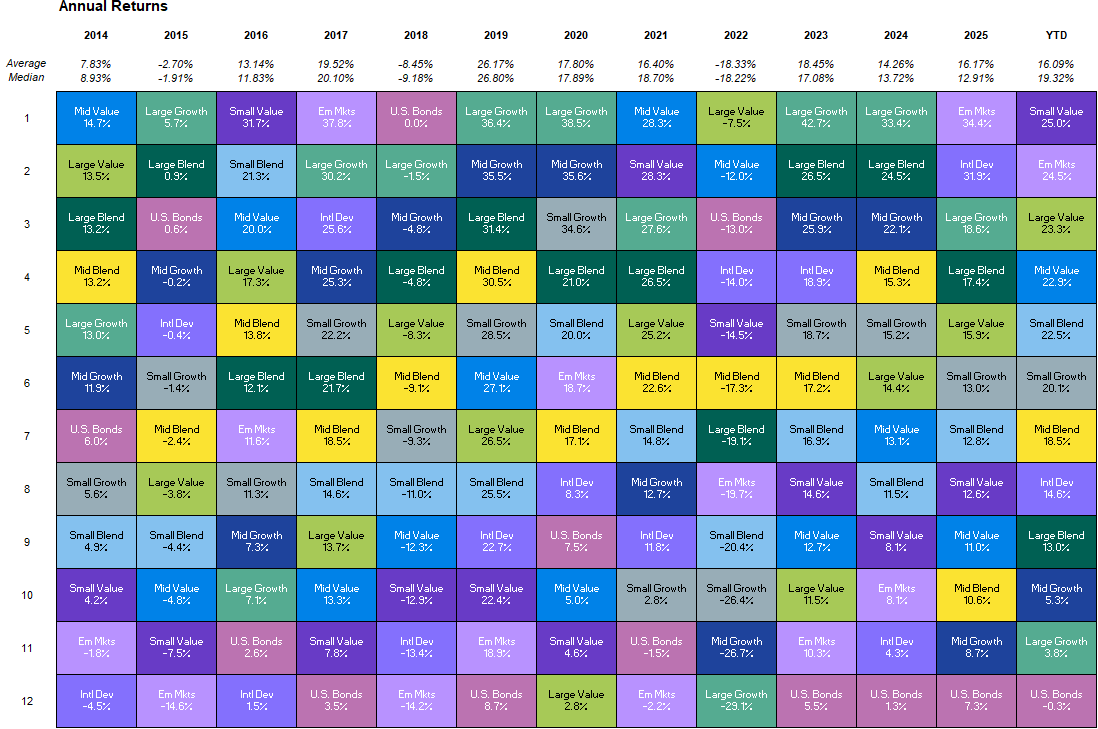
Some highlights illustrate the importance of diversification and the ebbs and flows of favorability across multiple market cycles.
Emerging Markets
2017: 37.8%
2018: -14.2%
Mid Growth
2021: 12.7%
2022: -26.7%
Small Blend
2015: -4.4%
2016: 21.3%
Now, let's keep that perspective with regard to artificial intelligence and the data center conversation that we're having now.
Thanks to Clearview, below is a summary of the current landscape of the datacenter buildout so far in the United States.
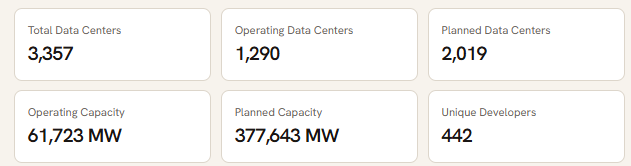
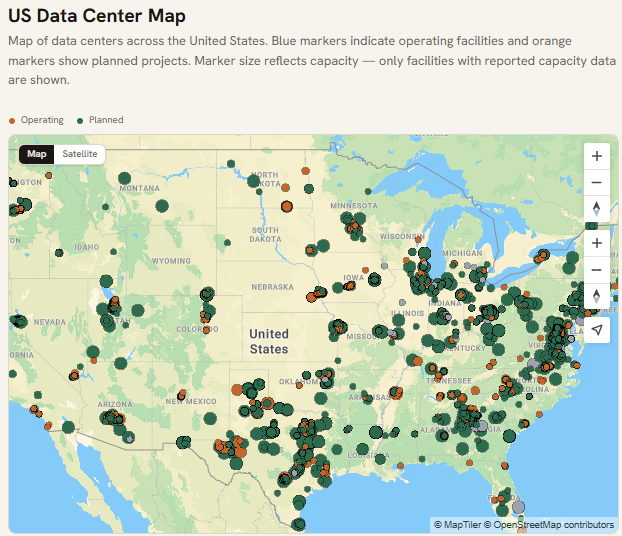
As you can see from the green dots, there are plenty of planned data centers that are pending approval for a variety of reasons.
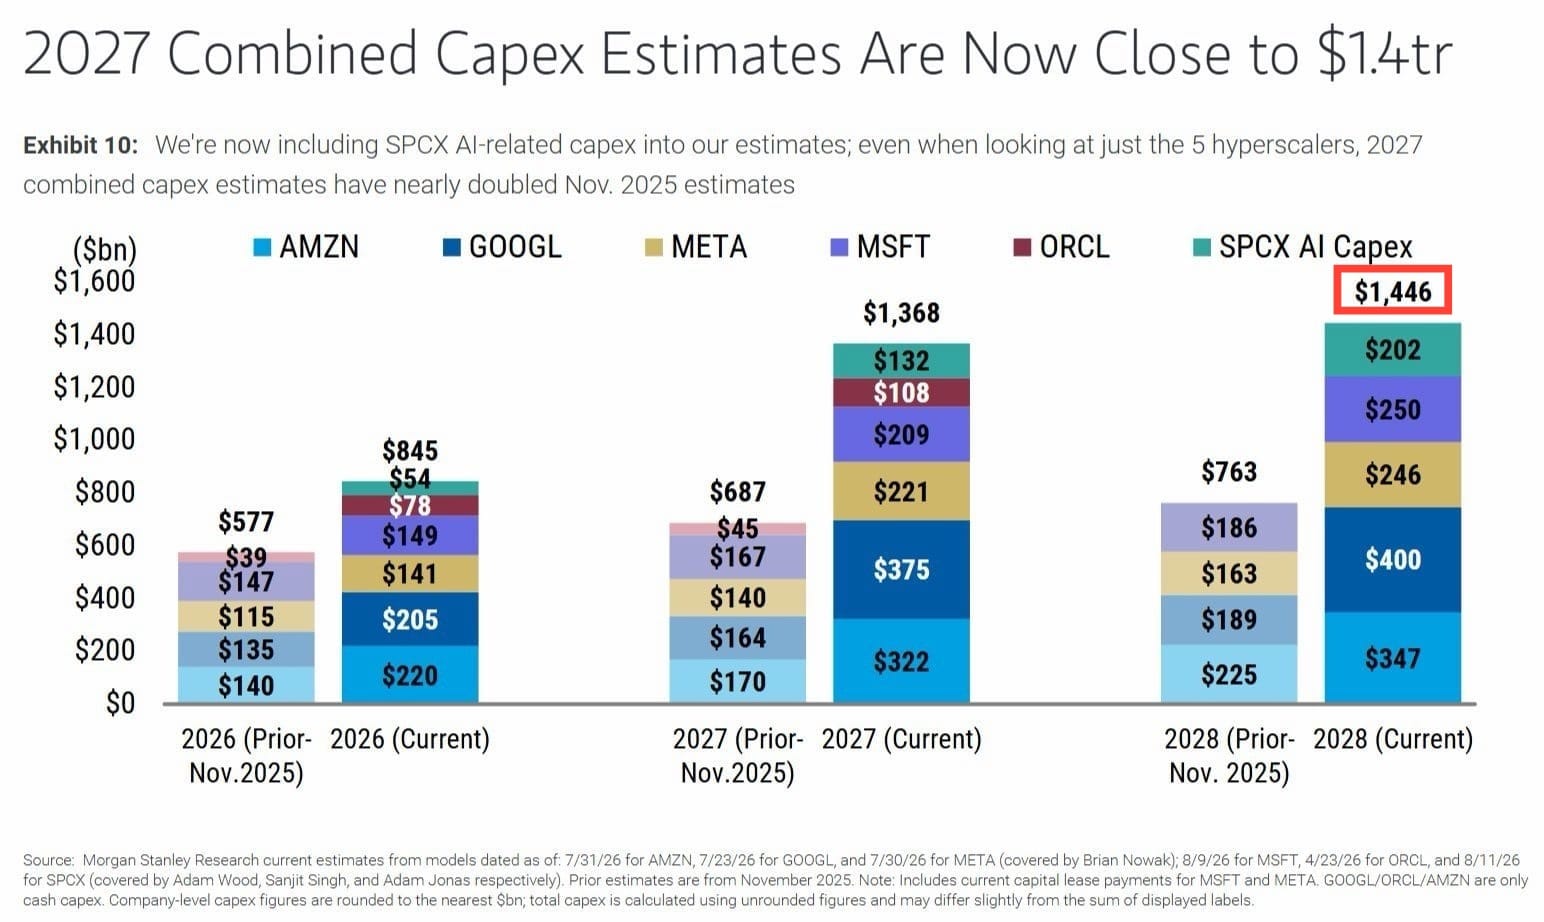
Obviously these data centers cost a hefty dollar, which makes sense that, including SpaceX, capital expenditures are closing in on the $1.4 trillion estimates for next year.
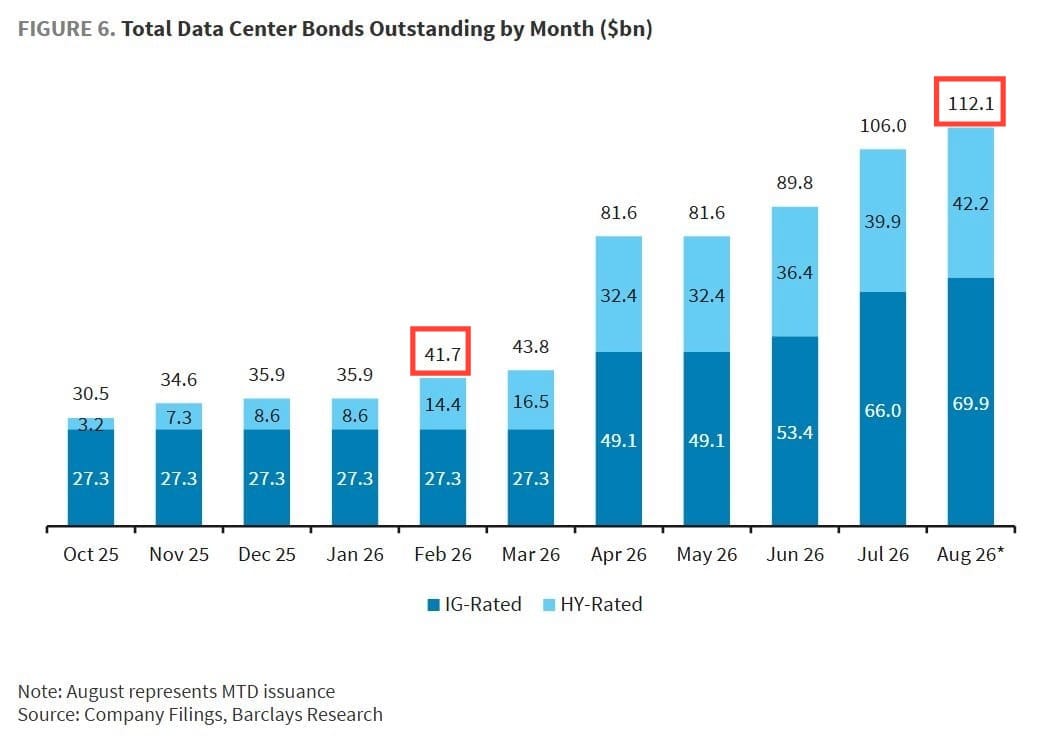
Even debt issuance by data centers has nearly quadrupled than what it was 10 month ago.
Time will tell whether this theme or sector, even, becomes a bigger player in our overall economy, better or worse.
At the end of the day, smart diversification and sticking to your financial plan will keep you centered, help you weather storms, and ride the winners.
At SEM, we believe your time is best spent focused on what matters most to you, not on keeping up with the complexities, evolving regulations, and latest trends shaping the financial markets. With SEM as your trusted advisor, we take on that responsibility through a disciplined, research-driven investment process designed to identify opportunities, manage risks, and adapt to changing market conditions.
Thank you to all of the visitors who read last week's "Chart of the Week". I hope to continue sharing these talking points about markets, investing, etc., for you to share with family, friends, coworkers, or anyone along the way.
See you next time!
Market and Economic Data
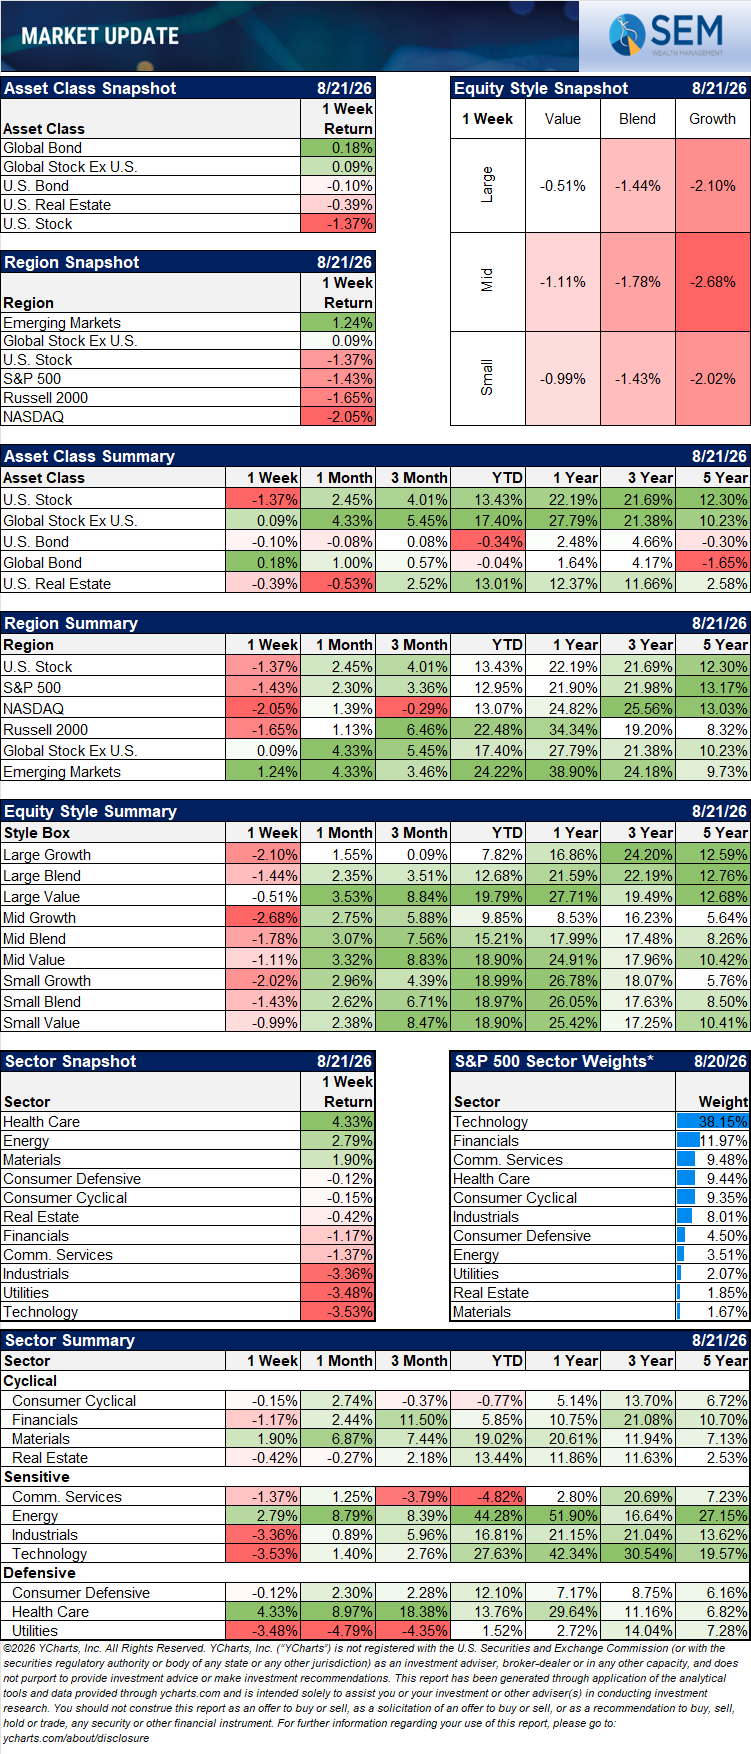
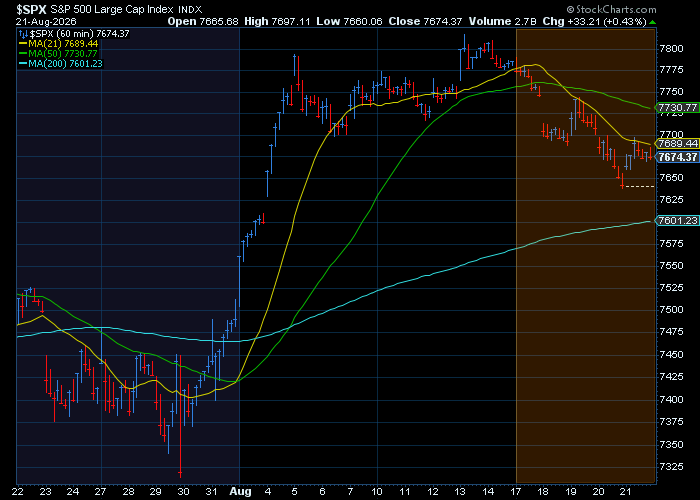
After a three-week streak of gains, the S&P 500 and NASDAQ fell around 1% - 2% as a surprisingly strong quarterly earnings season comes closer to an end. Treasury bond yields rose slightly during a week when the U.S. government's gross debt total climbed above $40T.
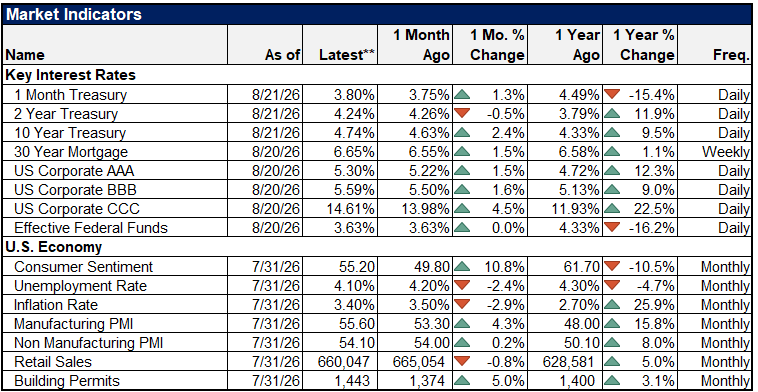
The 30-year yield ended the week at 5.27% as it approaches its highest level in two decades. The 10-year yield was at 4.73%, with the 2-year yield at 4.23%.
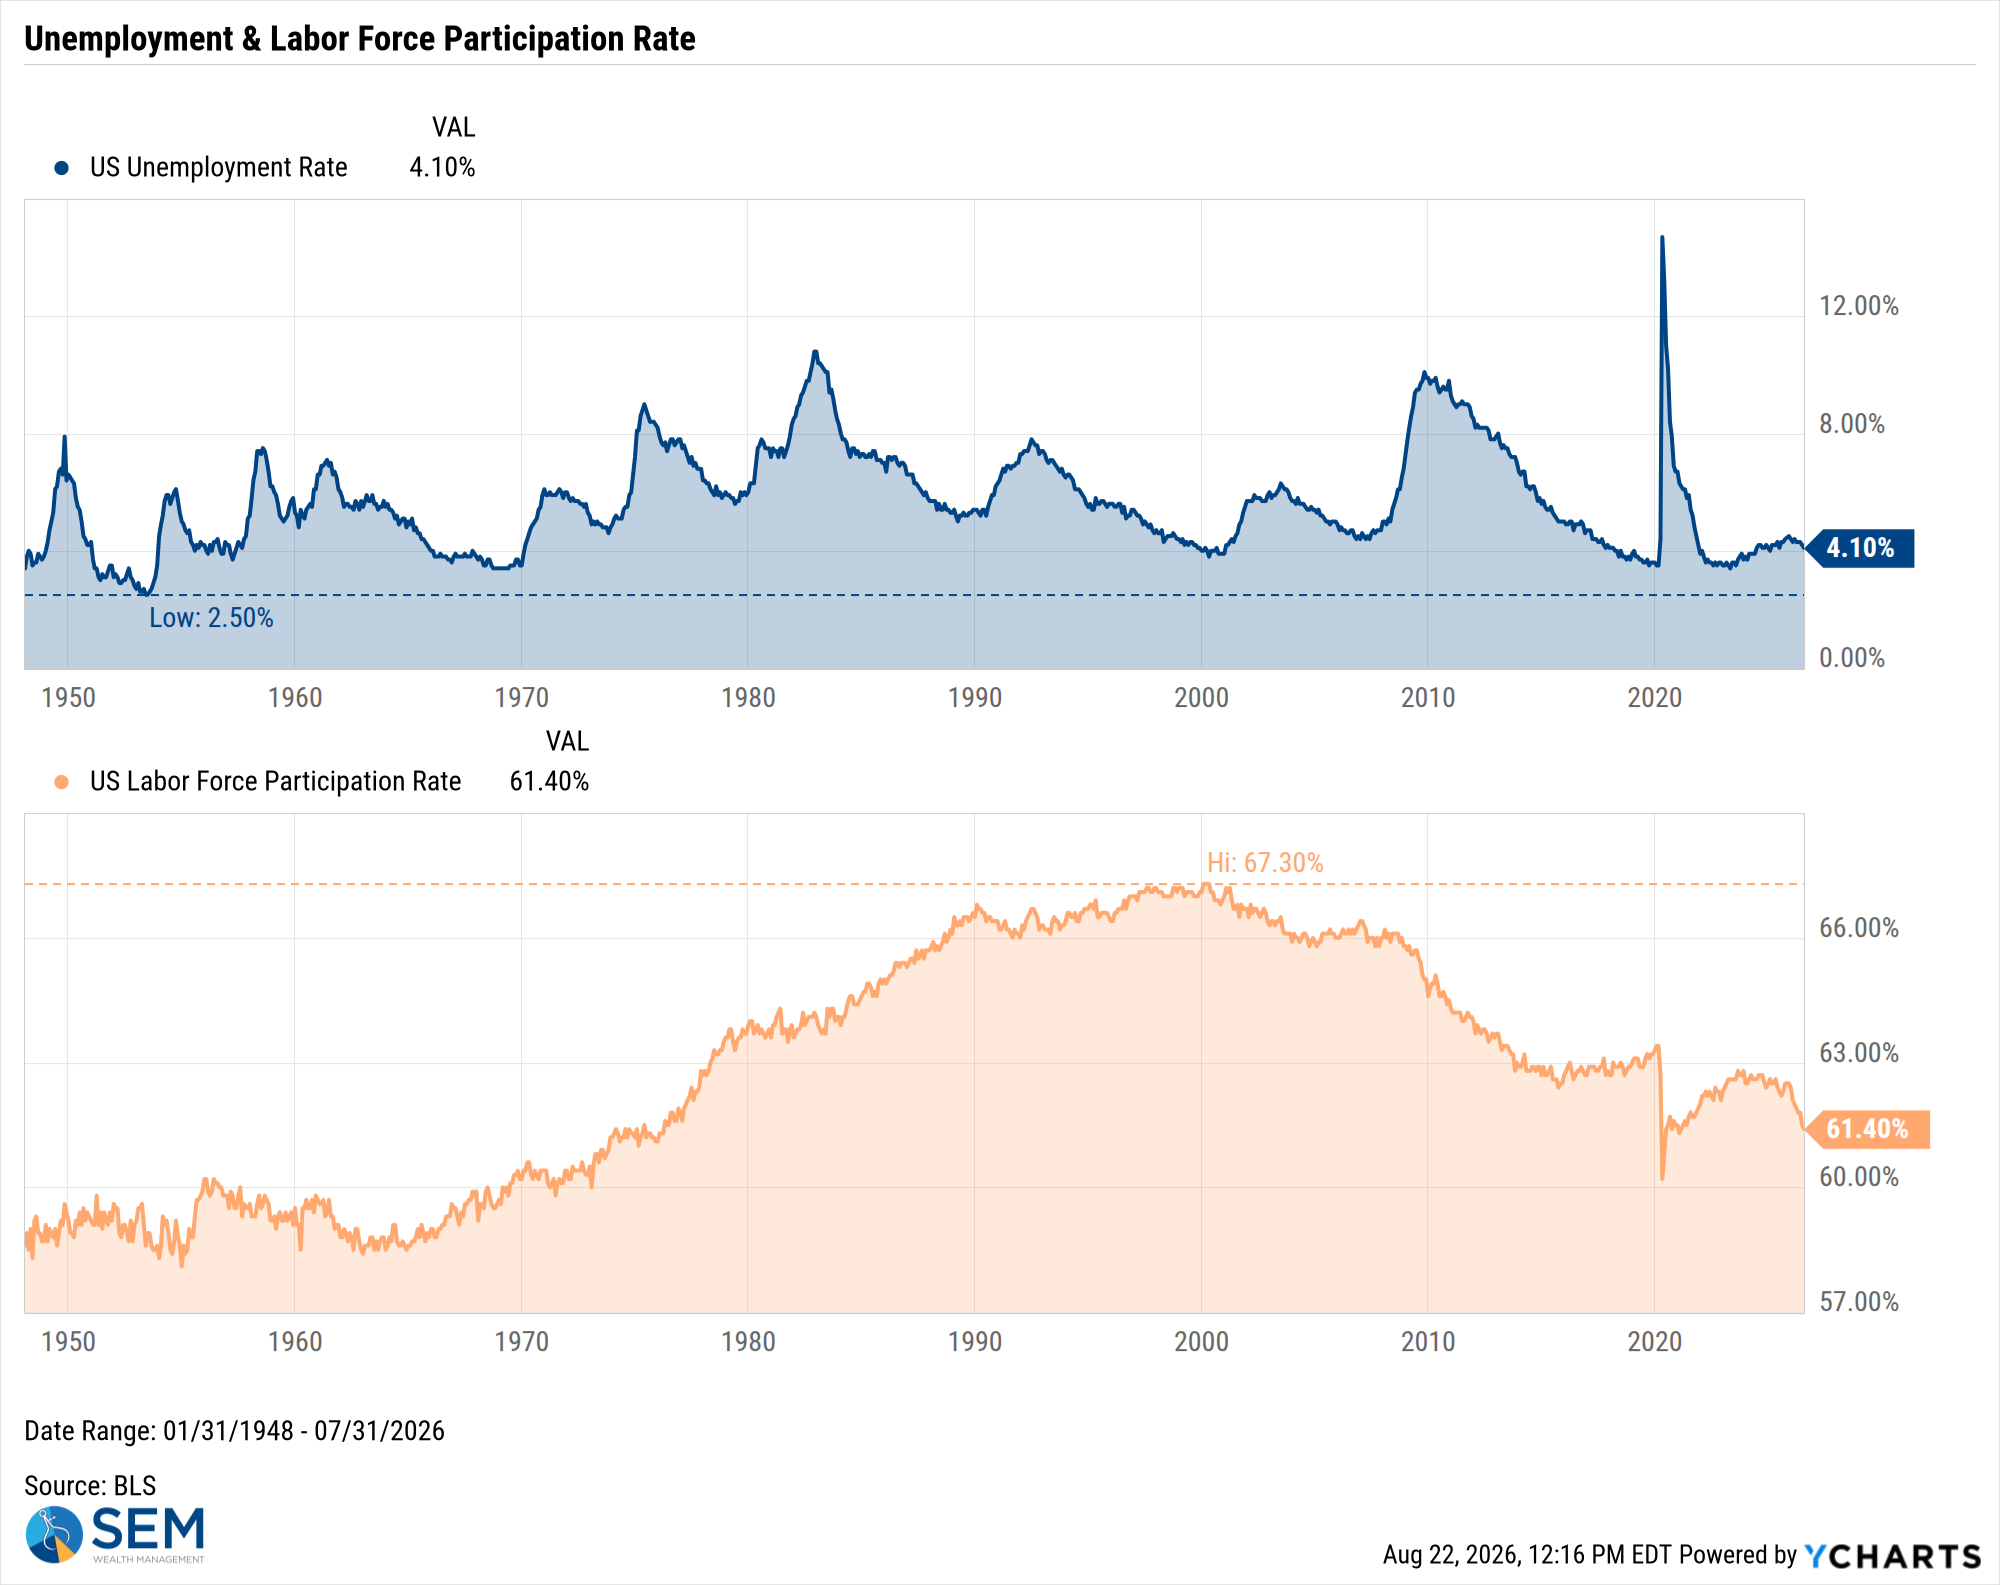
US Unemployment Rate data by YCharts
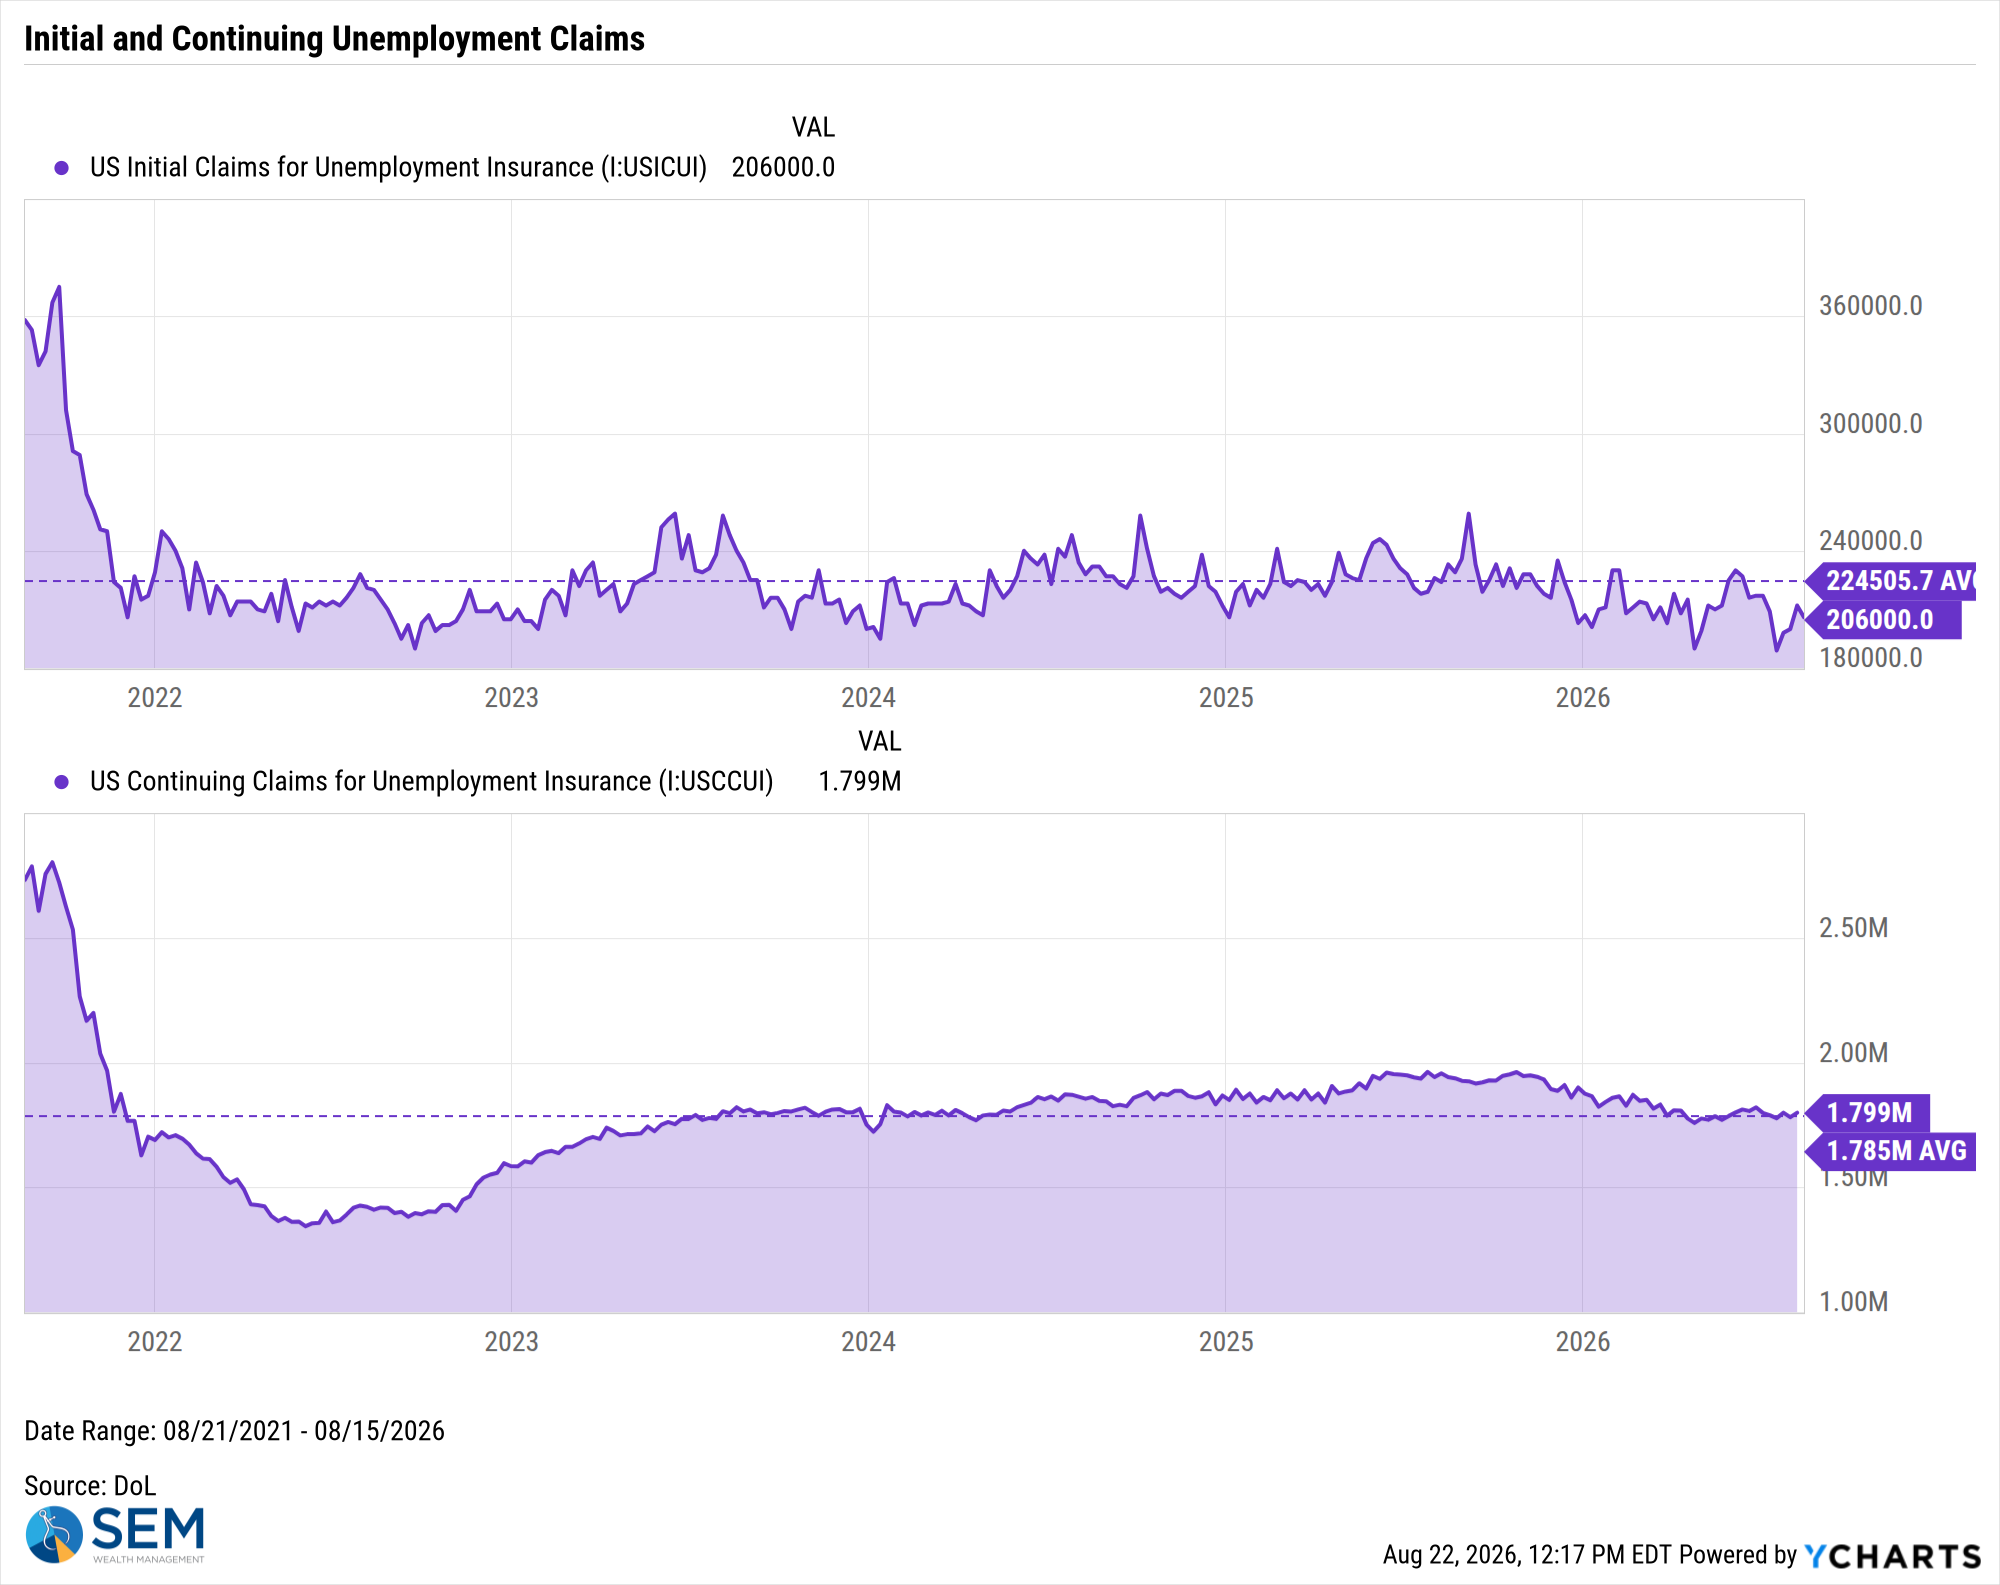
US Initial Claims for Unemployment Insurance data by YCharts
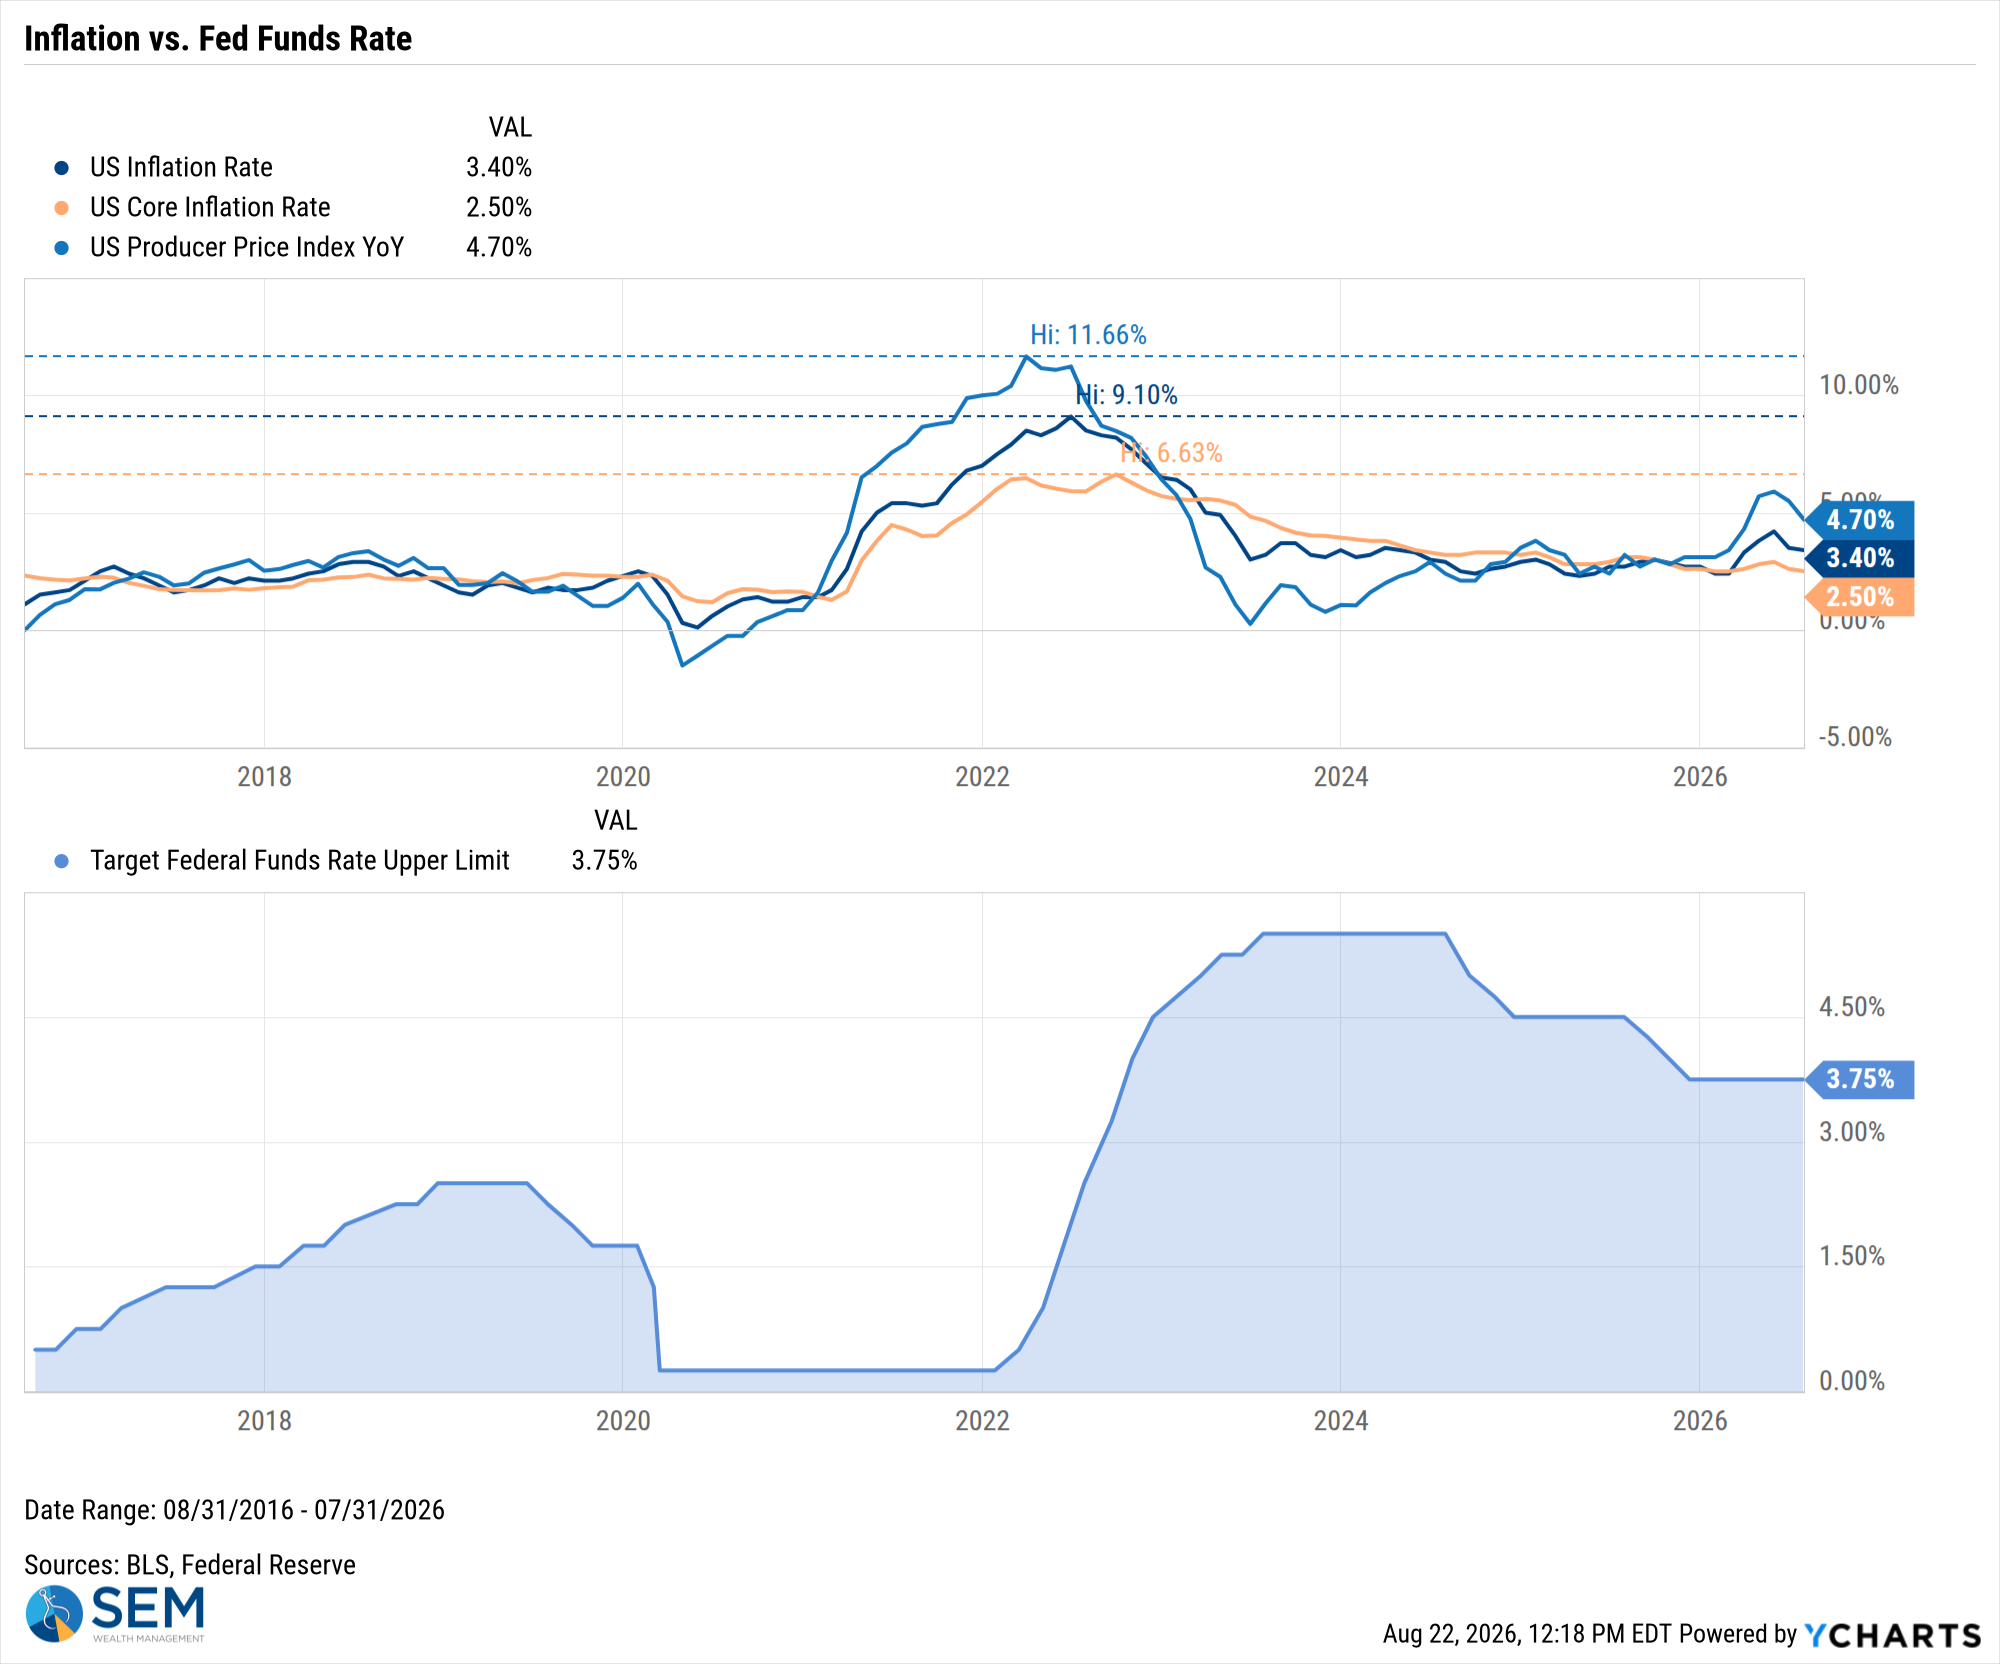
US Inflation Rate data by YCharts
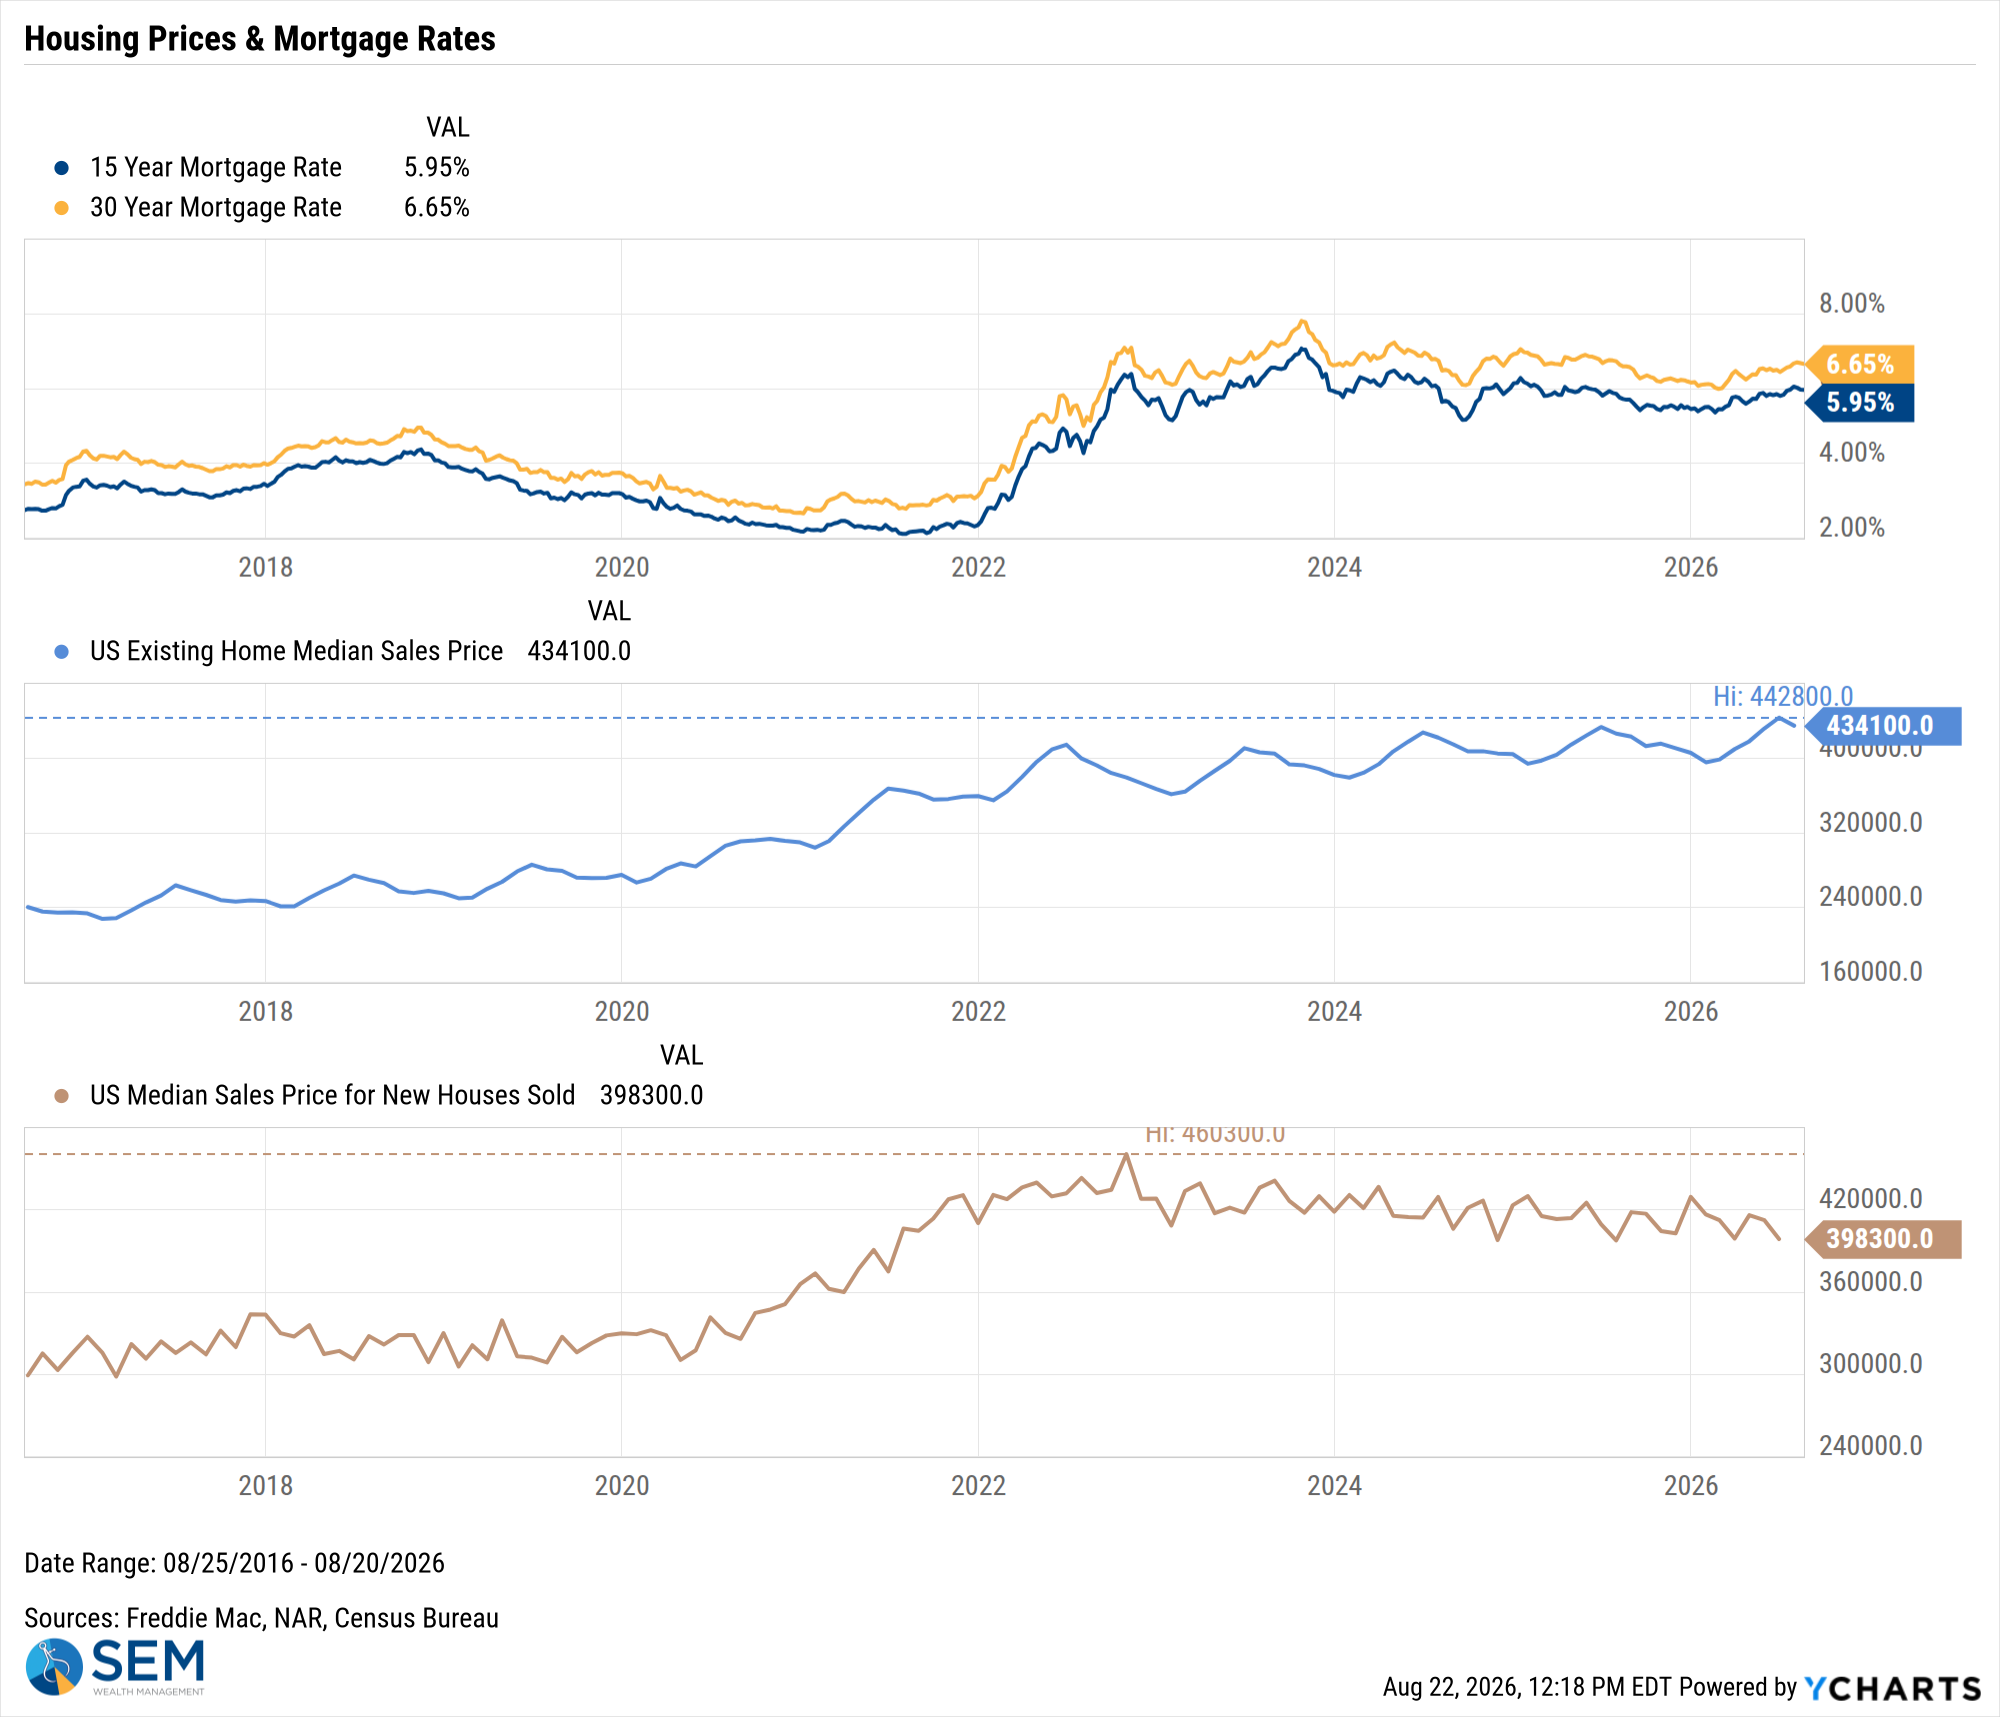
US Existing Home Median Sales Price data by YCharts
SEM Market Positioning
SEM deploys 3 distinct approaches – Tactical, Dynamic, and Strategic. These systems have been described as 'daily, monthly, quarterly' given how often they may make adjustments. Here is where they each stand.
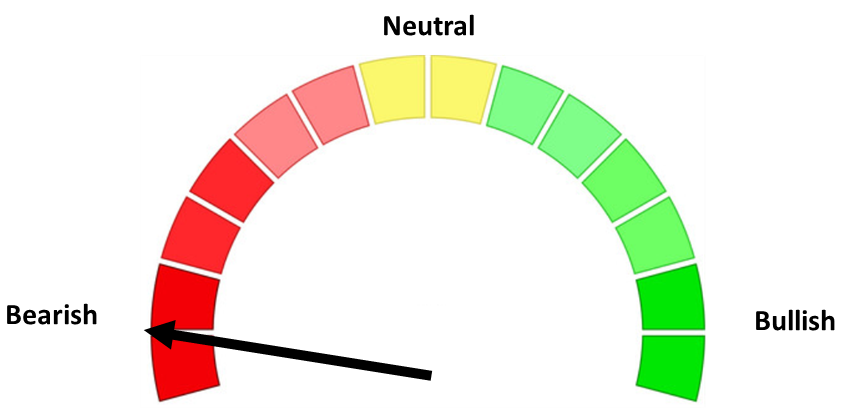
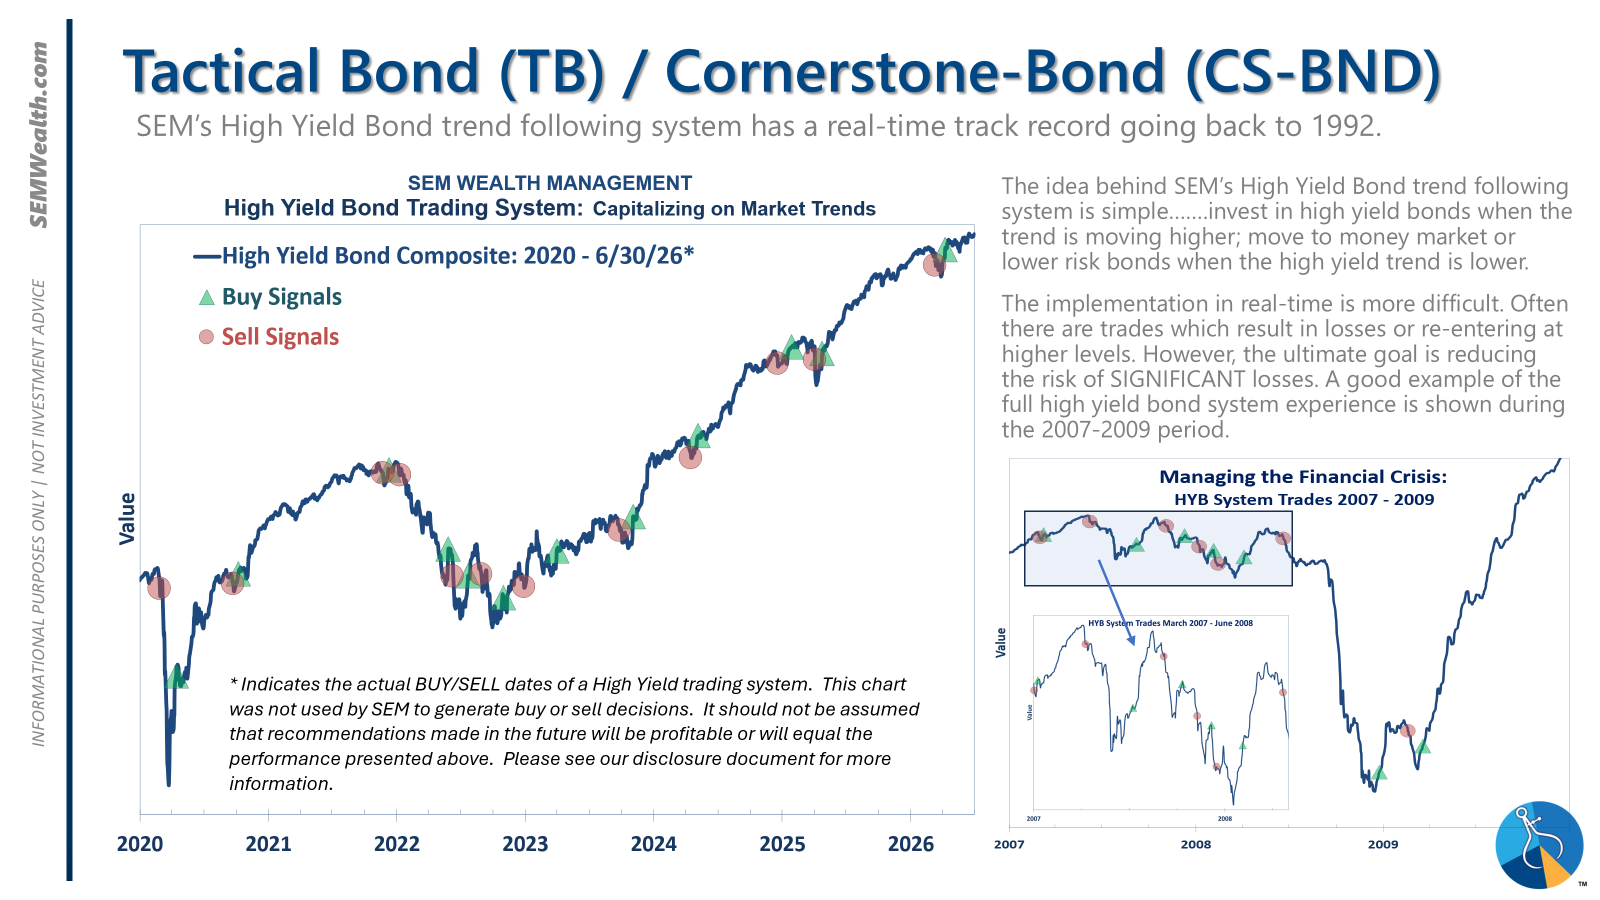
- Tactical = BULLISH | 100% High Yield Bond (4/8/2026) | High-yield spreads remain narrow but trend is slightly higher
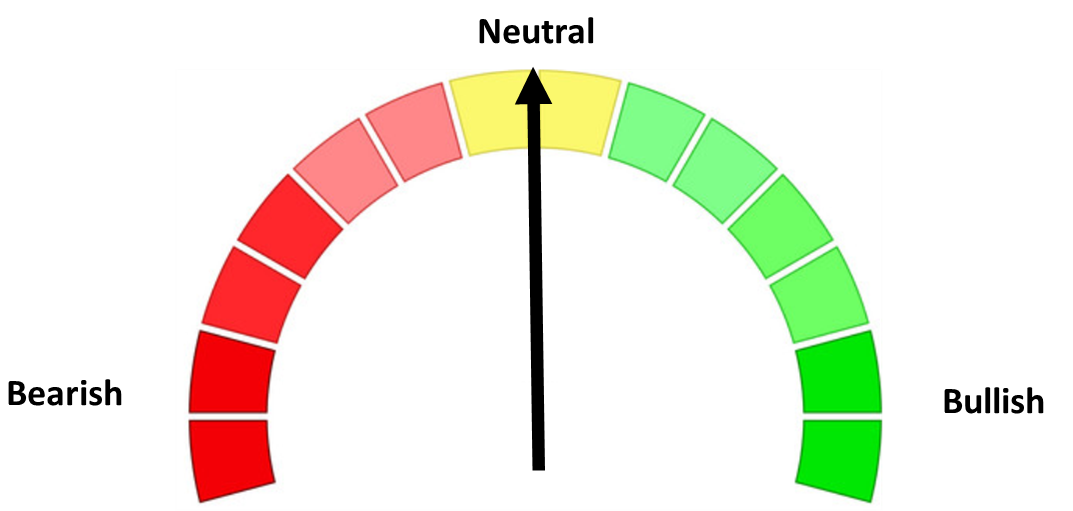
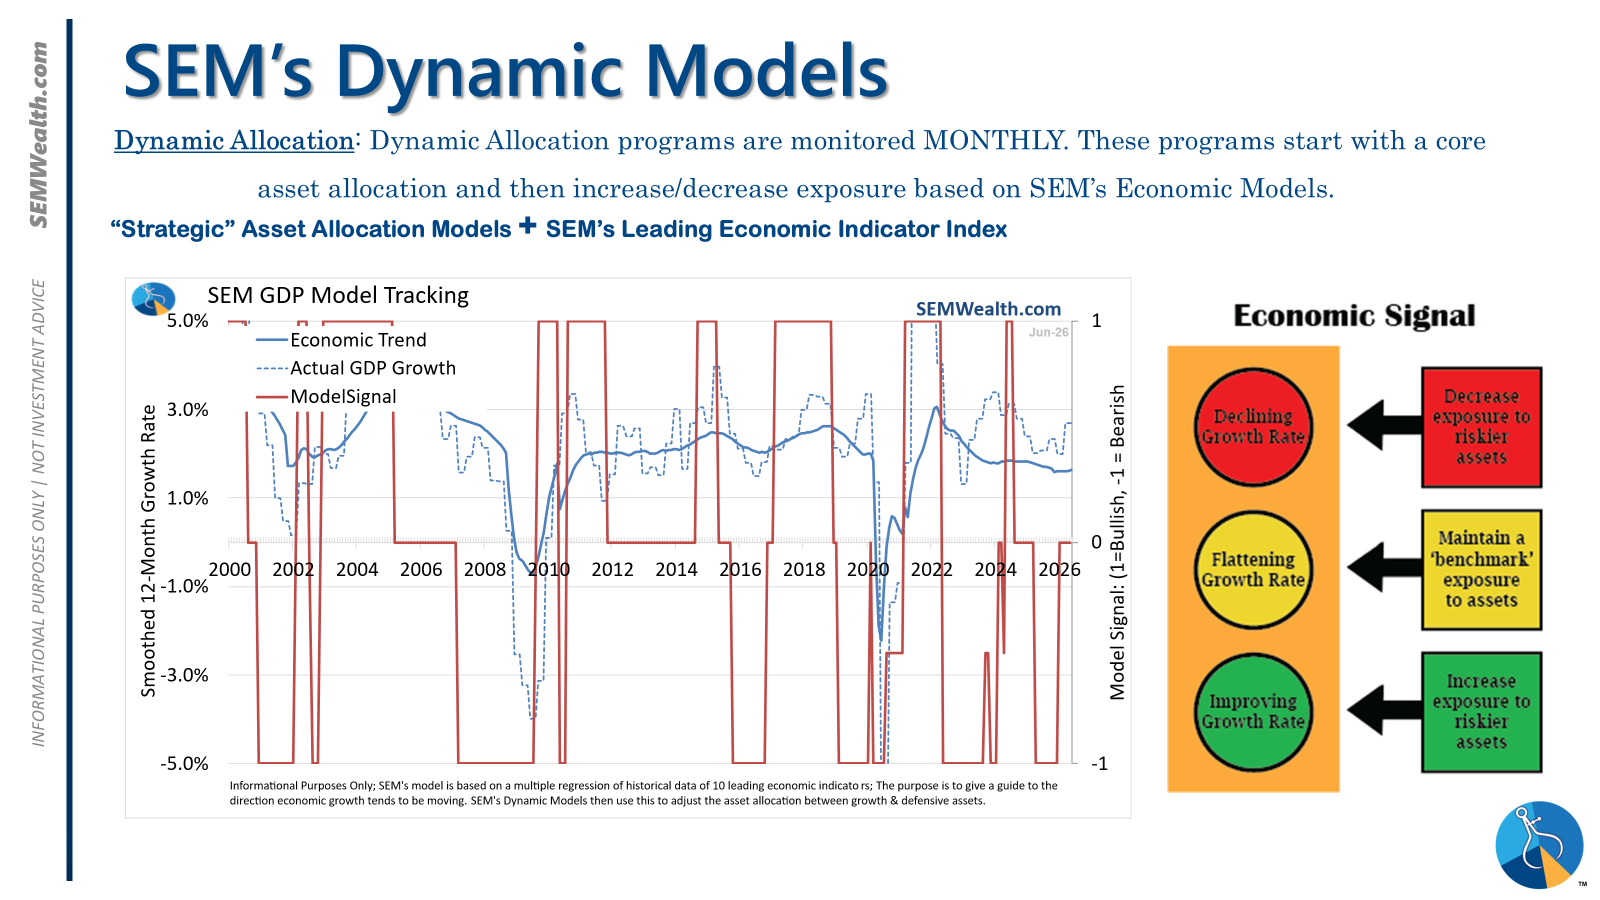
- Dynamic = NEUTRAL (2/15/2026) | "Benchmark" Allocation | Economic model inconclusive
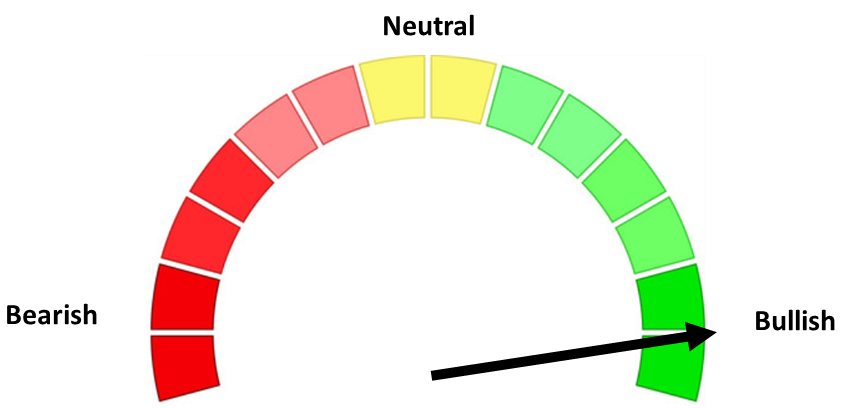
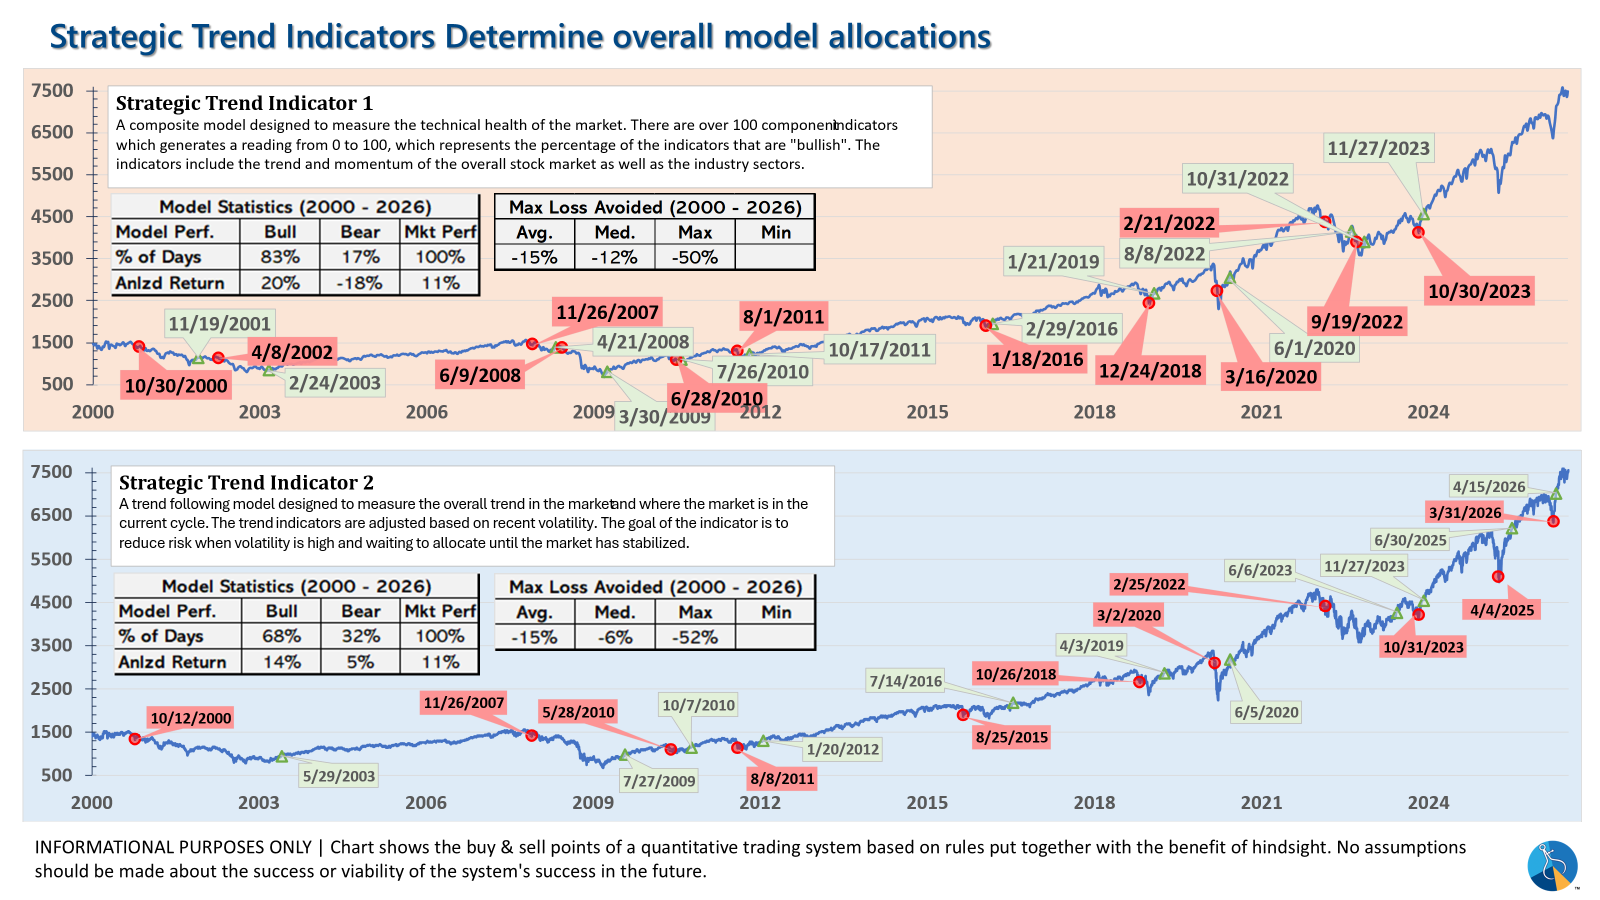
- Strategic = BULLISH (4/15/2026) | V-Bottom projecting "end" of Iran War
Tactical (daily):
- Monitored DAILY
- Models: Tactical Bond, Cornerstone Bond, Income Allocator, Tax Advantaged Bond
- Designed to follow the trends for use in our lower risk models
- BUY Signal issued April 8, 2026 (exiting the sell from March 13)
Dynamic (monthly):
- Monitored MONTHLY
- Models: All "Dynamic" Models (Income, Balanced, Growth, and Asset Allocator)
- Uses SEM's Quantitative Economic Model
- Designed to overweight riskier assets if economic trend is higher & underweight those assets if economic trend is lower.
- NEUTRAL signal issued February 15, 2026 (following BEARISH signal from July 2025)
Strategic (quarterly)*:
- Monitored QUARTERLY
- Models: AmeriGuard (Balanced, Moderate, & Growth) and Cornerstone (Balanced & Growth)
- Core Component: Quantitative Filter using 4 different time horizons across universe of asset classes
- Trend Indicator: Two different Quantitative Systems monitoring the intermediate-term trend, health of the market, and volatility
- CORE has been overweight small cap and international since October 2025 – overweight increased slightly in January
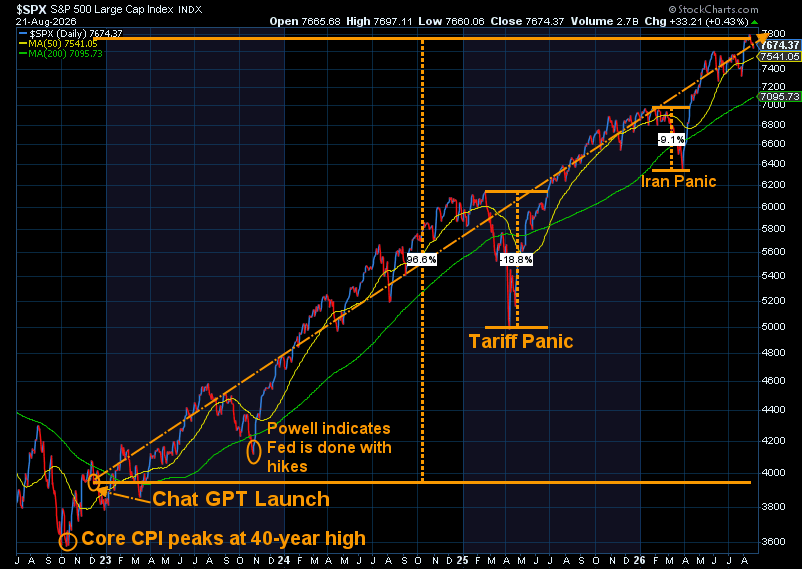
- Both TREND INDICATORS are BULLISH following 10% drop and "V-Bottom" reversal in early April
- AmeriGuard & Cornerstone Max DO NOT use the Trend indicator and are always 100% invested in stocks using our CORE rotation model.
The core rotation is adjusted quarterly. This quarter we saw half of our international positions reduced (we sold developed markets and kept our emerging markets exposure). We also saw the remaining share of mid-cap reduced in favor of more small cap exposure. We remain with a "barbell" core portfolio – about half in large cap and half in small cap as the models expect the market to "broaden".
The * in quarterly is for the trend models. These models are watched daily but they trade infrequently based on readings of where each believe we are in the cycle. The trend systems can be susceptible to "whipsaws" as we saw with the recent sell and buy signals at the end of October and November. The goal of the systems is to miss major downturns in the market. Risks are high when the market has been stampeding higher as it has for most of 2023. This means sometimes selling too soon. As we saw with the recent trade, the systems can quickly reverse if they are wrong.
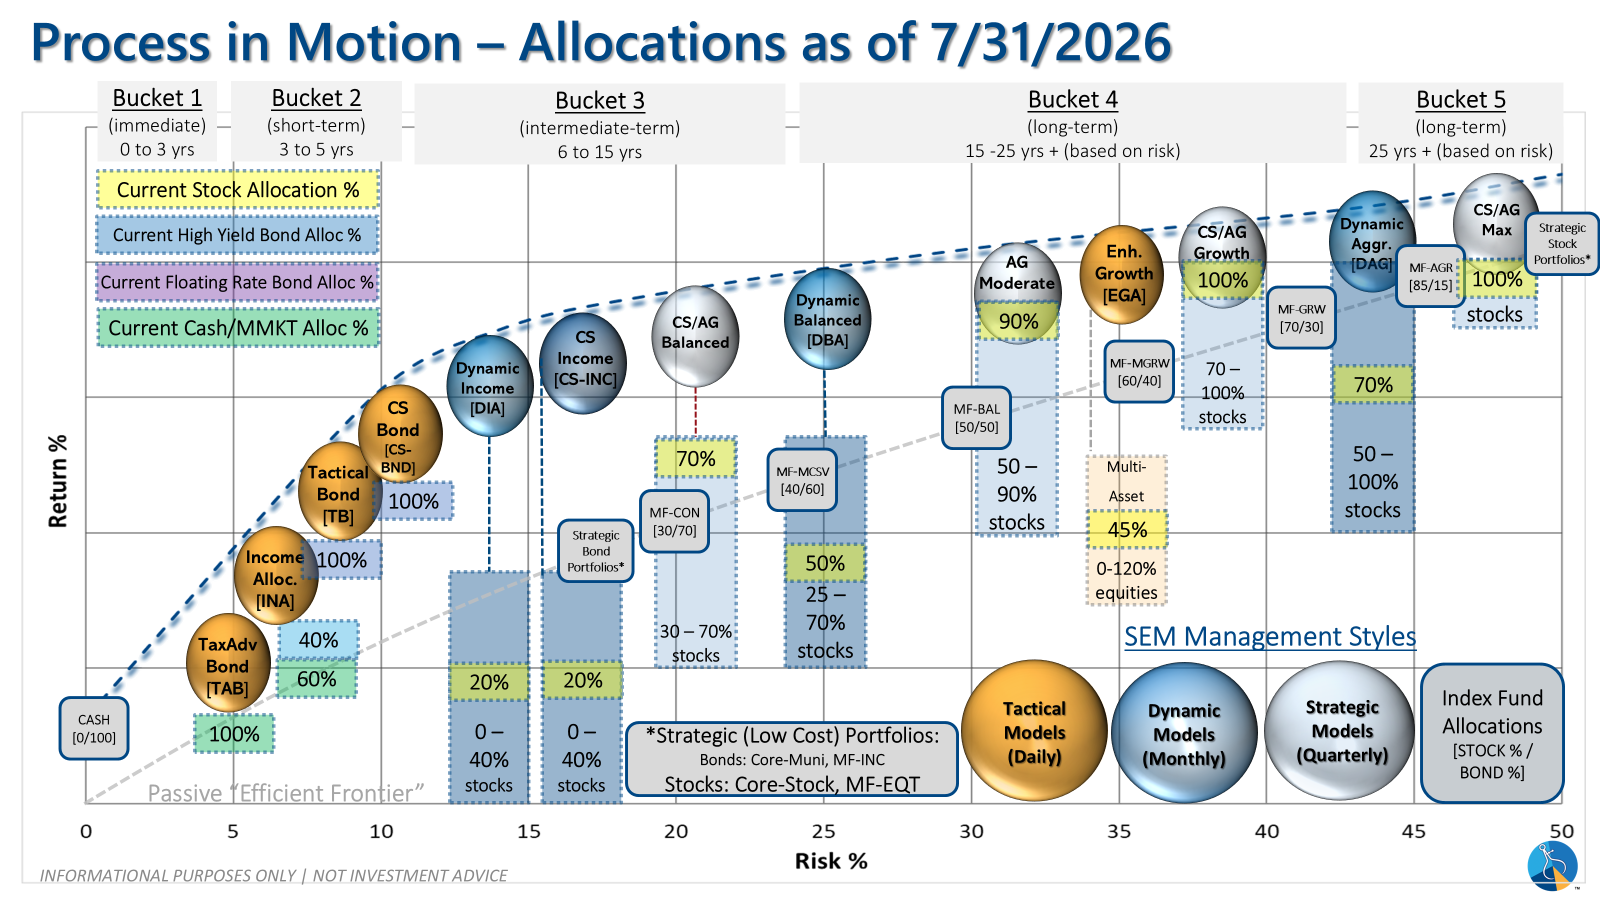
Overall, this is how our various models stack up based on the last allocation change:
Curious if your current investment allocation aligns with your overall objectives and risk tolerance?