
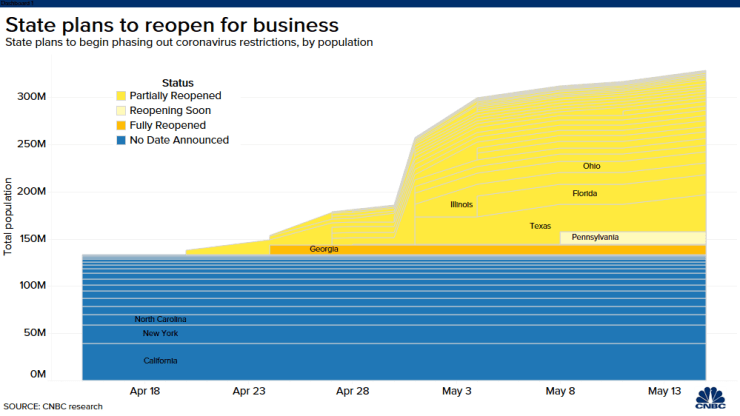
We are starting week 9 of the COVID19 Panic. Many more states opened up on Friday. Here in Virginia we have one more week (hopefully) before non-essential businesses with less than 10 people in their stores/shops at a time can re-open. As I said last week, we're going to have 50 different (uncontrolled) experiments in progress. This will lead to more heuristics (mental shortcuts) as everyone in America seems to now be an expert at the best way to handle the virus from a medical and economic standpoint.
-Social Mood Deteriorating Rapidly: You can see the anger building on both sides of the political spectrum. Both sides are blaming the other and we are seeing more and more conspiracy theories floating around. As you know I'm one to base things on well researched facts, but I'm also one who is skeptical and cynical based on my own study of history and my experiences the last 25 years. This is to be expected, but it doesn't make it any more tolerable to be living through it. At this point in the Social Cycle we're likely to see all kinds of major changes. The Coronavirus is probably the catalyst that sparks that fire. We shouldn't expect a return to "normal". There are so many imbalances and bloated institutions created the past 40 years that are now being examined closely. I'll try to have much more on this in the coming months.
[See "The Consequences of Political Polarization" for a brief discussion on this key topic.]
-Beware of Your Own Behavioral Biases: We're working on a much deeper look at behavioral biases surrounding this crisis, but for now, please read (or re-read) my Behavioral Approach to the Coronavirus.
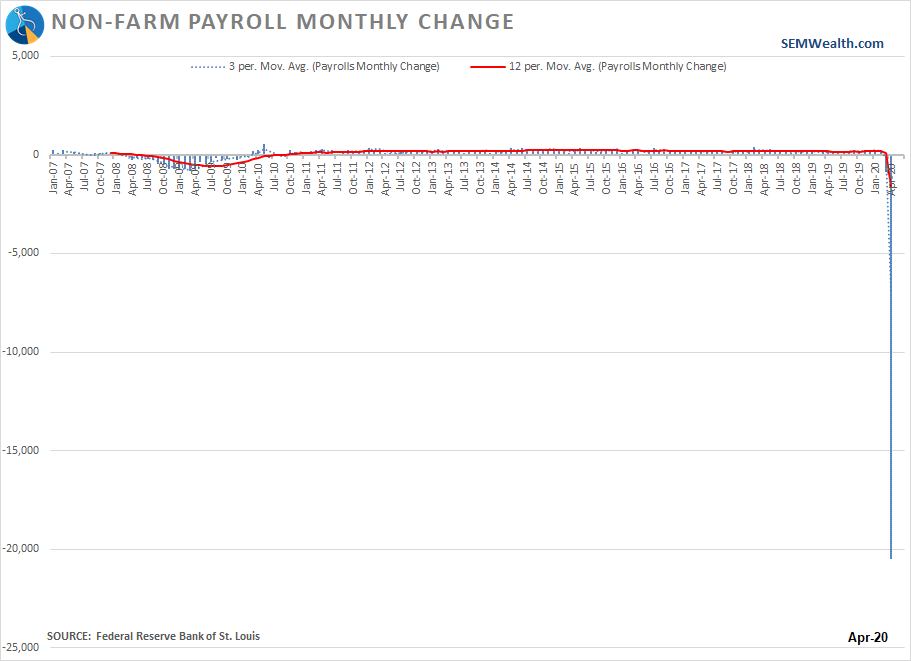
-Job Losses are Staggering: We saw a lot of charts showing the shocking number of job losses announced on Friday. I had to expand my favorite employment chart's y-axis, which pretty much rendered the prior years worthless. This chart makes the 2008 financial crisis seem like a small inconvenience.
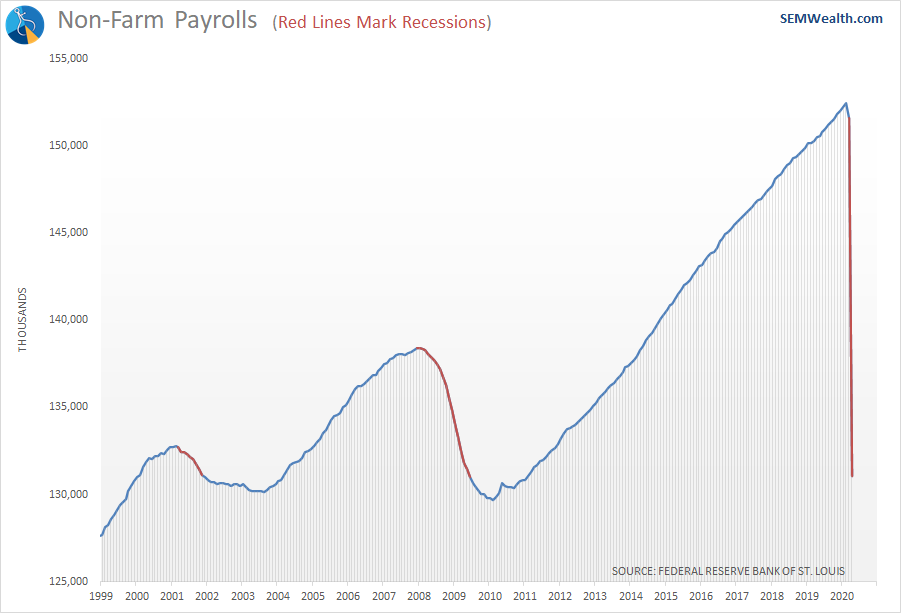
-Easy Come Easy Go: Anybody who heard me speak the last 10 years likely heard me say one thing – "This is the worst economic recovery in the history of our country." The problem was the jobs being added were all in the service sector and paid significantly less money than the ones lost during the financial crisis. Despite adding trillions of dollars in debt throughout the crisis and seeing the Federal Reserve barely pull in any of their $3.5 Trillion in stimulus, we barely saw "average" growth of 3% a couple of quarters. The problem with service jobs is they can be eliminated just as quickly as they can be added. We've essentially seen all the jobs added since 2011 wiped out.
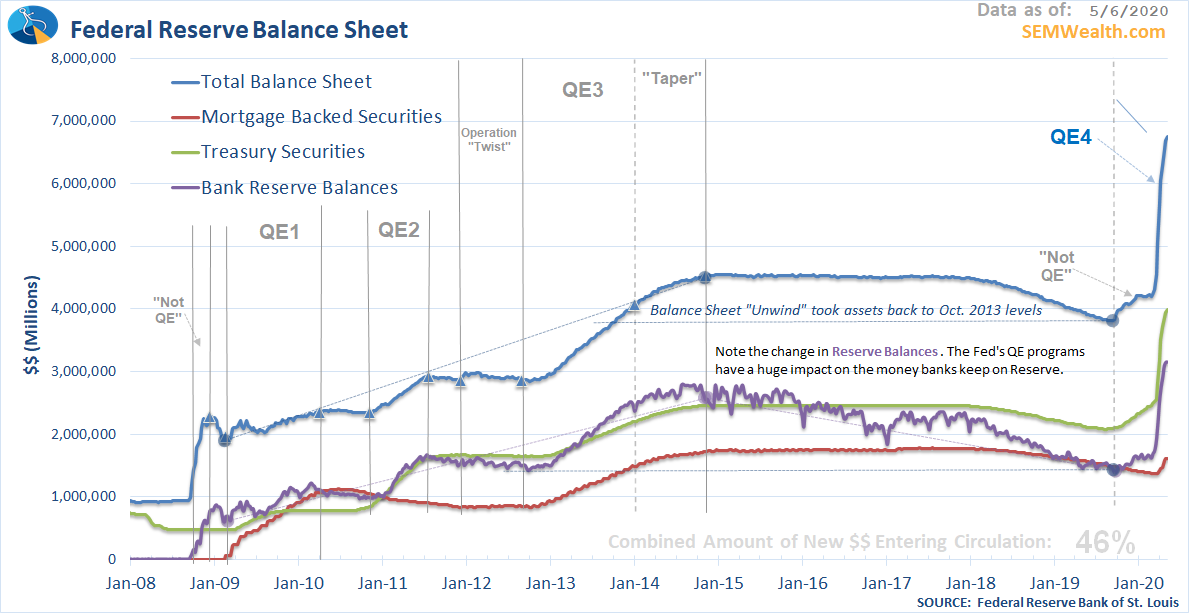
-Not sure how they'll ever get out of this: Remember in 2018 when the market panicked and lost nearly 20% in 2 months? The Fed was attempting to raise interest rates and gradually unwind their QE programs (which lasted from 2008-2015). They were only able to take away about 23% of the money they created before the market broke. With the amount of money they've created so far, how are they ever going to "normalize" the market?
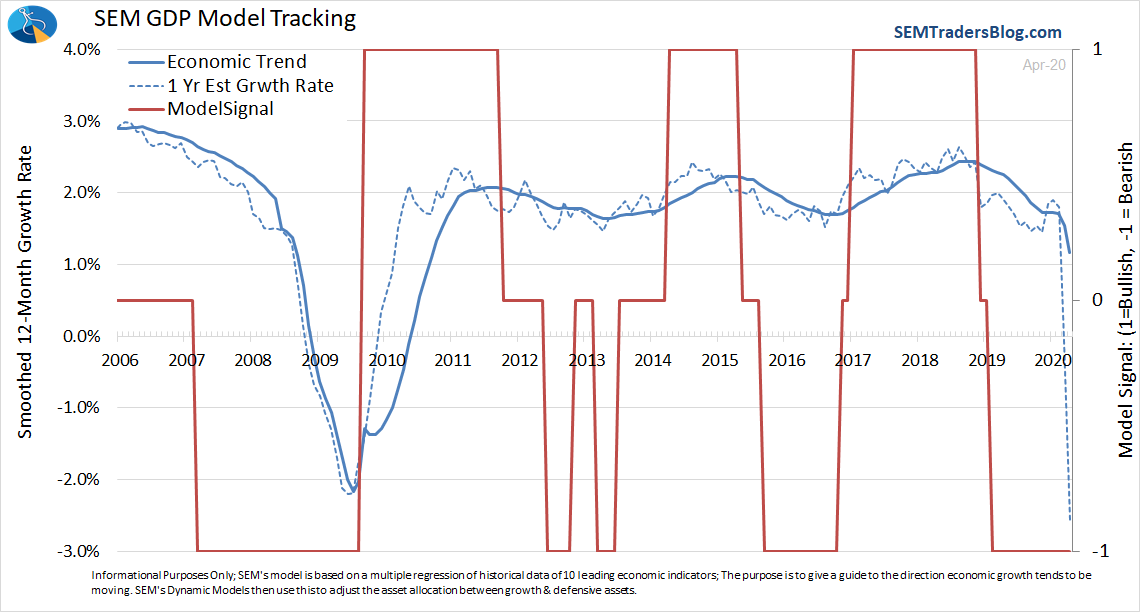
-Our data driven approach is the only answer: While we obviously didn't predict a complete economic shutdown, our economic model had already identified the weaknesses in our economy. The Coronavirus shutdown has exposed those cracks (such as relying too much on service businesses and relying too much on debt). Rather than guessing when the economy will recover, our economic model, just as it did in 2009 is designed to look at the current economic data to make that determination.
-Who's buying this rally? I've been asked who is behind the rally since April. It certainly isn't individual investors based on data from the Investment Company Institute. While we saw some positive flows the first two weeks of April in both stocks and bonds, individual investors again showed large net liquidations in both categories to end the month.
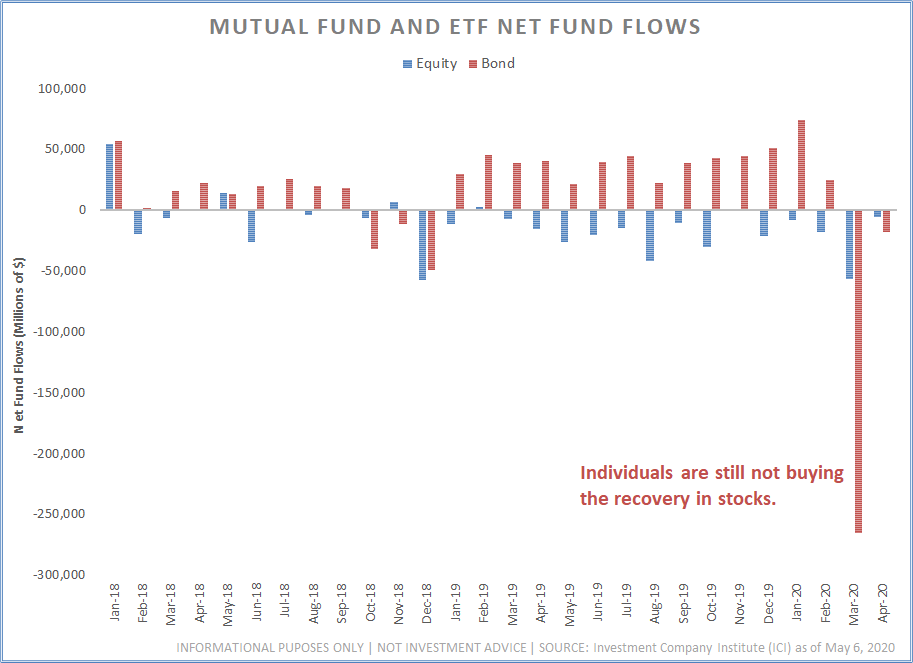
While volume has been light, it appears it's been institutional buying. Whether pension funds, hedge funds, or Wall Street trading desks flush with cash from the Fed's QE purchases, the stock rally doesn't add up with what main street is seeing. Remember, the large institutions are not looking at fundamentals, but instead the opportunity to sell at higher prices. Time will tell if the economic recovery supports the stock rally or if those buying right now will start selling as soon as stock prices meet reality.
-Don't be distracted by rising stock prices: Economic growth matters.......eventually. The most commonly asked question I'm getting lately is why can stocks rally so much in the face of economic data. The answer is simple – investors are looking at the future and fully believe this is temporary. Therefore, future growth will justify buying stocks now. The problem with that theory is nobody truly knows what the long-term impact will be on economic growth. Using a simple formula of GDP Growth + Dividends+ Inflation = Stock Market Growth leads to some even bigger unknowns. We know the Fed is fighting deflation. We know potential growth was already hurt by the retirement of the Boomer generation and the lack of growth in high paying jobs. We know dividends have already been cut during the crisis. Stocks aren't a bargain at today's prices and won't be a bargain until we see them down at least 25%. If you bought stocks at the lows in March, it wouldn't be a bad time to cash out and wait for a better entry point.
Economic growth matters.......eventually. Don't be distracted by the pretty moves in stocks.

-Why I hate earnings data (and thus the P/E ratio): I was originally an accountant. Early in my investment career I was naive enough to believe the stock market cared about quality earnings and stable balance sheets. I quickly learned how public companies were able to manipulate their financial statements with the blessings of Wall Street and regulators. The constant focus on looking good every quarter had rendered public corporation earnings data worthless for somebody that cares about the fundamentals. This chart shared in Steve Blumenthal's "On My Radar" on Saturday (one of my 'must reads' every weekend) compares S&P 500 reported earnings (to Wall Street) to the national accounts profits (what was reported to the government). Note how each time earnings exceeded actual profits we saw a very sharp correction in earnings in the following years.
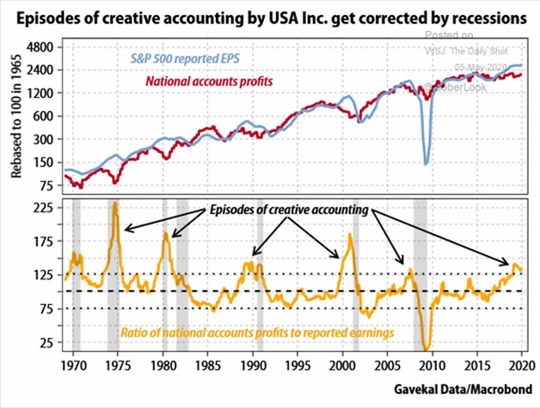
You can only create the illusion of strength before it catches up to you.
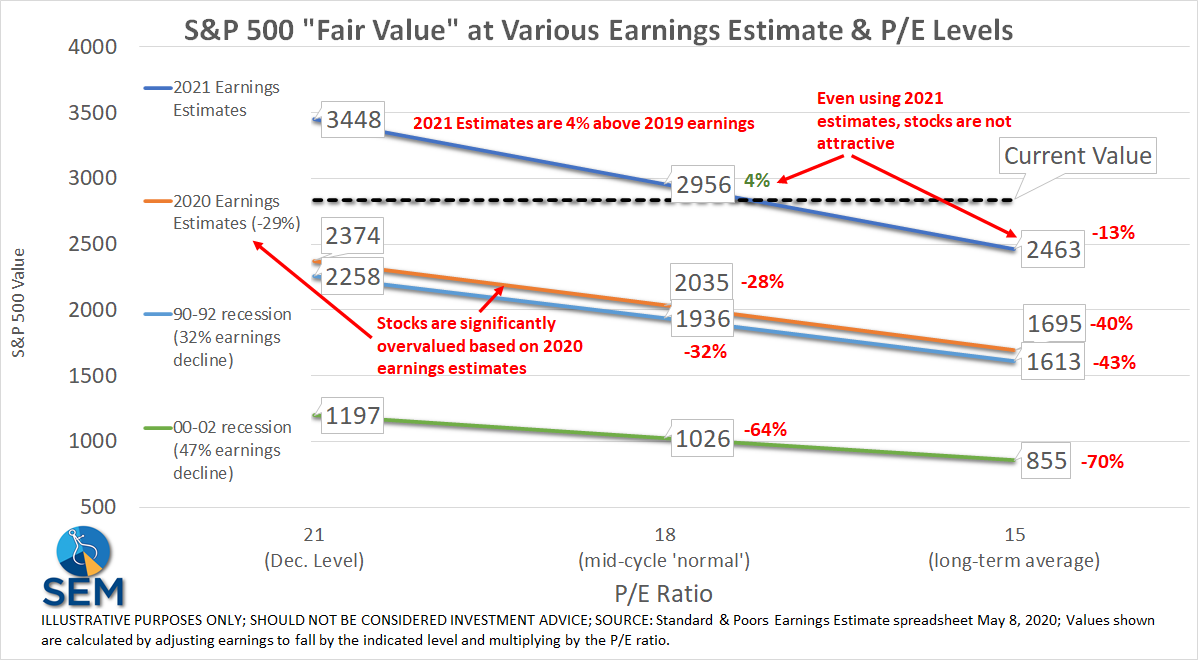
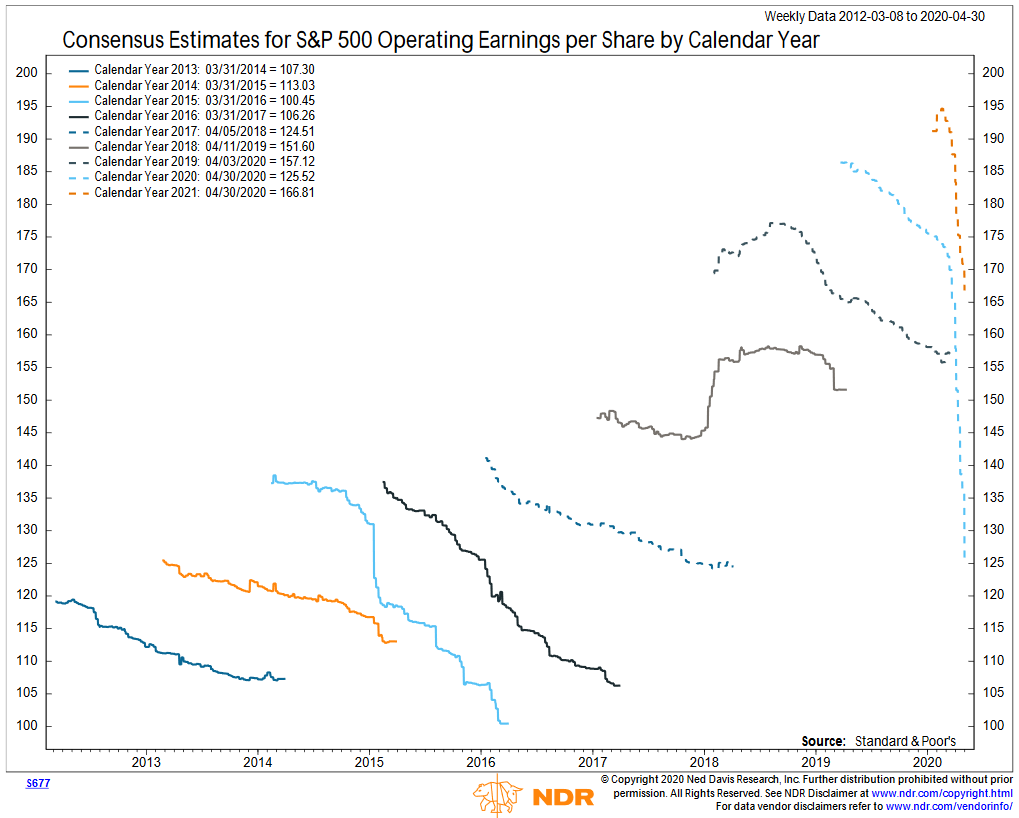
-Stocks are Significantly Overvalued: Even in a good economy analysts are terrible at estimating S&P 500 earnings. They almost always have to revised their estimates down as we get closer to the actual release of earnings. They have an upward bias built into their estimates. We are now being told to ignore 2020 earnings and even 2021 earnings. Instead we are supposed to imagine a world in 2022 to justify the current valuations of stocks.
Here is my attempt to explain how you can determine whether you think stocks are over or undervalued. The %'s on the chart are the losses/gains from today's price. Select your scenario for earnings and then select the P/E you believe is fair. Keep in mind going into the year the S&P 500 had a P/E of 21. The long-term average is 15. To be fair, I've been using a P/E of 18, which is what you typically see during a temporary economic slowdown (which is what pretty much every Wall Street expert is saying we are in.)
-Understanding the "Forward" P/E ratio: The most commonly used P/E ratio is the "trailing" P/E. It is today's price divided by earnings from the last year. Of course the market is looking at the future. Since the earnings are more uncertain in the future and there is a time value discount, the "forward" P/E should be lower than the "trailing" P/E. For the last 10 and 15 years the Forward P/E has averaged 15 (source).
Now let's assume the best for the market. Whether in 2021 or 2022, let's say we get back to where everyone thought we were heading in 2020. Analysts expected a 15% jump in earnings in 2020 to $185 for the S&P.
If you multiple this perfect recovery back to $185 x 15 (the average Forward P/E the last 10 and 15 years) you get 2775. So in this perfect scenario stocks are still 5% overvalued.
By the way, this is my favorite chart illustrating the pathetic track record of analysts earnings estimates. It plots the consensus estimates from analysts over time. Note the downtrend. The only time they actually had to raise estimates was after the tax cuts passed in late 2017, which led to them needing to increase their 2018 estimates.
-Valuations are Terrible Timing Mechanisms - P/E is the Worst Valuation Metric: It is important to understand stocks can be over and undervalued for long periods of time. The best use of valuation metrics is to properly set expectations. When you buy at high valuations, your long-term returns are likely going to be low. Of all the valuation metrics I've studied, P/E is the worst, yet it is the one most often used by Wall Street to declare stocks being a good value. If you are buying (or holding) stocks TODAY, I'd encourage you to check out this post.

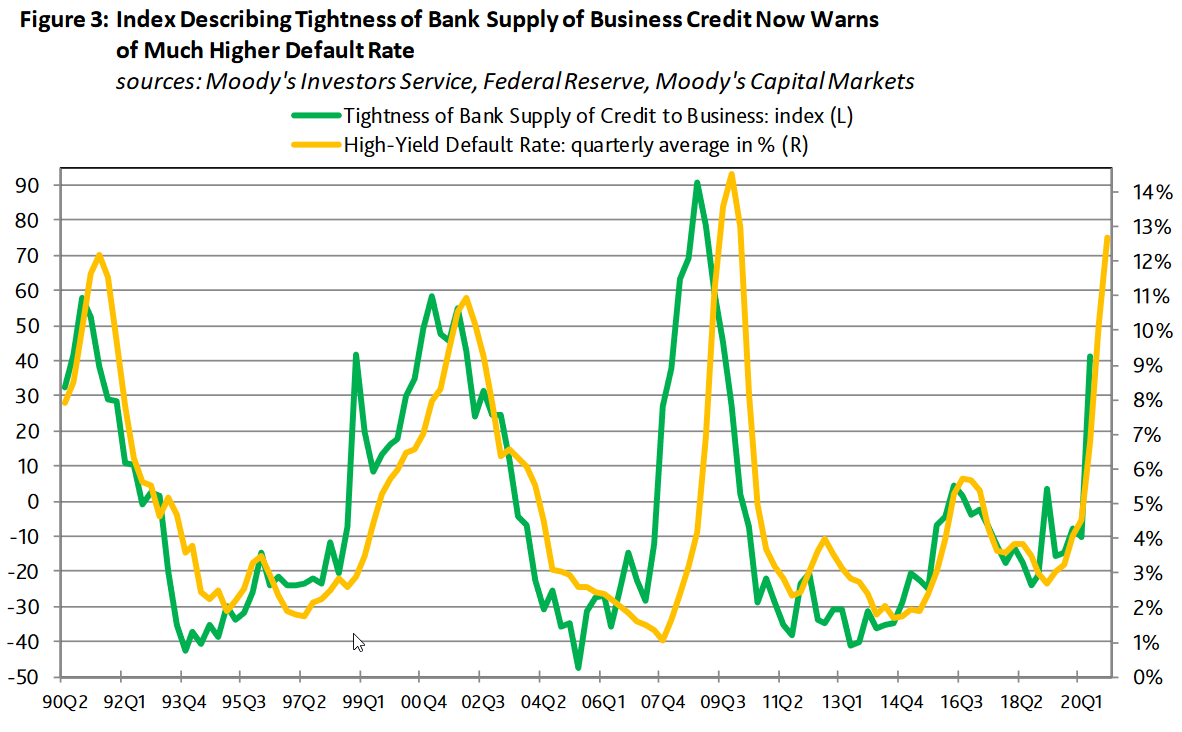
-Defaults are coming: I've mentioned many times the past month the best opportunities so far are showing up in the bond market. Of course this is not the advice you are getting from Wall Street, who is once again looking at Treasury Bond yields and recommending most people avoid bonds due to the low interest rates on those bonds. Corporate Bonds, and in particular those rated "below investment grade" (aka high yield bonds aka junk bonds) are a completely different asset class than Treasury Bonds. These bonds are hammered during a recession, which leads to many opportunities. We're already seeing defaults begin to pick-up. Moody's is expecting them to escalate quickly. The Fed cannot legally buy bonds of insolvent companies. Patience will be key as we wait for these defaults to run their course.
[For more, see "(Delayed) Opportunities Emerging"]
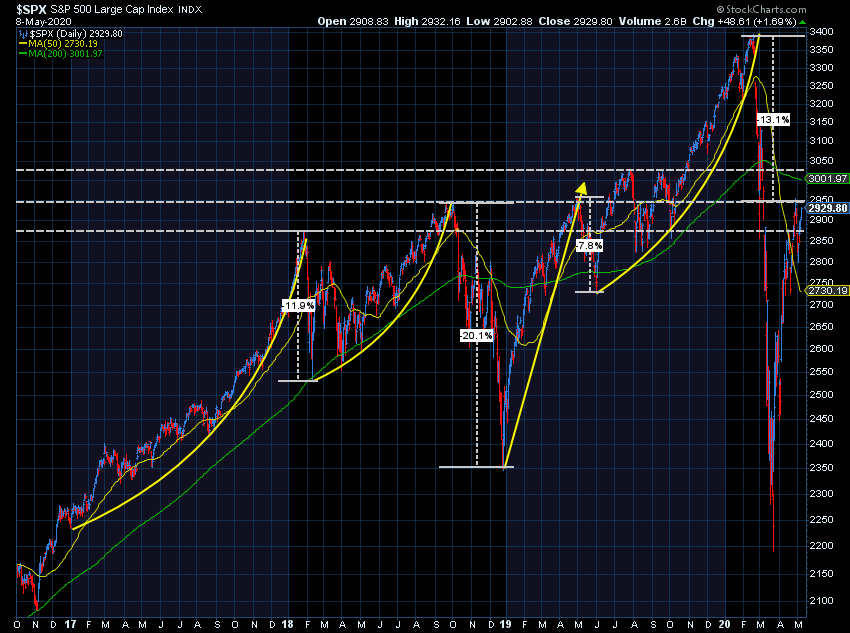
-Remember the Trade War? A year-ago, I wrote a post titled "#Trumped" After an amazing start to the year, the President issued a warning on Twitter about a 25% increase in tariffs on Chinese goods. This sparked a 5% drop in the market (eventually falling a total of 8% before he backed off those threats.....temporarily). What is interesting is the value of the S&P when I wrote it – 2800. The S&P is currently above 2900. This is one thing I've pointed out to all those who believe this panic is a buying opportunity. 2019's returns had no fundamental backing. GDP growth started the year at 3% and ended it at 2%. S&P 500 earnings growth was only up 3%. Yet somehow the stock market rallied 32%. At today's prices we haven't given back the gains that shouldn't have happened from a fundamental perspective. Believing stocks go back to where they were at before the crisis means believing fundamentals don't matter.
On the chart a year ago I added some parabolic lines to highlight the froth in the stock market. Note the additional parabolic move off the lows following the #Trumped article from a year ago. Those types of moves are clear indications of a frothy market. Going into the week, stocks are only 13% off the highs.
-Savings for us, means lost revenue for others: May was going to be a busy month for me. I had conference trips scheduled for three consecutive weeks. With hotel, travel expenses, and conference fees we were going to spend at least $12,000 this month. Instead, I've been able to meet with several large advisor groups virtually instead of at their conference. I'm most excited about the next two weeks when I have the virtual Mauldin Strategic Investment Conference and the CFA Institute's Annual Conference. They are spaced out to not take up the entire day. I'll be able to skip sessions not relevant to me. I'll be able to continue to get my normal daily actitivies done. Most importantly, I'll be able to sleep in my own bed. Total cost for these conferences? Less than $400.
I'm sure we'll go back to a time where we have to spend thousands of dollars for conferences. You can't replace the value of networking between sessions and in the mornings and evenings. But how long until we do that? Think of all the lost revenue surrounding these conferences. No amount of stimulus from the Fed or Congress can replace that business.
-The Paradox of Saving: In the same sense, coming out of this I think we'll see a lot of people realize how important it is to have a large emergency fund. If we can lose our source of income overnight and not be able to work for several months, we need to have large reserves. At least 25% of our country is in that situation right now. At the end of last year, we noted how over half of the country could not come up with $400 in case of an emergency. My point then was how unhealthy and unstable our economy is. We need our citizens to have larger emergency reserves, but our economy needs them to go back to their same spending levels. I hear Dr. Ben Bernanke say once, "we can't have everybody saving money at once." Short-term we need spending, but long-term we need more saving.
-A Different Mother's Day: This was the first time in their 13 years our twins did not have their sisters here to help them with Mother's Day. It also meant I didn't have the girls' help making the day special. The boys decided they wanted to build their mom a small garden. Coming from Arizona we've never had a garden. It's something Toby and Brandi have wanted to do since we moved. Here was our "city boys" acting like farmers. It was a long Saturday for us, but well worth it. They even woke up on Sunday and made their mom breakfast.


A special thanks to all the mom's out there. They certainly deserve more than one day. Mom's make the world go round.
I have a lot more on my list, but my virtual conference starts in a couple of hours. I'm sure that will bring plenty more to discuss over the coming weeks.
Have a fantastic week!


