
We keep hearing about the buying opportunities that have developed due to the COVID-19 pandemic. For the first time in at least 10 years, I'm finally excited about the buying opportunities that have developed. No, I haven't gone crazy after two weeks in our home/office. This is exciting!
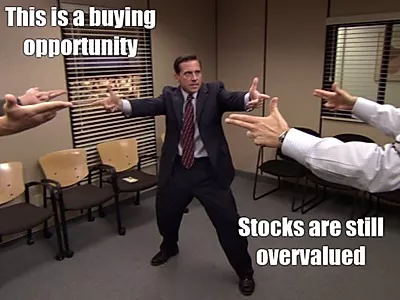
Since the sell-off started at the end of February, we've seen Wall Street trot out all kinds of research and appearances on CNBC and Bloomberg to get the message across about how great an opportunity we are seeing right now in the market. I can't believe I'm saying this, but they're right............sort of.
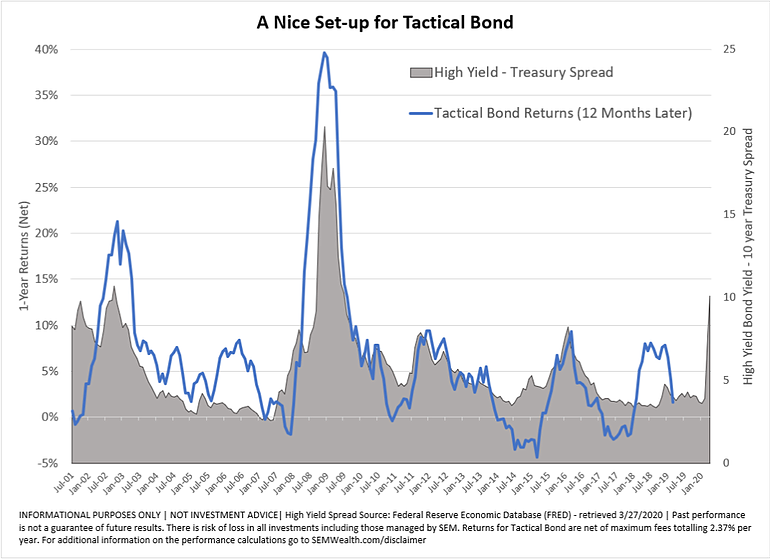
Unfortunately, I'm not talking about the stock market. Stocks are still way too expensive to put out this type of an alert (more on that later). High yield bonds, however are at the best valuations we've seen since 2009.
We included this chart in our client newsletter, which posted earlier today. It looks at the difference between high yield bond (junk) yields and 10-year Treasury bonds. This is called the "spread". This is the best measure of valuations for high yield bonds, as you can see how much yield you are being paid to take on the risk that the bond you are buying will default. When the spread is low, you are taking on a lot of default risk for very little yield. Spreads are low when there is little perceived economic risk. This makes it difficult for our models, which use high yield bonds, to make much money.
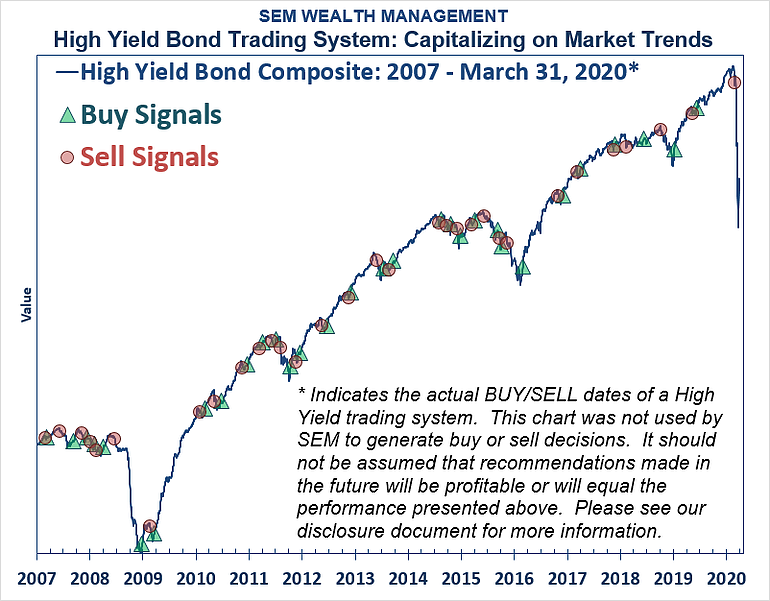
This chart shows the returns of our Tactical Bond model, which utilizes our high yield bond trend following system exclusively. Our Cornerstone Bond model also uses the same system, but with Biblically Responsible Bond funds. Income Allocator and Dynamic Income Allocation both have a similar correlation to high yield bond spreads, but because they use other income asset classes, they are not as dependent on just these spreads.
Now let's look at where we are at -- across the board our bond and income models are sitting in low risk income investments -- cash, money market funds, and short-term government bonds. With the impact of the economic shutdown across the world unknown, there is a real risk of mass defaults in high yield bonds -- remember the companies issuing high yield bonds are the most at-risk in a good economy. (There is also a very high chance of defaults in the Investment Grade bond market, which I wrote about last year.)
Rather than GUESSING that the economic impact will not be as bad as everyone thinks, the models are designed to sit-back and wait for the decline to stabilize and then to finally reverse higher. With interest rates for "safe" investments now down to 0%, thanks to the Fed's emergency actions, we aren't making much while we wait, which is fine with us. There is no sense rushing in. History tells us safer entry points are ahead.
While spreads are at the same levels where our Tactical Bond and other income models have made very nice gains, notice in the chart how a move up in spreads is not a fast event. It goes up over time and then declines over time. In other words, we could see high yield spreads get even higher (and prices moving significantly lower.) The chart below illustrates all of the times we've bought and sold high yield bonds with the Tactical Bond model since 2007. Note, there are many times the trade ended up not being profitable. That is the nature of trading. The key is how quickly the model moves back to lower risk assets if it is wrong.
We are at a point where valuations in high yields are so attractive I'm encouraging everybody who has had money sitting on the sidelines waiting to invest to get their money into SEM's income models ASAP. We don't know when the opportunity will come, but based on my experience with these models the last 21 years, by the time the opportunity is clear, it will be too late for most people to act.
I'm not encouraging anybody to use money they may need the next 3 years, as there is still some downside risk here, but for the money that was either way over-allocated to stocks, that was recently raised due to sells over the past month, or for accounts who need to adjust the level of risk inside their portfolio without giving up potentially strong returns over the next several years, now is the time to act. This puts you in the enviable position of having money in low risk investments currently and then using a time-tested strategy to re-deploy those assets when the environment is a little more certain. No guessing, no hoping, no emotions.
Again, I don't know how long it will be before we can take advantage of these prices. It can get worse. Despite the needed stimulus and bailouts by the Fed, there are NO QUICK FIXES. The reason for the market drop and recession may be "unprecedented", but so were every other market shock we've seen since SEM was founded in 1992.
A Solution for Fixed Income and Conservative Investors
For the past 10 years we've heard from the experts that the bull market in bonds is over. The recommendation from Wall Street was to sell bonds and use dividend paying stocks to generate income. Once again, we are witnessing what happens to dividend paying stocks (and high yield bonds) during a recession. As I've argued during that entire time, buying and holding fixed income assets is something I never recommend. There is too much risk for too little return.
Instead, actively managing fixed income allows us to take advantage of opportunities in the fixed income market when they are available and then to lock in the gains when those income investments inevitable enter a downturn. It's not perfect, but for investors relying on their investments for income or those who simple cannot afford and/or stomach the volatility of the stock market, it is a solid solution that has a proven long-term track record.
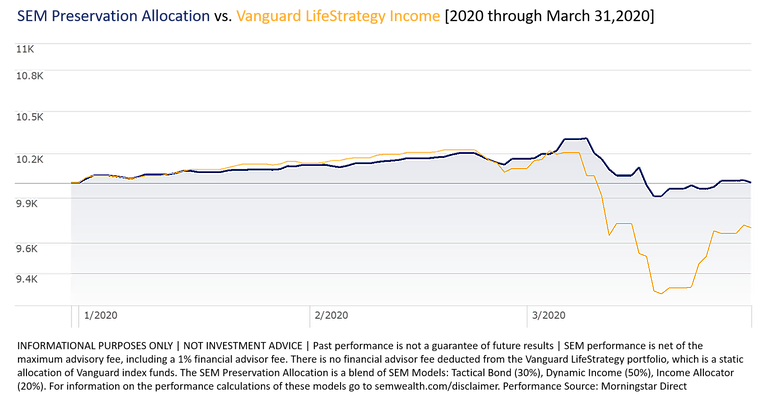
With interest rates on money markets again at 0% and Treasury Bonds below 1%, SEM may be the solution many clients are looking for. We can create all kinds of combinations for our clients based on the financial plan, cash flow strategy, risk tolerance, and investment personality. One of the most popular blends is what we call our Preservation Allocation (formerly known as "EDDG."). It is a blend of Tactical Bond, Income Allocator, and Dynamic Income Allocation. The downside risk for this blend has been less than 10% (past performance is not a guarantee of future results.....click here for the full disclaimer.)
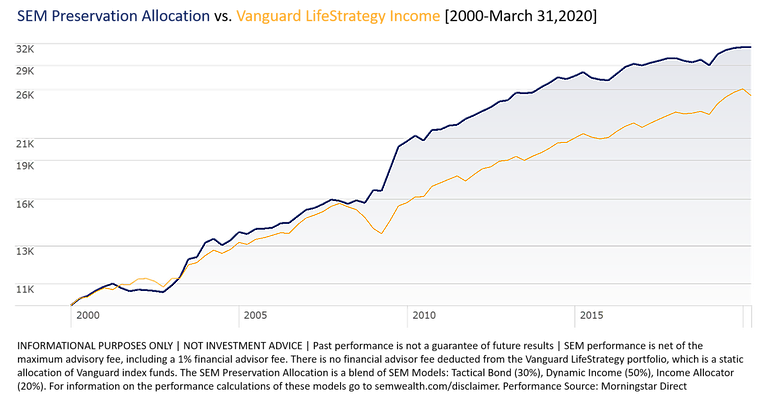
Vanguard, like many other large firms, offers some allocation strategies that attempt to provide "managed" portfolios for various groups of investors. Their "management" is usually comprised of re-balancing back to the original asset allocation, with occasional subjective tweaks of 5 or 10% based on the guess-work of their investment committees about the market environment. Here is a comparison of the Vanguard LifeStrategy Income portfolio versus our Preservation Portfolio so far in 2020. Returns were essentially identical as SEM was fully invested through the end of February. The key is how quickly our models moved to defensive investments.
What's more important are the long-term results.
The intangible of course is nobody knows what the future will bring. Will there be widespread defaults in the bond market, how long will it take for the stimulus to work, how bad will the economy get, what is the long-term growth rate going to be after this, what are the costs and unintended consequences of the unprecedented stimulus measures, etc, etc, etc? With SEM's portfolios, it doesn't matter. As we've done throughout our 28+ year history, we will adapt to whatever the market gives us.
For clients in the "income" or "conservative" category, I don't know of many other options that are as flexible as these models.
What about Stocks?
Despite the sell-off in the stock market, stocks are still dramatically overvalued. Last week in "Still Overvalued" I included charts from Ned Davis Research (NDR) that illustrated how little the overvalued readings have improved despite the drop in prices. NDR used longer-term trends in earnings and the various valuation metrics. I also highlighted how all the bear market has done thus far is erase some of 2019's gains, which I've argued should never have happened given the slowdown in the economy, revenue, and earnings in 2019.
I'm a big believer in stocks and our economy over the long-term. However, the market moves in cycles where stocks become so overvalued that the prospect of strong long-term returns over the next 10-years make stocks not very attractive. This is why at SEM we deploy our three pronged management styles of tactical, dynamic, and strategic investment models.
Most people I've seen on TV and in the hundreds of emails (and social media posts) over the past four weeks have used the P/E ratio as their sole-metric when they declare this sell-off a buying opportunity. Looking at the P/E ratio, which uses today's prices and December's earnings, stocks are moderately attractive.
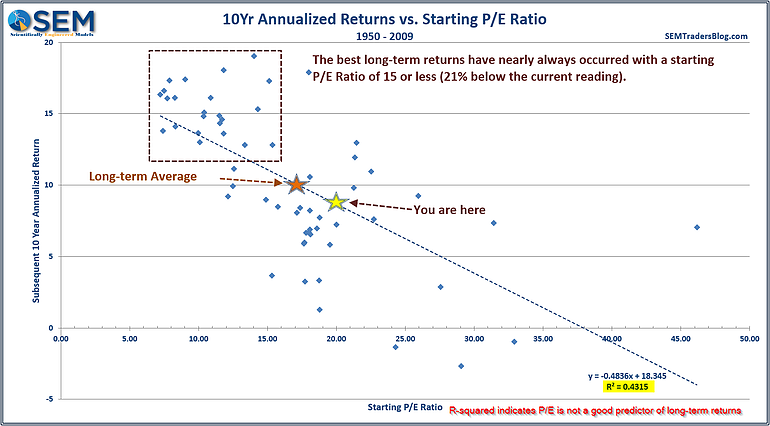
Keep in mind, this is using pre-COVID19 prices. I think you've been in quarantine too long if you believe the E in the P/E ratio isn't moving significantly lower over the next year. Regardless of what happens to the E, note the R-squared for this model -- current P/E ratios are not very good predictors of long-term returns. [R-squared is a measure of fit for the model. The higher the R-squared, the better the fit.]
Looking closer at the P/E ratio and how it relates to stock values. Analysts at the beginning of the year expected 10% growth in earnings. Stocks were trading at a P/E of 21 at the time. As of last Friday, the new expectation is for only a drop in earnings of 4%. They see a big drop in the 1st and 2nd quarter followed by a V-Bottom in earnings, taking them all the way back to last year's levels. Those who are arguing this is a buying opportunity MUST believe in the V-bottom. If there is any sort of slowdown stocks are still SIGNIFICANTLY OVERVALUED.
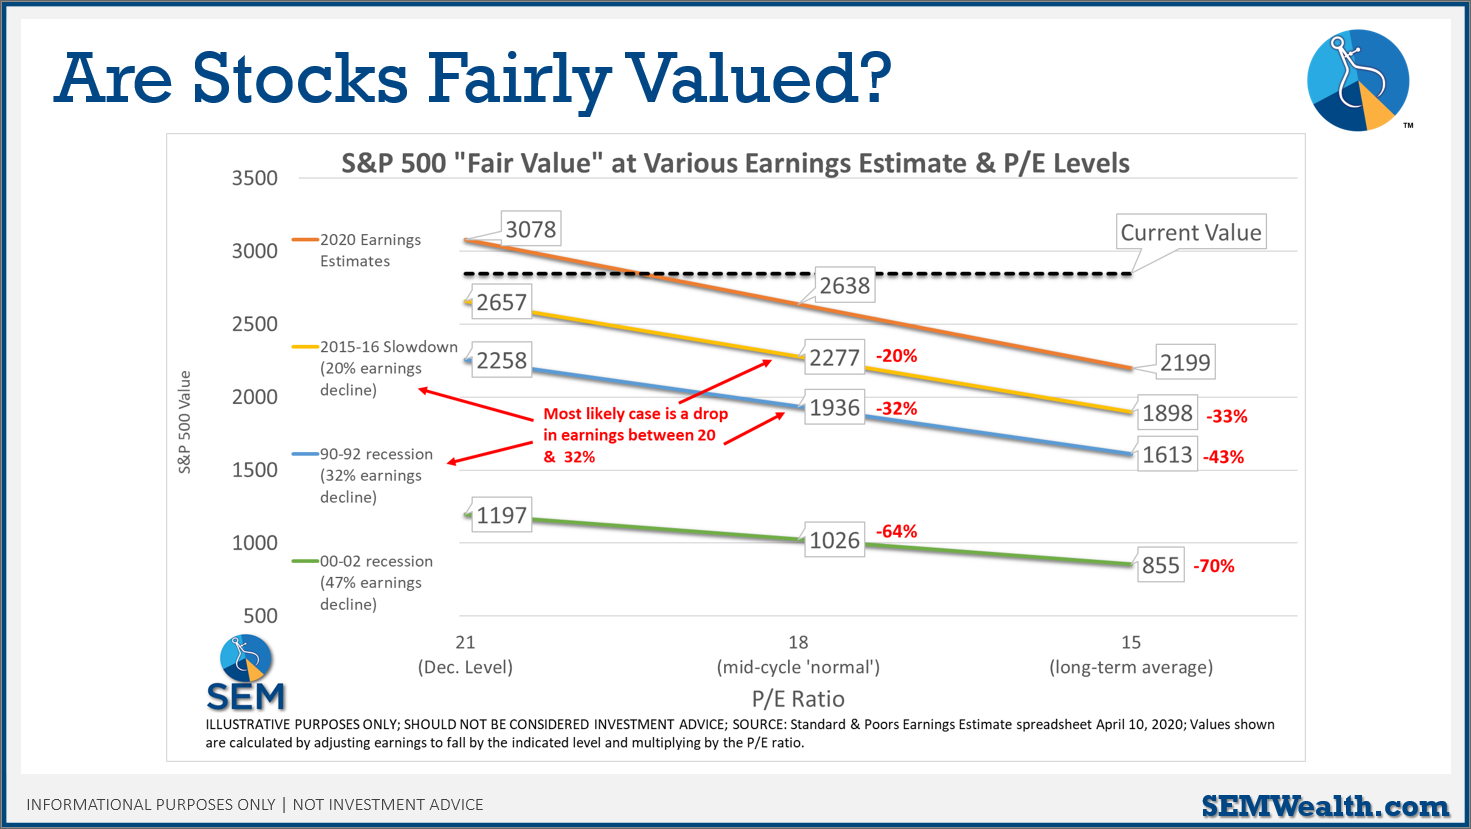
This is the risk -- if analysts are telling everyone earnings will be flat for the year, those buying stocks are assuming we will see a V-bottom. In 2015-16 (the last time anybody was worried about a recession), earnings fell 20%. In the "mild" 90-92 recession earnings fell by 30%. I'm not even talking about a 2008 or 2002 drop in earnings! If we deviate from the "V-bottom", the "surprise" will be painful and the losses swift. Based on my experience, earnings will be down significantly and the recovery is not likely going to be longer than people assume. This means from today's value (~2500) we could see another drop of 23 to 36%.
If we see earnings cut in half and a slow recovery, stocks could fall another 60% to 68% from here. I'd bet there is just as much chance of earnings being cut in half as there is of a V-bottom in earnings.
Now back to the valuation metrics............
Nobel prize winning economist Robert Shiller created the PE10/CAPE/Shiller PE, which "normalizes" earnings to take away the fluctuations of the economic cycle. He argued this helps show the real value of the stock market and helps us to identify when their is too much exuberance in the markets. This should be more favorable as the COVID-19 earnings will not impact the "E" in the ratio. Unfortunately, even with the drop in prices in the first quarter, the PE10 still shows stocks are not very attractive.
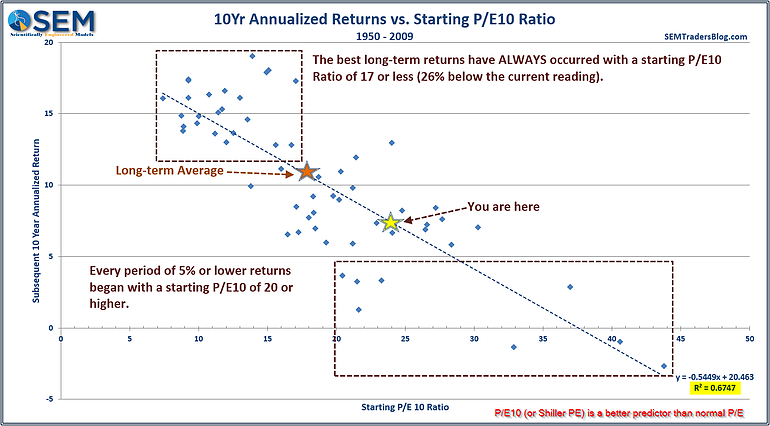
Also notice the R-squared is significantly higher for this measurement (probably why he won a Nobel prize.) The ratio started the year in the "bad" box at the bottom of the chart, but is still nowhere near the long-term average nor is it in the "good" box on the top of the chart.
As a former accountant and somebody who used to attempt to use financial statements to determine stock valuations, I've always complained about all the tricks companies can do to make earnings look better than they really are. I've often argued while you can still manipulate revenues a little bit, accounting rules and oversight have made this practice difficult. I've always preferred the Price/Sales ratio because of this. Here is an updated look at this valuation metric:
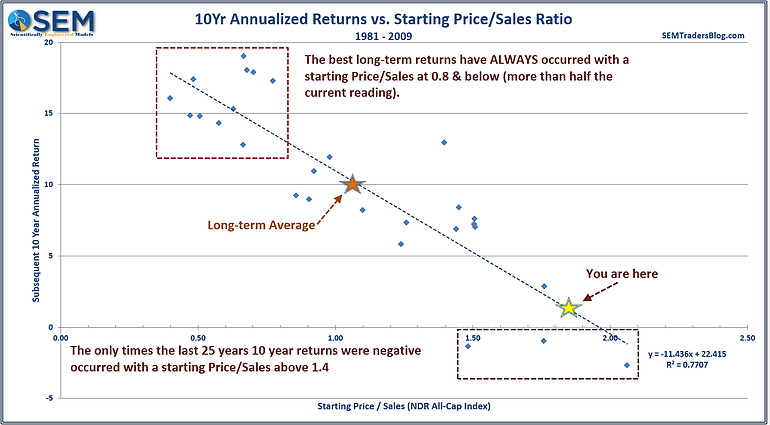
Again, the Price in the ratio reflects the drop in stock prices, but the Sales portion is using the December 2019 data. Even BEFORE the COVID-19 shutdown, stocks are not very attractive. Notice the R-squared on this metric is significantly higher than the PE10.
Long-time readers know what my favorite metric is for stock valuations -- the "Buffett Indicator," named after value investing legend, Warren Buffett. I was what you would call a Buffett Acolyte. I have a binder of his letters to shareholders going back into the early 1990s. I've read all the books about his strategies and techniques. In a 2001 interview in Forbes magazine, Mr. Buffett said the single best metric to gauge the overall value of the stock market is the ratio between the value of the stock market and the overall economy.
The concept makes sense -- over the long-term, mathematically the value of stocks cannot exceed the output of the economy. Every dollar of earnings from the corporations will eventually flow through the economy. When investors are paying significantly more for earnings than what the economy is producing, it isn't sustainable and we see a decline in prices. The chart below plots the Buffett indicator.
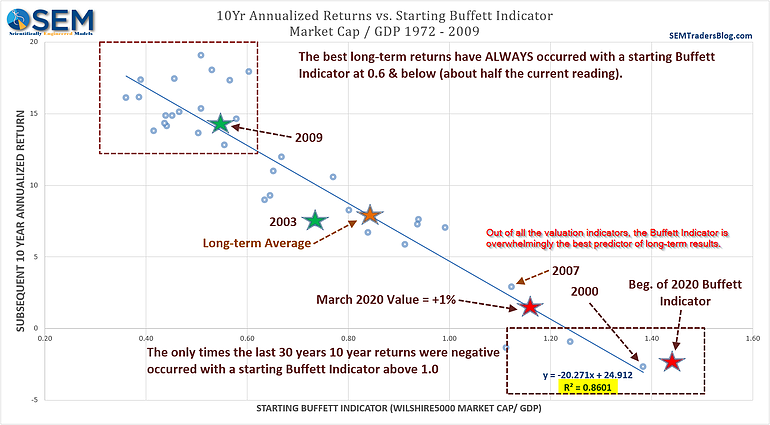
Once again, the top part of the ratio (stock prices) reflect the sell-off in stocks, but the lower part is as of December 2019 -- before the COVID-19 shutdown. Also notice the R-squared is far higher for this metric than any of the other ones I've ever looked at. It's no surprise the best value investor in our lifetimes is the one who essentially created it.
While the Buffett Indicator has improved from where it was at at the beginning 2020, note even without any economic hit, stocks simply aren't attractive at these levels if you're a long-term investor. Many of you will recall the late 2008 editorial Mr. Buffett wrote titled, "Buy American; I am." He talked about the long-term prospects for American companies and the deep discounts he saw in prices. It turns out he was buying American banks at very deep (below market) prices with lots of protections. Despite that, notice where the Buffett indicator was in 2008 versus where it is now.
I did see some reports that Mr. Buffett, who has been eerily silent for the past month, is looking at some airlines and other transportation stocks. That would make sense given the 60-80% hit some of those stocks have taken this year.
Until the Buffett Indicator moves to more attractive levels, I'm not going to be excited about stocks for long holding periods.
A Solution for Moderate and Growth Investors
Investing is about finding the best possible returns for the level of risk you are willing to take. The current valuations in the stock market make it very likely 10 years from today we'll see stocks barely above their current value. For somebody that NEEDS higher returns they cannot rely on a buy and hold strategy and HOPE everything works out. In the first half of the blog, we discussed the tremendous opportunities for our income based models. While I'm much more excited about them, that doesn't mean we don't have opportunities for Moderate and Growth oriented investors.
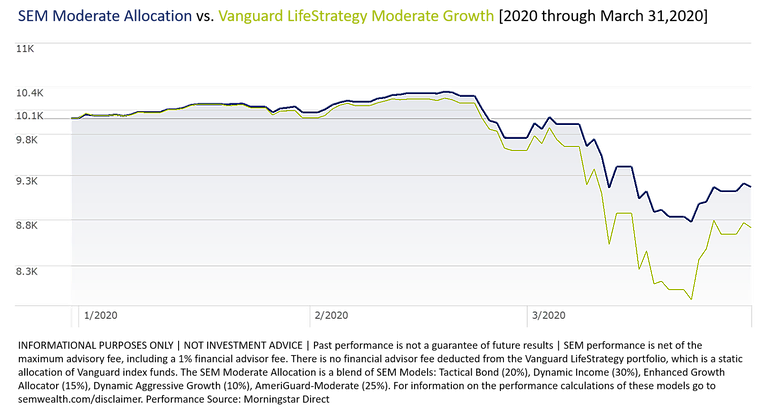
As an example, a baseline recommended portfolio we use for our "moderate" clients includes all three of our management styles: Enhanced Growth Allocator, Dynamic Aggressive Growth, and AmeriGuard-Moderate on the stock side, with Tactical Bond and Dynamic Income Allocation on the income side.
Here are the results so far in 2020. Like our Preservation strategy, we started the year fully invested. As the risks increased in the market you can see how quickly the models moved to take money out of the stock market.
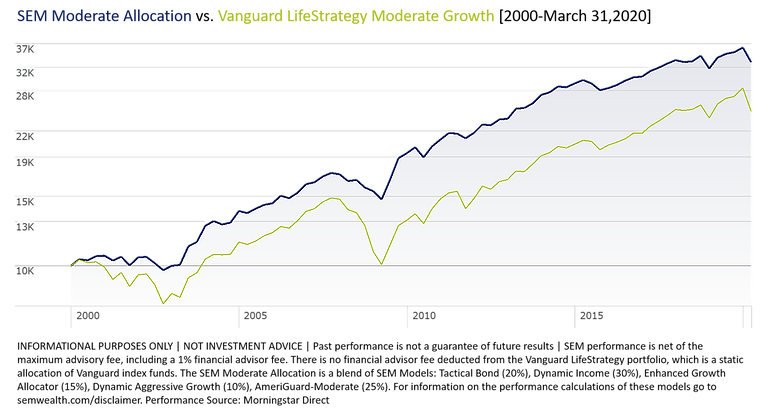
More importantly, here are the results going back to 2000. By not losing as much on the downside, not only have we provided a much smoother ride for our clients, but we still have captured a large percentage of the upside.
Given the huge amount of uncertainty and the still overvalued stock market, if you're in a buy and hold strategy I would suggest using any sort of rallies to re-allocate to portfolios which can take advantage of the disconnects that will develop in the months ahead. There will be opportunities to make money. With nearly every client we always recommend an allocation to Tactical Bond and Dynamic Income. The returns versus risk for those two models make them a good fit for most people's situations.
Exciting Improvements to AmeriGuard Models!
We also have solutions for more Aggressive clients. Since they are more fully invested more often, the potential longer-term returns are not as attractive as our other strategies, but for clients who are much younger and/or are adding money on a periodic basis, these strategies still take advantage of the disconnects that arrive during panics such as this.
As we worked on our Cornerstone Models (our Biblically Responsible Investment models) we discovered different ways to adjust the allocations for these longer-term investment models. By overlaying TWO trend indicators and monitoring it more than quarterly, we were able to increase our overall performance as well as keeping the downside risk the same.
When we created AmeriGuard we had three factors to consider which are no longer an issue (or have been mitigated): Trading Costs, Taxes, and American Funds/Vanguard trading restrictions. Trading costs were removed by E*Trade in late 2019. We made adjustments to the "core" portfolios to reduce the trading frequency and increase holding times for better tax efficiency. Finally we've transitioned to mostly ETFs, which has nearly eliminated the issues we had where American Funds and Vanguard required us to only rebalance at most once a quarter (they actually preferred only once a year rebalances.)
This chart shows the difference in allocation signals overlapped on the S&P 500. What is interesting is with two indicators, which are monitored daily, the allocation adjustments only increased from 21 times to 26 times going back to 2000. These indicators have been used in other models in real-time, but have been repurposed to work inside AmeriGuard (and Cornerstone). The changes though allow us to be at our maximum investment 80% of the time instead of 71% in the older version.
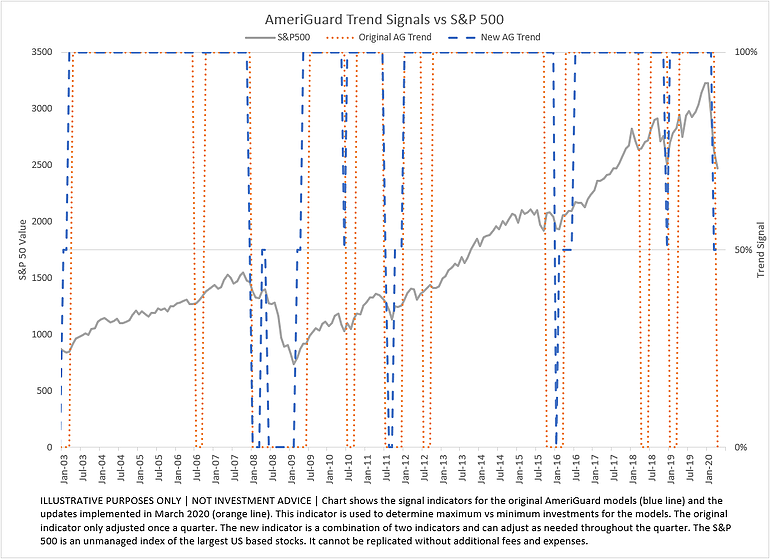
Most importantly as we go through a time of great uncertainty, we will be able to adjust the AmeriGuard (and Cornerstone) models based on market trends rather than the calendar. This is a huge improvement for both of these model sets. As a reminder, they all have upper and lower bands in terms of stock exposure: (Balanced = 30 to 70%, Moderate = 50 to 90%, and Growth = 70 to 100%). Max is always invested and still will re-balance quarterly to the top ranked asset classes. A 50% signal would mean the allocation is set at the half-way point of the bands. 0% would take the allocation to the lower band.
Caution is Warranted......
......with any investments you have outside SEM. Fortunes can be made during market panics, but sadly over the past 20 years I've been doing this I see far more people ruining their financial plans by making the wrong choices. I hope the fear in the market is overblown, but hope is not a strategy. Please be careful. SEM was built for environments like this where we are literally spending every day monitoring the markets, the various asset classes, and all of our trading systems. We have the experience to help our clients get through this.
If you have assets outside SEM, I'd encourage you to talk to your advisor about the role they play in your overall portfolio and if possible use any rebounds in the market to migrate over to SEM's models. If you've been happy with your performance I'd encourage you to talk to your friends and family about your experience. There is a lot of bad information and bad allocations I've seen going around. The longer this goes on, the worse it's going to get.
If you're an advisor not using SEM or using other managers, now is the time to be proactive. There are huge opportunities, but also huge risks. Your clients are expecting you to be able to navigate this no matter the outcome. We'd love to help.


