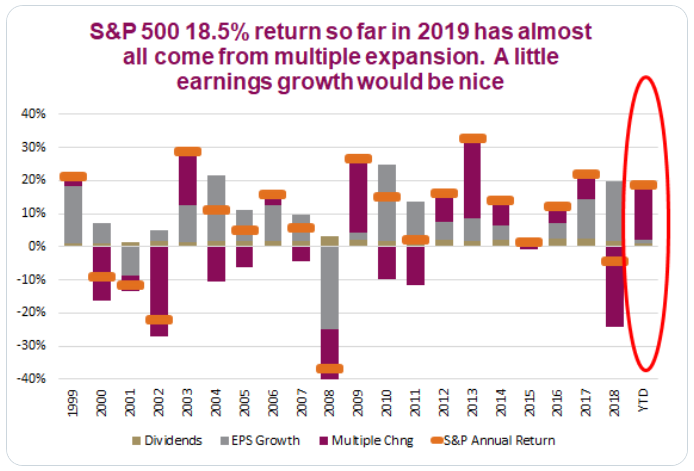
The stock market is supposed to be “efficient”, which means it is pricing in the current value of all future earnings for the component companies. Of course, nobody knows what those future earnings will be, so we often see wide swings between investors who are overly optimistic and
Tag: Chart of the Week
Last March the markets panicked as the yield curve “inverted”. It inverted once again this week causing a sharp sell-off on Wednesday. An inverted yield curve means short-term interest rates are higher than long-term interest rates. This has long been known as a leading indicator of a recession.
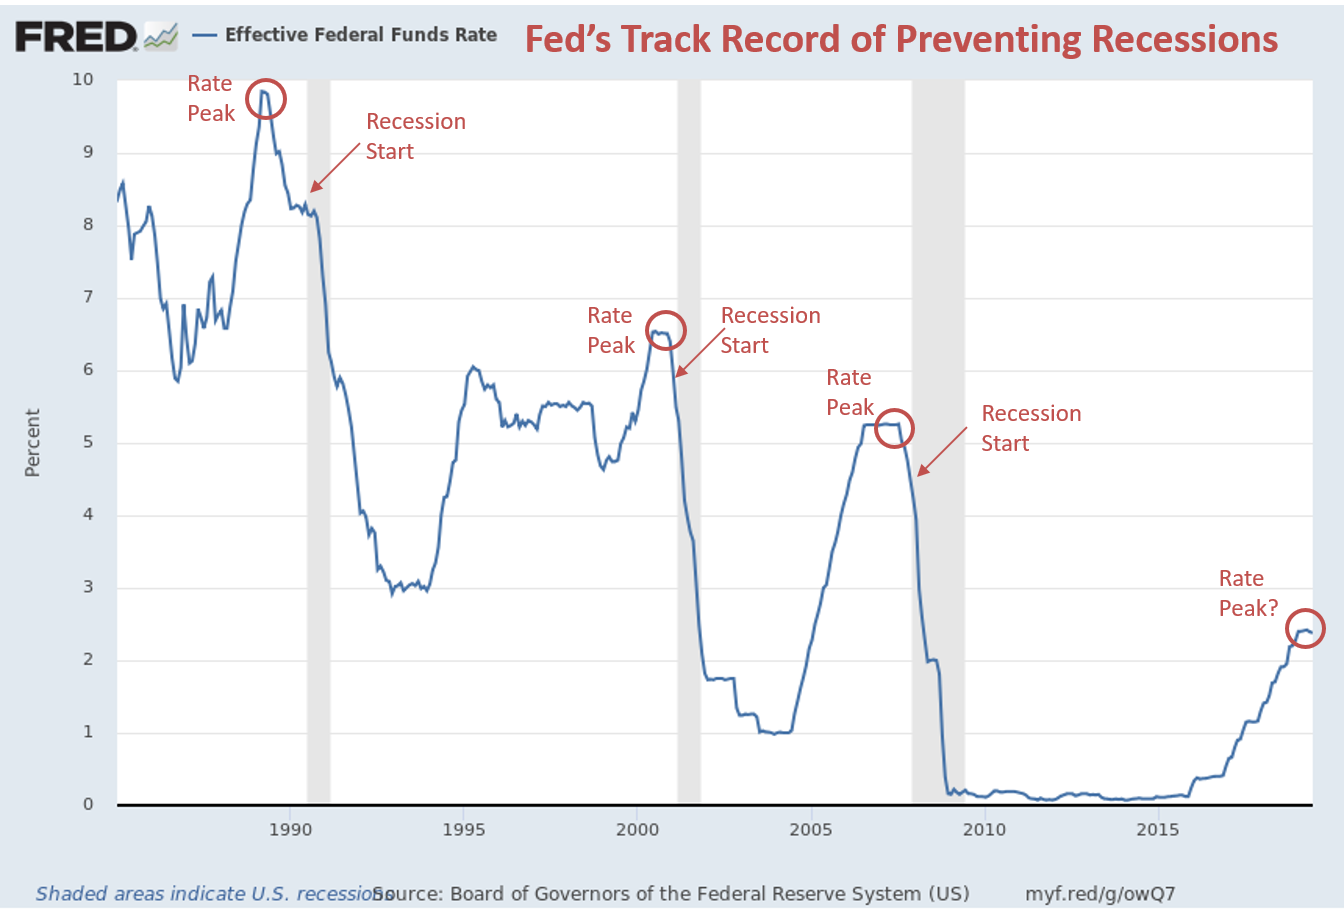
Some pundits have postulated that the President’s “hold my beer” tweet following the Fed’s decision to “only” cut interest rates by 1/4% instead of 1/2% was to force the Fed’s hand into cutting rates much more significantly in
The Federal reserve cut interest rates for the first time since 2008. Since late 2015, they have raised short-term interest rates from near 0% to 2.25%. Since June when the Fed hinted at the chances they would cut rates at their next meeting, investors have poured money into the
Here’s a quick look at the most important charts from our 3rd Quarter Market & Economic Update.
- Check out the full 30 minute update here (including a link to download our entire chart packet).
- Read the ‘Investment Grade Junk’ article referenced in the update here.
I realize some of


